| Param | Original file | Final file |
|---|---|---|
| Filename | modeM0/AS1A14_022T04_9000006506_53781cztM0_level2.fits | modeM0/AS1A14_022T04_9000006506_53781cztM0_level2_quad_clean.evt |
| Size (bytes) | 1,052,680,320 | 80,049,600 |
| Size | 1003.9 MB | 76.3 MB |
| Events in quadrant A | 17,929,075 | 10,097 |
| Events in quadrant B | 4,947,508 | 735,172 |
| Events in quadrant C | 9,107,278 | 577,427 |
| Events in quadrant D | 6,412,560 | 587,216 |
| Mode M0 | |||
|---|---|---|---|
| Quadrant | BADHDUFLAG | Total packets | Discarded packets |
| A | 0 | 58371 | 34 |
| B | 0 | 19789 | 12 |
| C | 0 | 32246 | 30 |
| D | 0 | 24119 | 26 |
| Mode SS | |||
|---|---|---|---|
| Quadrant | BADHDUFLAG | Total packets | Discarded packets |
| A | 0 | 148 | 0 |
| B | 0 | 148 | 0 |
| C | 0 | 148 | 0 |
| D | 0 | 148 | 0 |
| Quadrant | Total seconds | Saturated seconds | Saturation percentage |
|---|---|---|---|
| A | 7377 | 7298 | 98.929104% |
| B | 7378 | 158 | 2.141502% |
| C | 7377 | 1269 | 17.202115% |
| D | 7375 | 645 | 8.745763% |
Noise dominated data is calculated using 1-second bins in cleaned event files. If a bin has >2000 counts, and if more than 50% of those come from <1% of pixels, then it is considered to be noise-dominated and hence unusable.
| Quadrant | # 1 sec bins | Bins with >0 counts | Bins with >2000 counts | High rate bins dominated by noise | Noise dominated (total time) | Noise dominated (detector-on time) | Marked lightcurve |
|---|---|---|---|---|---|---|---|
| A | 7381 | 7381 | 6448 | 6448 | 87.36% | 87.36% | 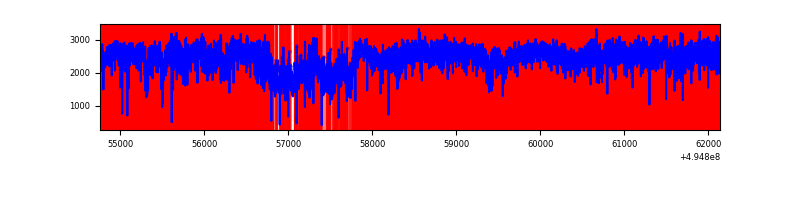 |
| B | 7382 | 7381 | 69 | 69 | 0.93% | 0.93% | 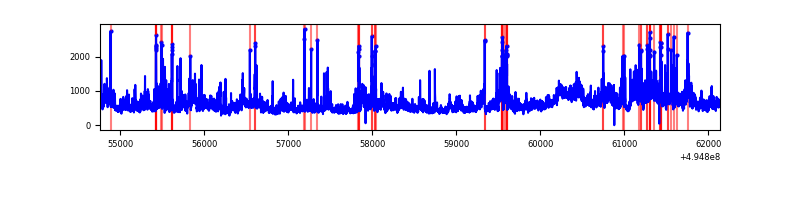 |
| C | 7382 | 7381 | 1211 | 1211 | 16.40% | 16.41% | 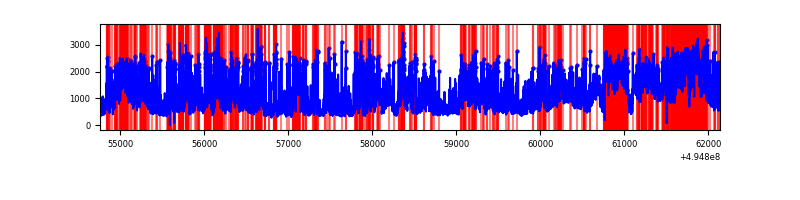 |
| D | 7382 | 7379 | 670 | 670 | 9.08% | 9.08% | 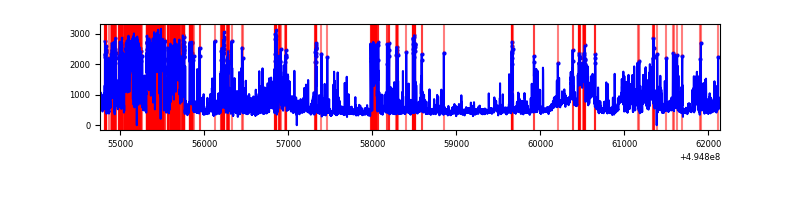 |
Top three noisy pixels from each quadrant. If the there are fewer than three noisy pixels in the level2.evt file, extra rows are filled as -1
| Pixel properties | Quadrant properties | ||||||
|---|---|---|---|---|---|---|---|
| Quadrant | DetID | PixID | Counts | Sigma | Mean | Median | Sigma |
| A | 3 | 63 | 15744533 | 323378.31 | 188 | 184 | 48.7 |
| A | 3 | 78 | 1330456 | 27322.89 | 188 | 184 | 48.7 |
| A | 8 | 6 | 28124 | 573.87 | 188 | 184 | 48.7 |
| B | 7 | 0 | 1089087 | 6468.8 | 777 | 748 | 168.2 |
| B | 5 | 250 | 185506 | 1098.15 | 777 | 748 | 168.2 |
| B | 5 | 185 | 184350 | 1091.28 | 777 | 748 | 168.2 |
| C | 15 | 224 | 2870863 | 14417.5 | 724 | 721 | 199.1 |
| C | 15 | 158 | 2289215 | 11495.72 | 724 | 721 | 199.1 |
| C | 15 | 147 | 213357 | 1068.13 | 724 | 721 | 199.1 |
| D | 1 | 241 | 2297478 | 10760.26 | 749 | 716 | 213.4 |
| D | 7 | 70 | 334734 | 1564.86 | 749 | 716 | 213.4 |
| D | 3 | 12 | 123624 | 575.82 | 749 | 716 | 213.4 |
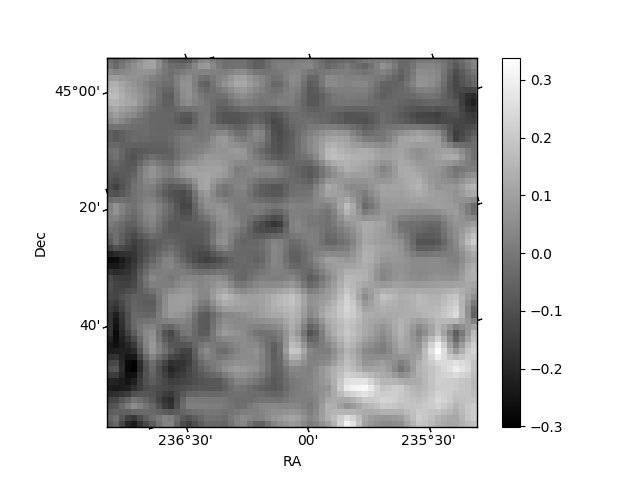
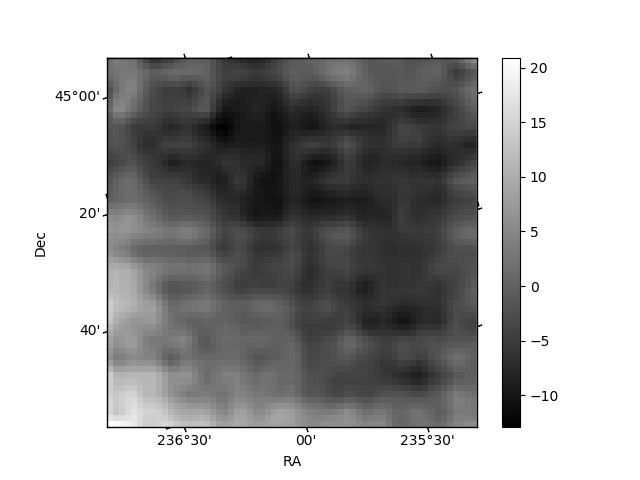
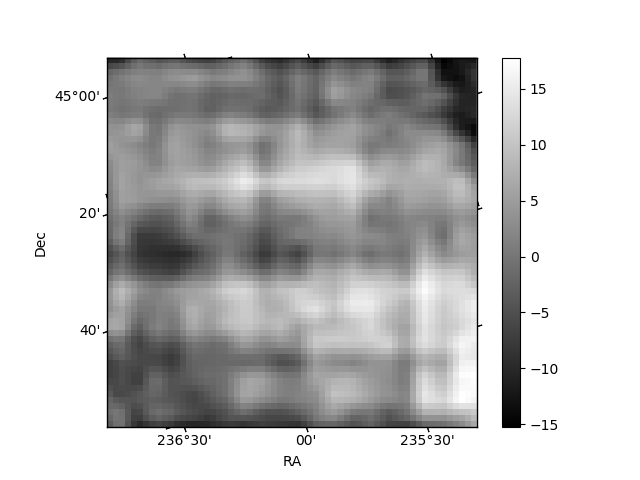
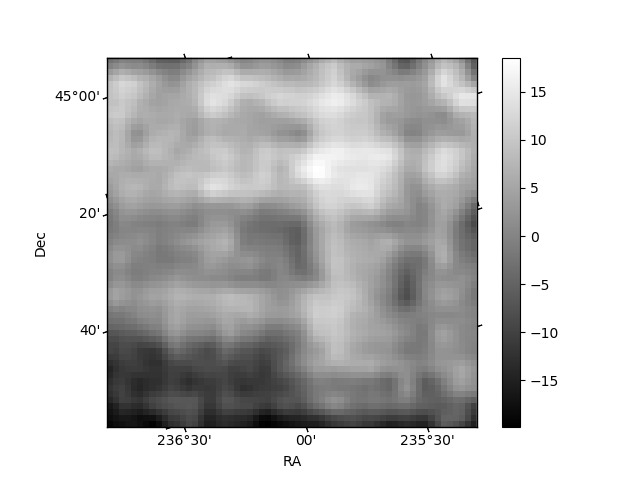
Histogram calculated using DETX and DETY for each event in the final _common_clean file
| Quadrant A | 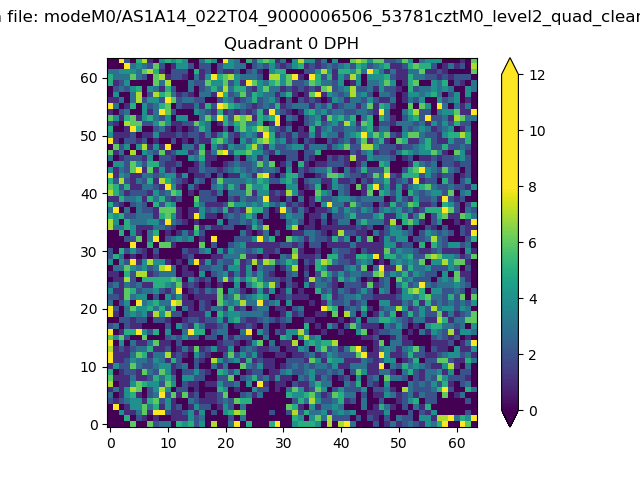 |
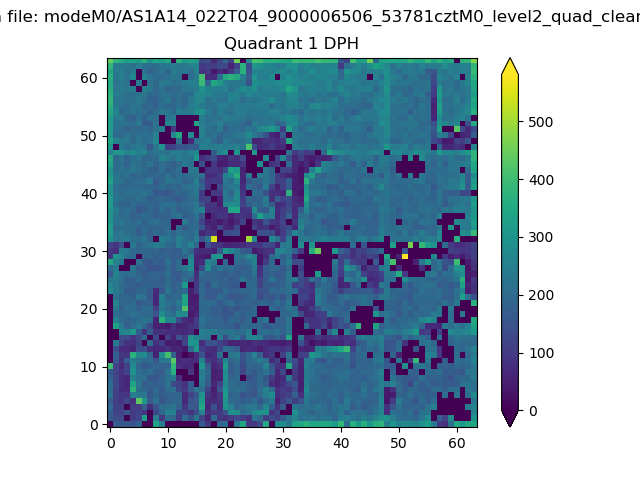 |
Quadrant B |
|---|---|---|---|
| Quadrant D | 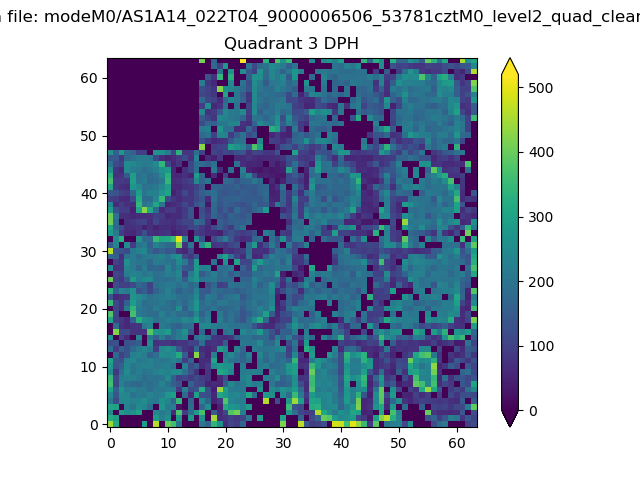 |
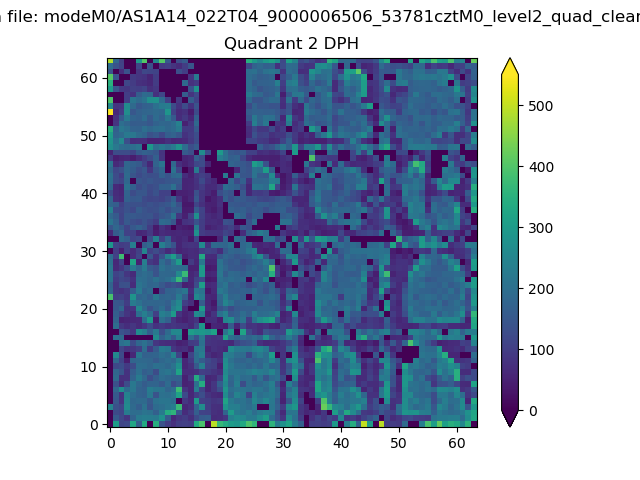 |
Quadrant C |
| Plot type | Count rate plots | Images |
|---|---|---|
| Comparison with Poisson distribution Blue bars denote a histogram of data divided into 1 sec bins. Red curve is a Poisson curve with rate = median count rate of data. |
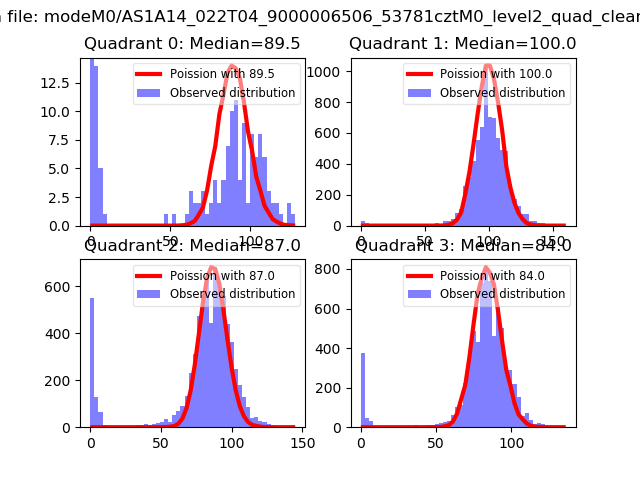 |
 |
| Quadrant-wise count rates Data is divided into 100 sec bins |
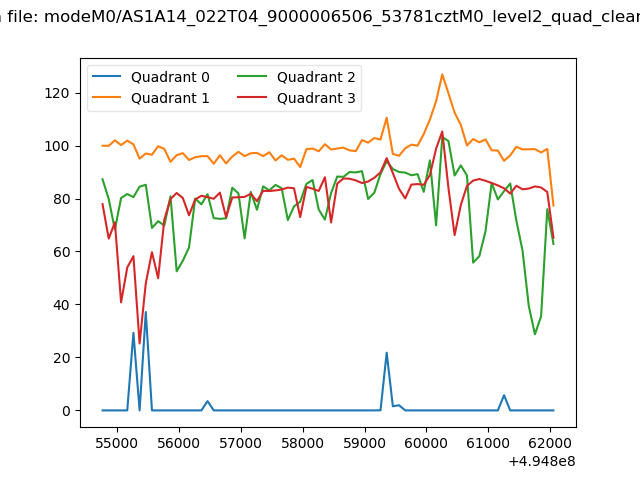 |
|
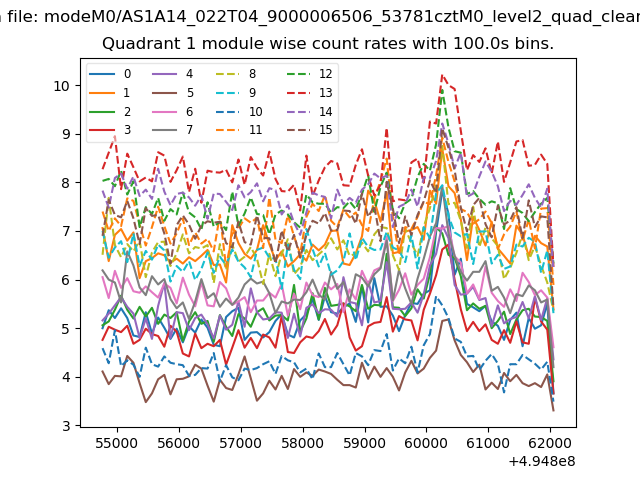
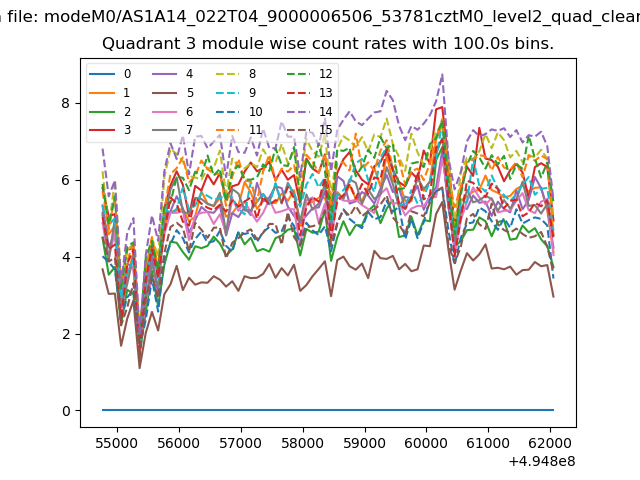
| Module-wise count rates for Quadrant A Data is divided into 100 sec bins |
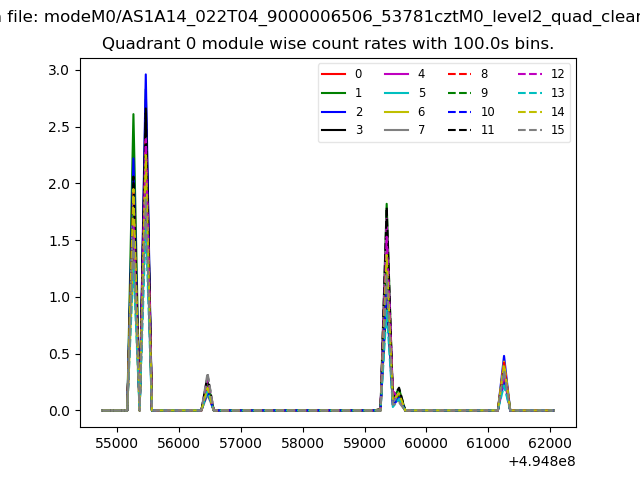 |
 |
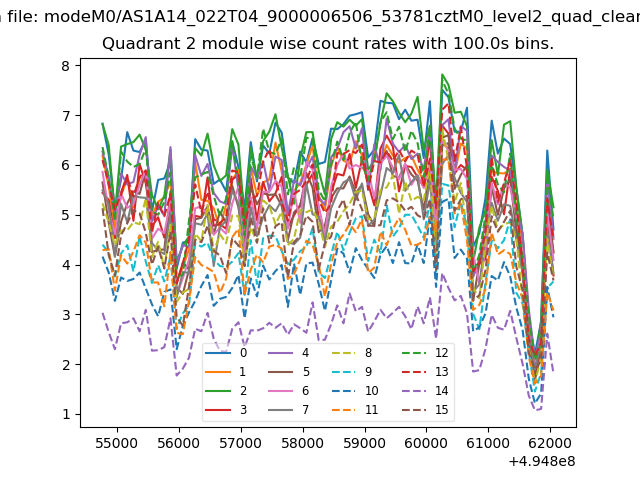
| Module-wise count rates for Quadrant B Data is divided into 100 sec bins |
 |
 |
| Module-wise count rates for Quadrant C Data is divided into 100 sec bins |
 |
 |
| Module-wise count rates for Quadrant D Data is divided into 100 sec bins |
 |
 |
| Parameter | Plot |
|---|---|
| CZT HV Monitor | 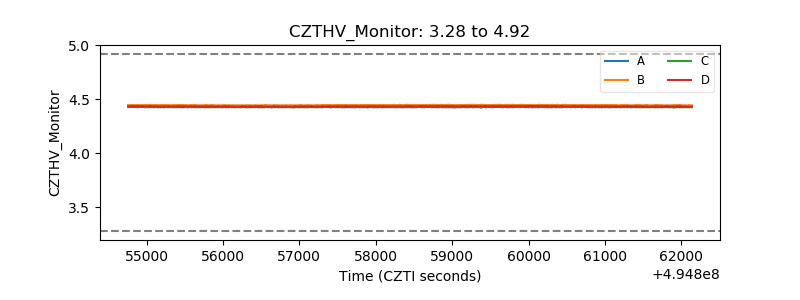 |
| D_VDD | 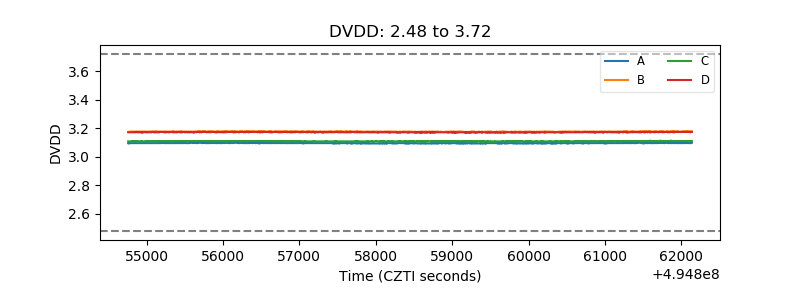 |
| Temperature 1 | 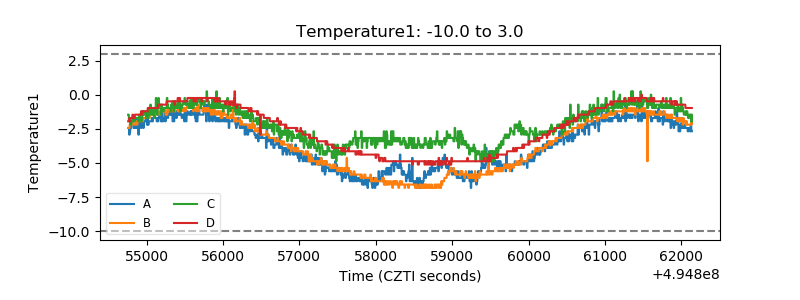 |
| Veto HV Monitor | 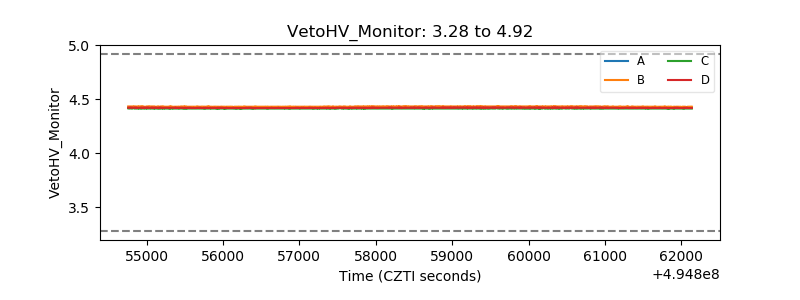 |
| Veto LLD | 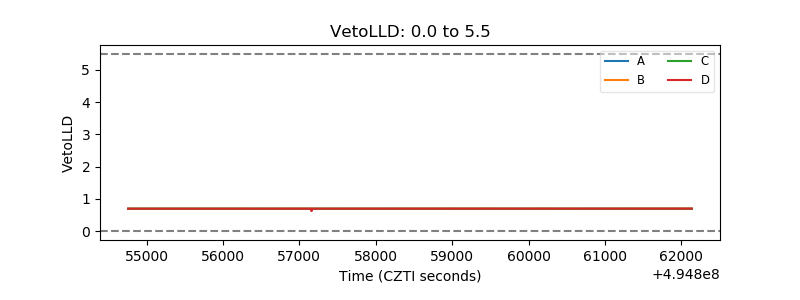 |
| Alpha Counter | 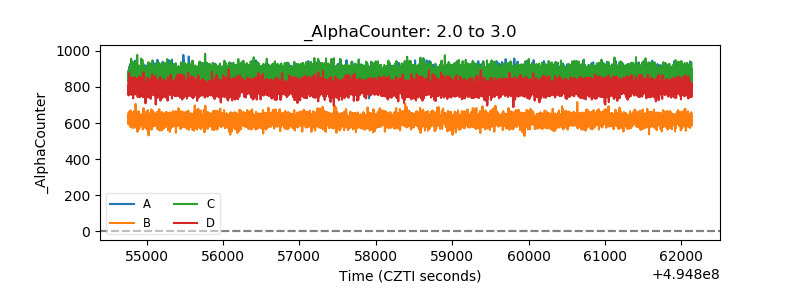 |
| _CPM_Rate | 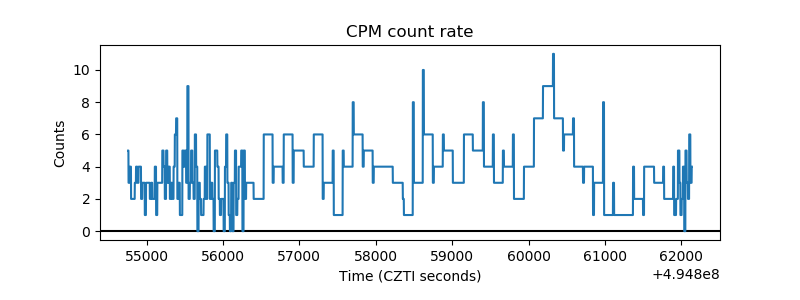 |
| CZT Counter | 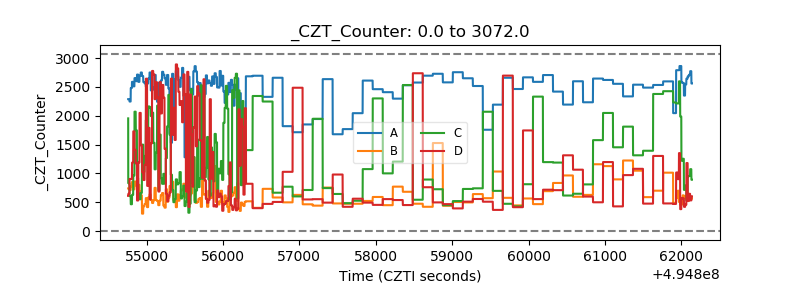 |
| +2.5 Volts monitor | 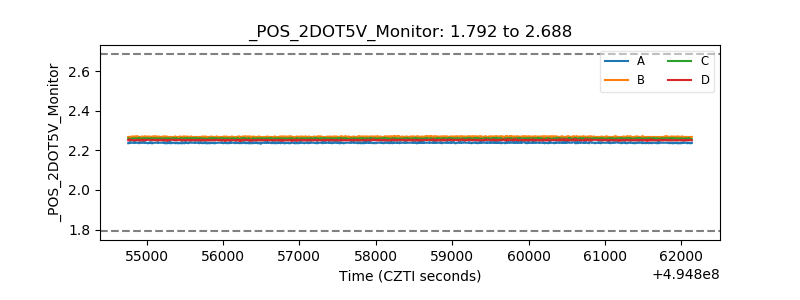 |
| +5 Volts monitor |  |
| _ROLL_ROT | 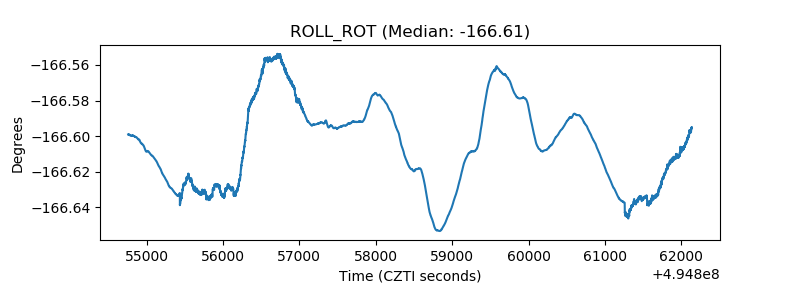 |
| _Roll_DEC | 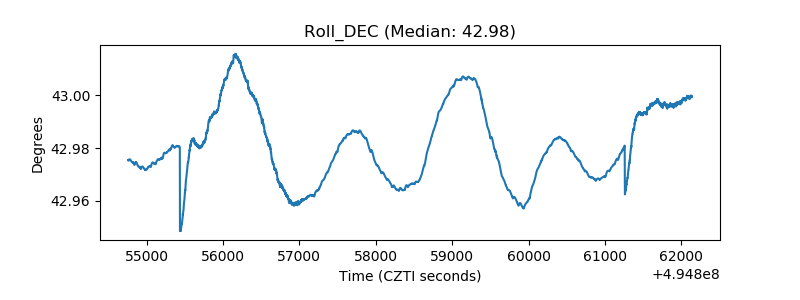 |
| _Roll_RA | 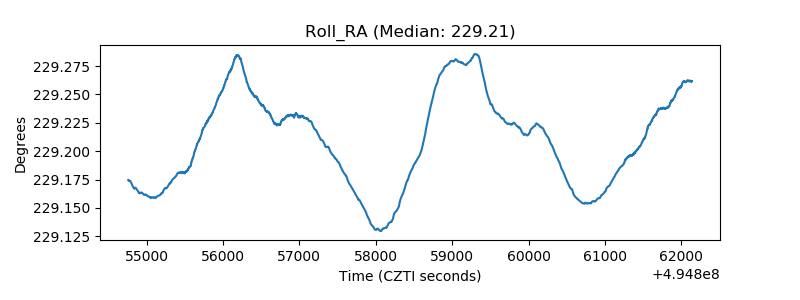 |
| Veto Counter | 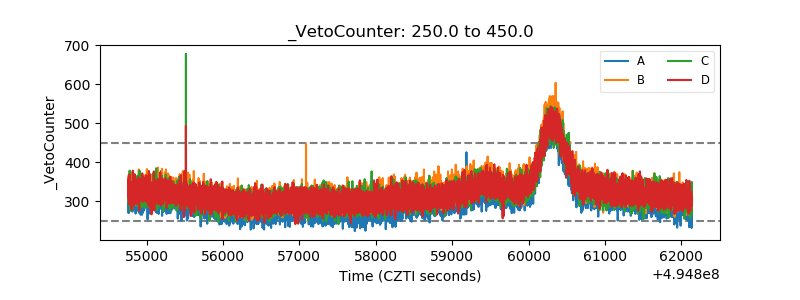 |