| Param | Original file | Final file |
|---|---|---|
| Filename | modeM0/AS1A14_022T04_9000006506_53784cztM0_level2.fits | modeM0/AS1A14_022T04_9000006506_53784cztM0_level2_quad_clean.evt |
| Size (bytes) | 2,522,229,120 | 199,909,440 |
| Size | 2.3 GB | 190.6 MB |
| Events in quadrant A | 47,039,821 | 14,621 |
| Events in quadrant B | 10,466,737 | 1,813,446 |
| Events in quadrant C | 19,790,204 | 1,449,515 |
| Events in quadrant D | 14,645,294 | 1,504,001 |
| Mode M0 | |||
|---|---|---|---|
| Quadrant | BADHDUFLAG | Total packets | Discarded packets |
| A | 0 | 152561 | 18 |
| B | 0 | 43899 | 3 |
| C | 0 | 71654 | 9 |
| D | 0 | 56566 | 8 |
| Mode SS | |||
|---|---|---|---|
| Quadrant | BADHDUFLAG | Total packets | Discarded packets |
| A | 0 | 370 | 0 |
| B | 0 | 370 | 0 |
| C | 0 | 370 | 0 |
| D | 0 | 370 | 0 |
| Mode M9 | |||
|---|---|---|---|
| Quadrant | BADHDUFLAG | Total packets | Discarded packets |
| A | 0 | 16 | 0 |
| B | 0 | 16 | 0 |
| C | 0 | 16 | 0 |
| D | 0 | 16 | 0 |
| Quadrant | Total seconds | Saturated seconds | Saturation percentage |
|---|---|---|---|
| A | 18447 | 18336 | 99.398276% |
| B | 18449 | 467 | 2.531303% |
| C | 18447 | 2587 | 14.023961% |
| D | 18447 | 954 | 5.171573% |
Noise dominated data is calculated using 1-second bins in cleaned event files. If a bin has >2000 counts, and if more than 50% of those come from <1% of pixels, then it is considered to be noise-dominated and hence unusable.
| Quadrant | # 1 sec bins | Bins with >0 counts | Bins with >2000 counts | High rate bins dominated by noise | Noise dominated (total time) | Noise dominated (detector-on time) | Marked lightcurve |
|---|---|---|---|---|---|---|---|
| A | 19829 | 18452 | 17552 | 17552 | 88.52% | 95.12% | 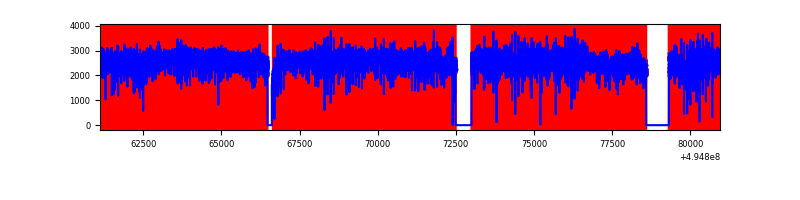 |
| B | 19829 | 18452 | 177 | 177 | 0.89% | 0.96% | 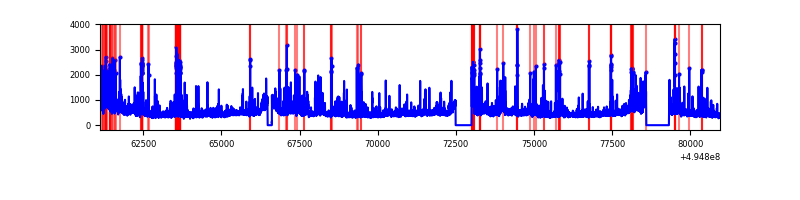 |
| C | 19829 | 18451 | 2303 | 2303 | 11.61% | 12.48% | 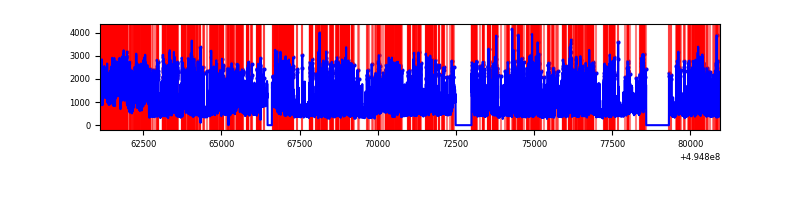 |
| D | 19829 | 18451 | 932 | 932 | 4.70% | 5.05% | 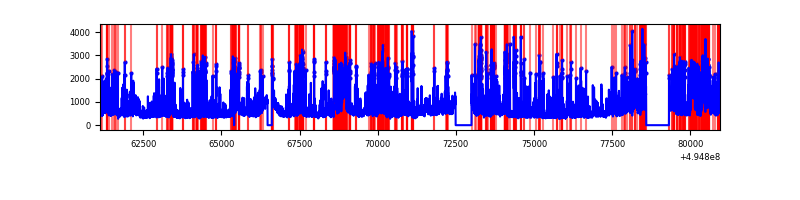 |
Top three noisy pixels from each quadrant. If the there are fewer than three noisy pixels in the level2.evt file, extra rows are filled as -1
| Pixel properties | Quadrant properties | ||||||
|---|---|---|---|---|---|---|---|
| Quadrant | DetID | PixID | Counts | Sigma | Mean | Median | Sigma |
| A | 3 | 63 | 41964569 | 328349.91 | 500 | 486 | 127.8 |
| A | 3 | 78 | 2357973 | 18446.27 | 500 | 486 | 127.8 |
| A | 8 | 6 | 408575 | 3193.11 | 500 | 486 | 127.8 |
| B | 7 | 0 | 1195307 | 2896.15 | 1925 | 1857 | 412.1 |
| B | 5 | 185 | 381071 | 920.24 | 1925 | 1857 | 412.1 |
| B | 0 | 213 | 373371 | 901.55 | 1925 | 1857 | 412.1 |
| C | 15 | 224 | 8252898 | 16461.68 | 1816 | 1799 | 501.2 |
| C | 15 | 158 | 2201612 | 4388.82 | 1816 | 1799 | 501.2 |
| C | 9 | 38 | 682065 | 1357.19 | 1816 | 1799 | 501.2 |
| D | 1 | 241 | 2874991 | 5312.36 | 1885 | 1801 | 540.9 |
| D | 10 | 172 | 1464663 | 2704.75 | 1885 | 1801 | 540.9 |
| D | 2 | 153 | 637463 | 1175.3 | 1885 | 1801 | 540.9 |
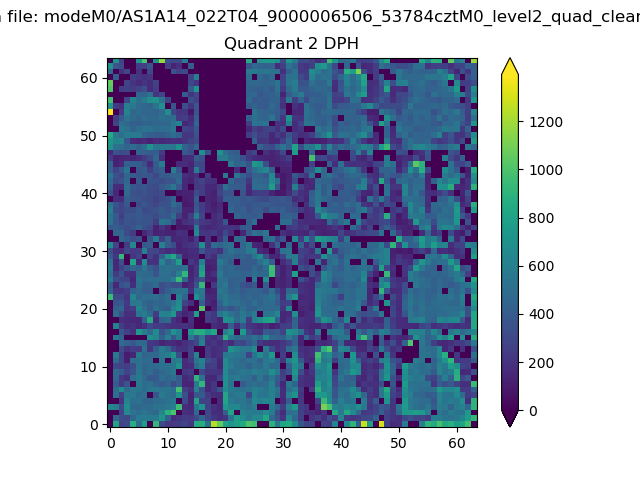
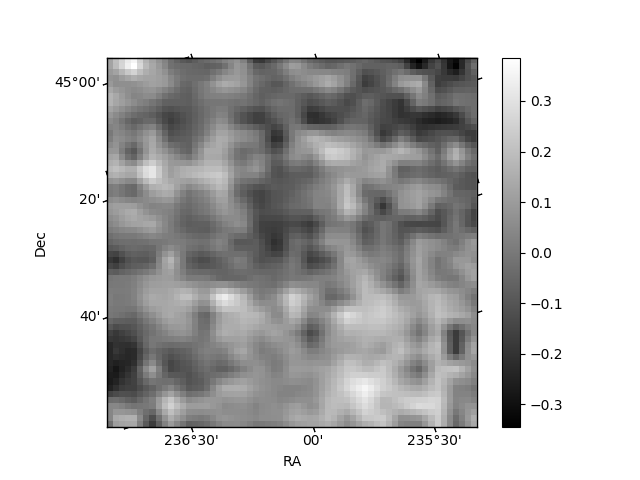
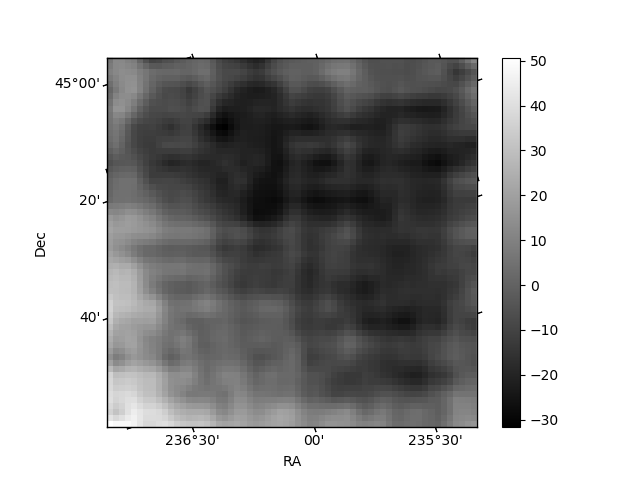
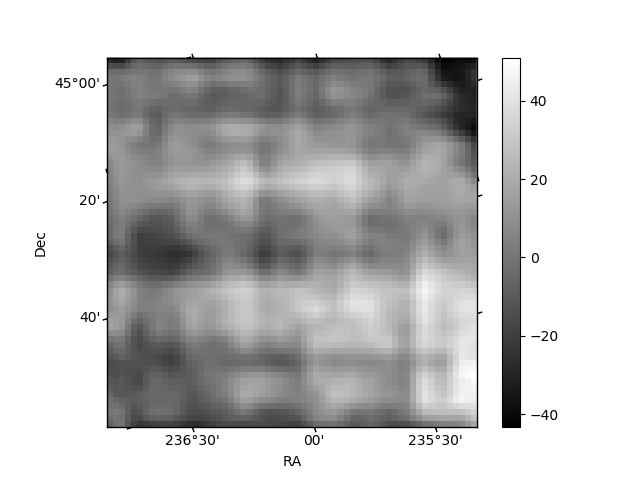
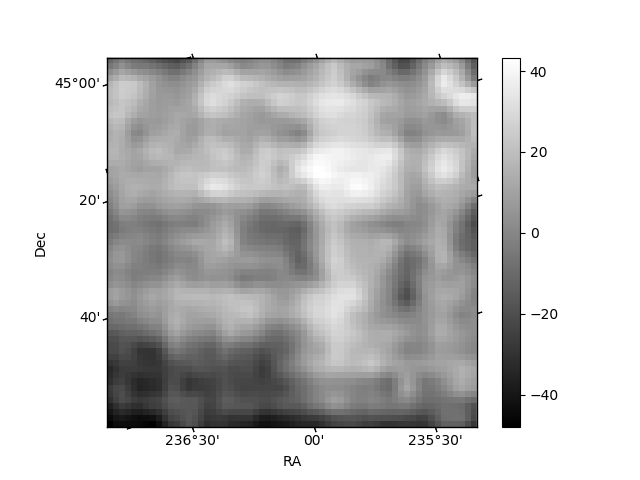
Histogram calculated using DETX and DETY for each event in the final _common_clean file
| Quadrant A | 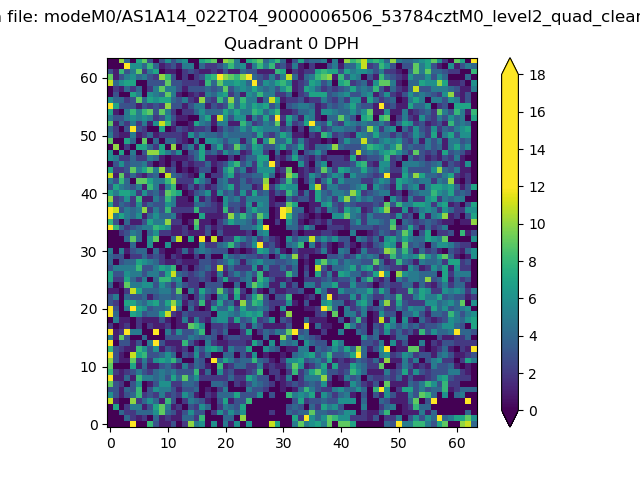 |
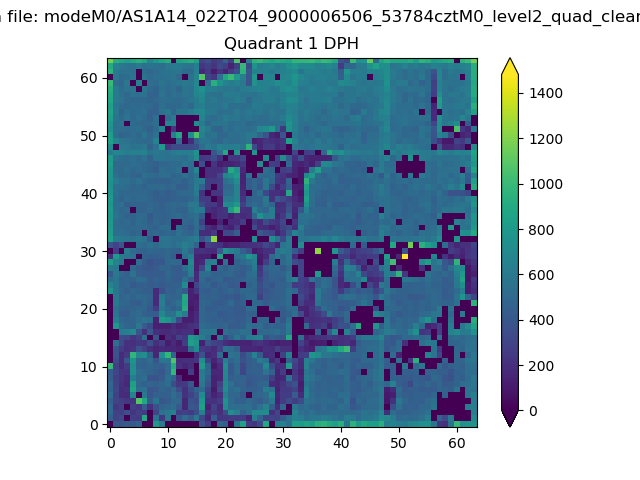 |
Quadrant B |
|---|---|---|---|
| Quadrant D | 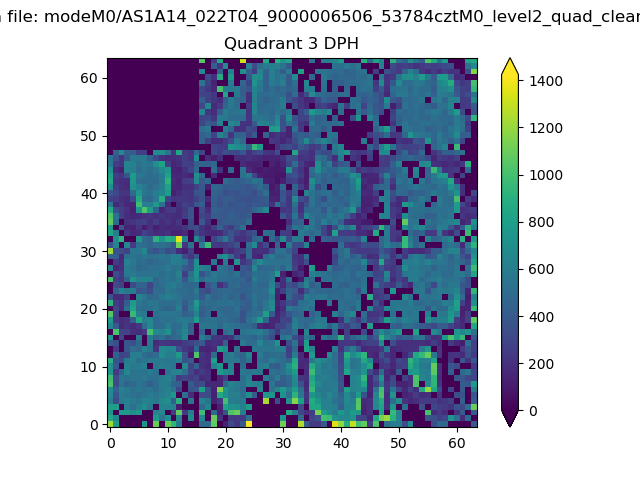 |
 |
Quadrant C |
| Plot type | Count rate plots | Images |
|---|---|---|
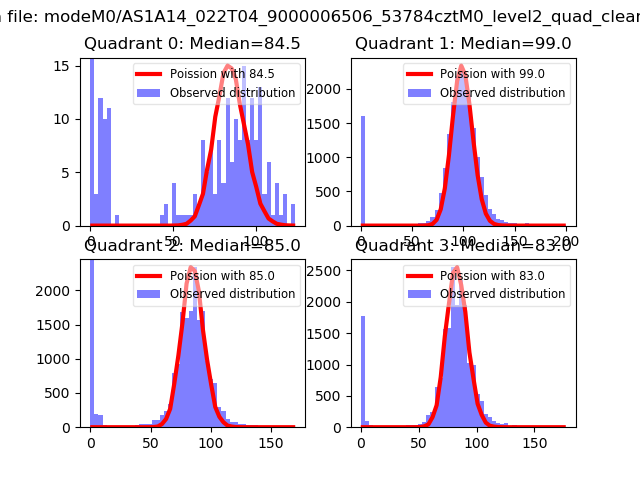
| Comparison with Poisson distribution Blue bars denote a histogram of data divided into 1 sec bins. Red curve is a Poisson curve with rate = median count rate of data. |
 |
 |
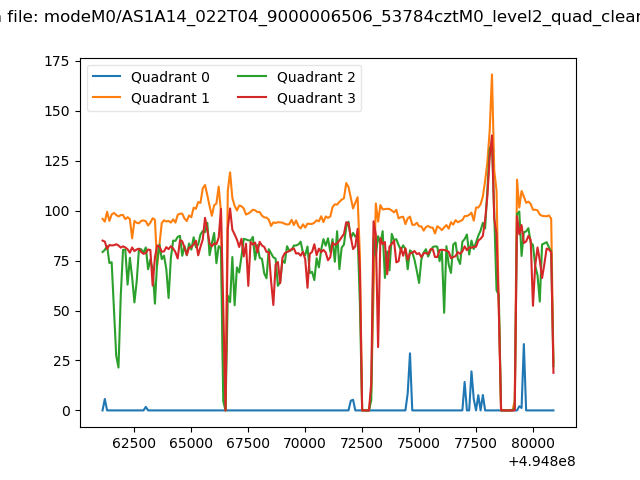
| Quadrant-wise count rates Data is divided into 100 sec bins |
 |
|
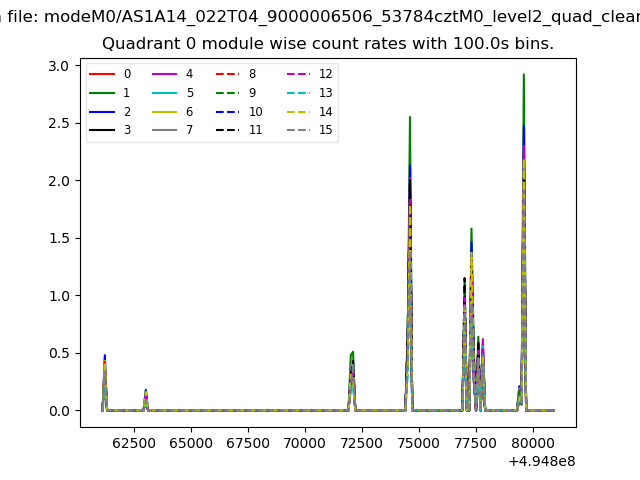
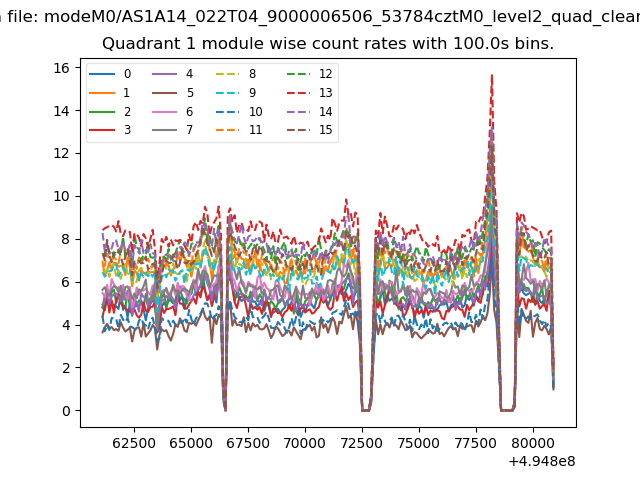
| Module-wise count rates for Quadrant A Data is divided into 100 sec bins |
 |
 |
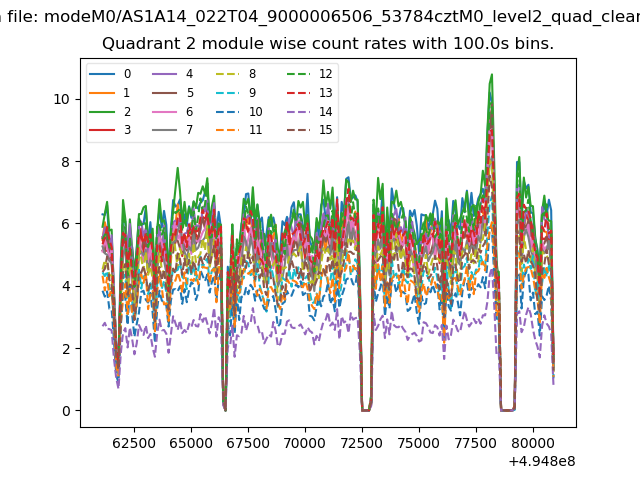
| Module-wise count rates for Quadrant B Data is divided into 100 sec bins |
 |
 |
| Module-wise count rates for Quadrant C Data is divided into 100 sec bins |
 |
 |
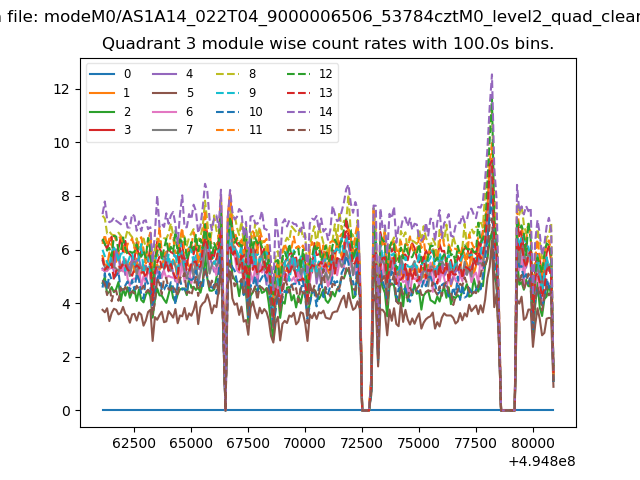
| Module-wise count rates for Quadrant D Data is divided into 100 sec bins |
 |
 |
| Parameter | Plot |
|---|---|
| CZT HV Monitor | 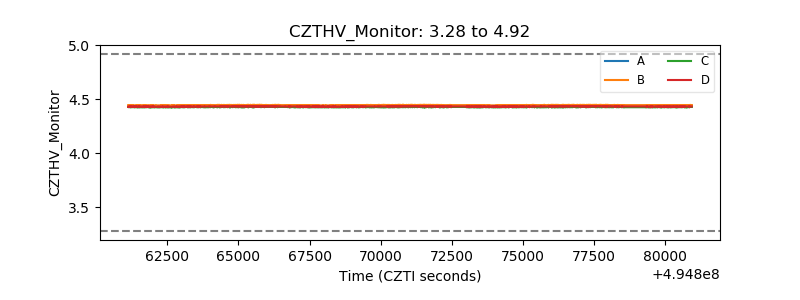 |
| D_VDD | 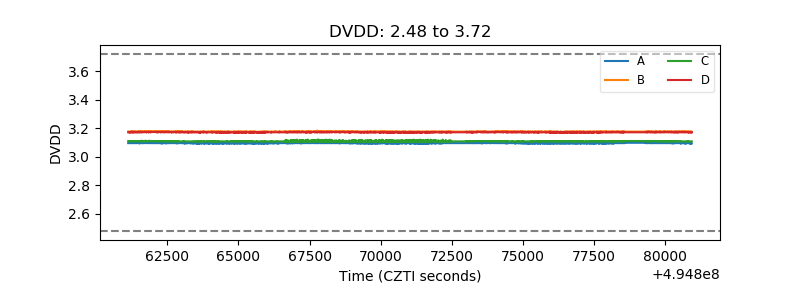 |
| Temperature 1 | 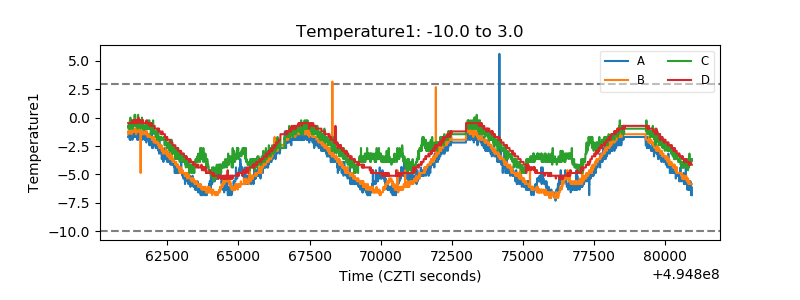 |
| Veto HV Monitor | 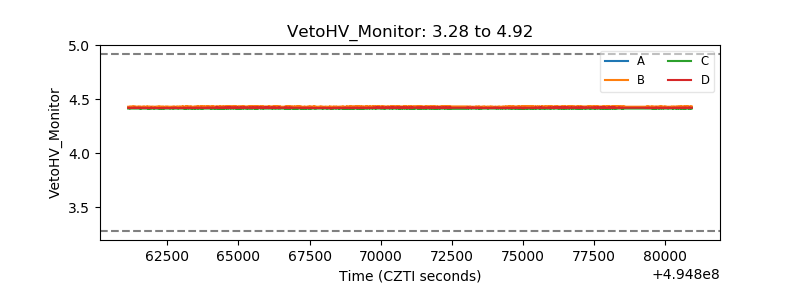 |
| Veto LLD | 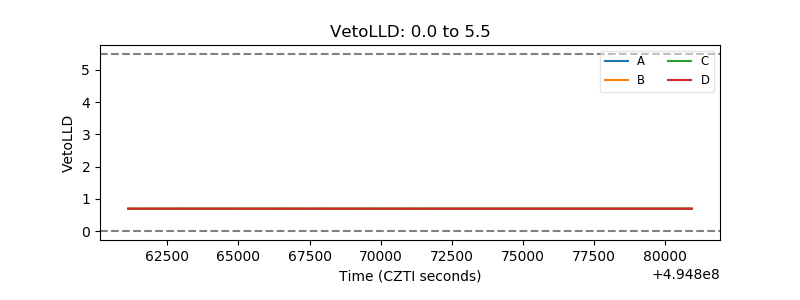 |
| Alpha Counter | 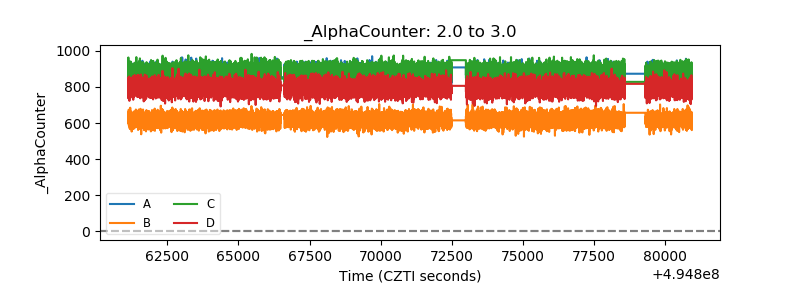 |
| _CPM_Rate | 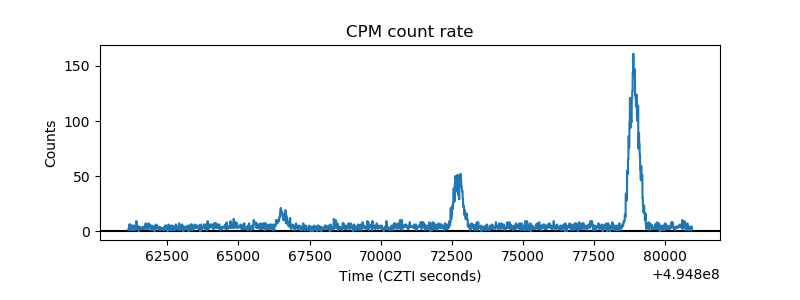 |
| CZT Counter | 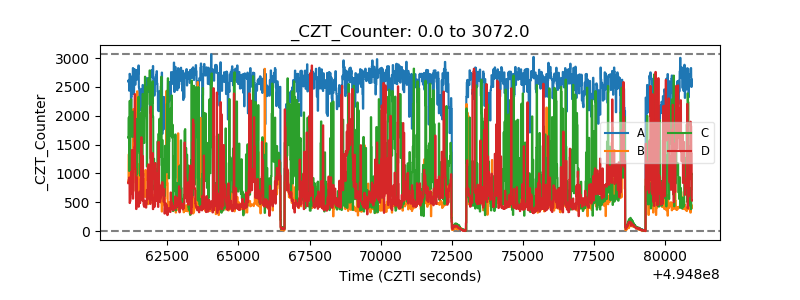 |
| +2.5 Volts monitor |  |
| +5 Volts monitor | 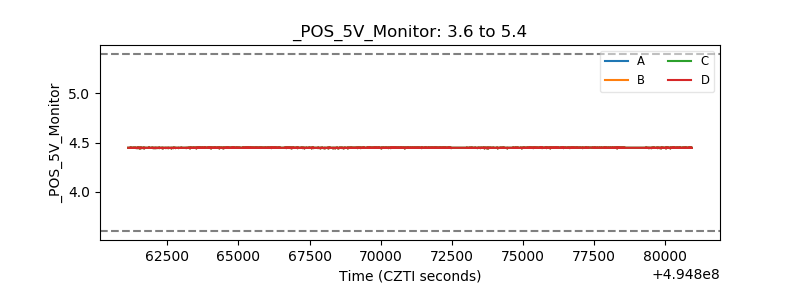 |
| _ROLL_ROT | 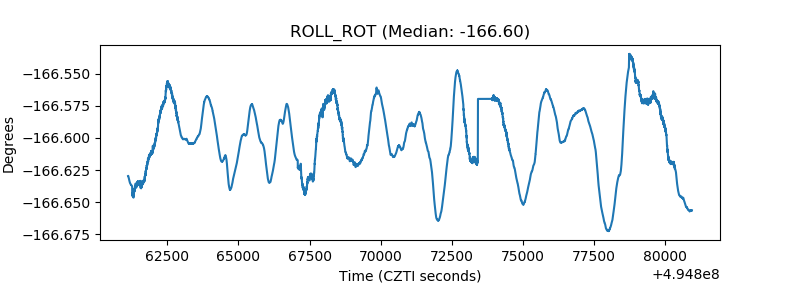 |
| _Roll_DEC | 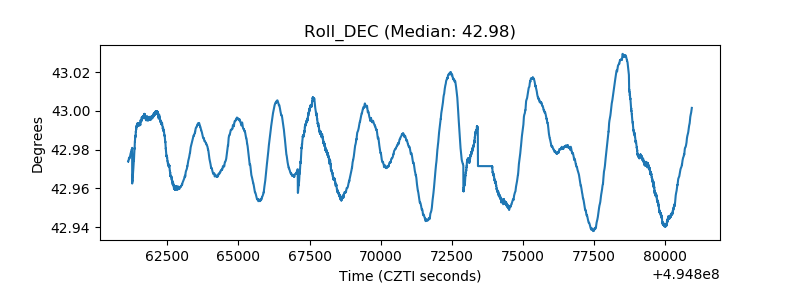 |
| _Roll_RA | 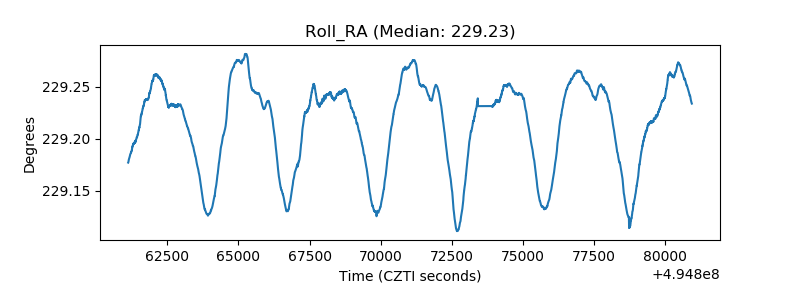 |
| Veto Counter |  |