| Param | Original file | Final file |
|---|---|---|
| Filename | modeM0/AS1A14_022T04_9000006506_53787cztM0_level2.fits | modeM0/AS1A14_022T04_9000006506_53787cztM0_level2_quad_clean.evt |
| Size (bytes) | 971,856,000 | 68,952,960 |
| Size | 926.8 MB | 65.8 MB |
| Events in quadrant A | 17,036,570 | 1,618 |
| Events in quadrant B | 3,706,165 | 665,729 |
| Events in quadrant C | 8,952,284 | 443,621 |
| Events in quadrant D | 5,765,569 | 512,808 |
| Mode M0 | |||
|---|---|---|---|
| Quadrant | BADHDUFLAG | Total packets | Discarded packets |
| A | 0 | 55254 | 1 |
| B | 0 | 15877 | 1 |
| C | 0 | 31187 | 1 |
| D | 0 | 21856 | 1 |
| Mode SS | |||
|---|---|---|---|
| Quadrant | BADHDUFLAG | Total packets | Discarded packets |
| A | 0 | 136 | 0 |
| B | 0 | 136 | 0 |
| C | 0 | 136 | 0 |
| D | 0 | 136 | 0 |
| Mode M9 | |||
|---|---|---|---|
| Quadrant | BADHDUFLAG | Total packets | Discarded packets |
| A | 0 | 10 | 0 |
| B | 0 | 10 | 0 |
| C | 0 | 10 | 0 |
| D | 0 | 10 | 0 |
| Quadrant | Total seconds | Saturated seconds | Saturation percentage |
|---|---|---|---|
| A | 6647 | 6635 | 99.819467% |
| B | 6647 | 99 | 1.489394% |
| C | 6647 | 1869 | 28.117948% |
| D | 6647 | 750 | 11.283286% |
Noise dominated data is calculated using 1-second bins in cleaned event files. If a bin has >2000 counts, and if more than 50% of those come from <1% of pixels, then it is considered to be noise-dominated and hence unusable.
| Quadrant | # 1 sec bins | Bins with >0 counts | Bins with >2000 counts | High rate bins dominated by noise | Noise dominated (total time) | Noise dominated (detector-on time) | Marked lightcurve |
|---|---|---|---|---|---|---|---|
| A | 7667 | 6648 | 6258 | 6258 | 81.62% | 94.13% | 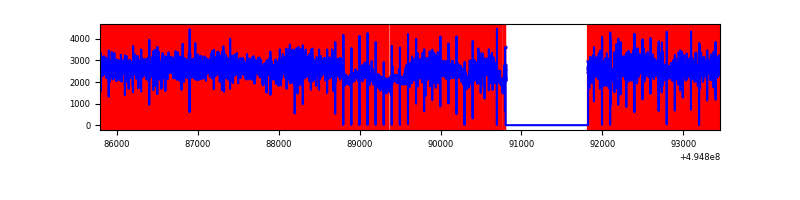 |
| B | 7667 | 6648 | 58 | 58 | 0.76% | 0.87% | 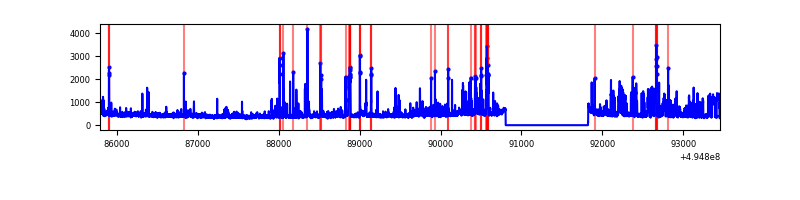 |
| C | 7667 | 6648 | 1795 | 1795 | 23.41% | 27.00% | 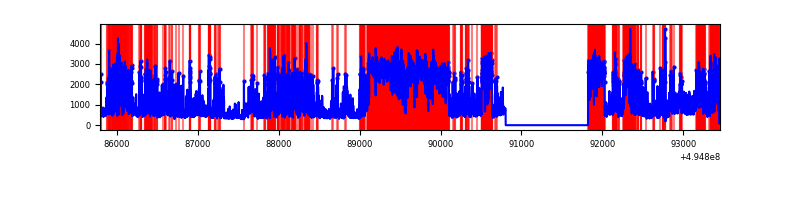 |
| D | 7667 | 6648 | 705 | 705 | 9.20% | 10.60% | 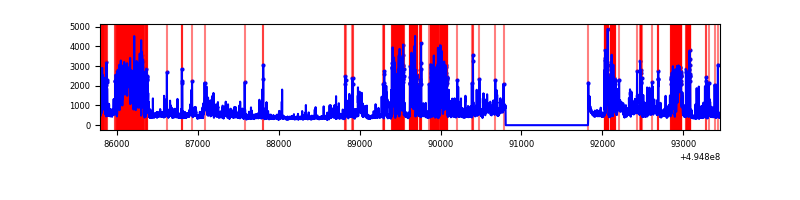 |
Top three noisy pixels from each quadrant. If the there are fewer than three noisy pixels in the level2.evt file, extra rows are filled as -1
| Pixel properties | Quadrant properties | ||||||
|---|---|---|---|---|---|---|---|
| Quadrant | DetID | PixID | Counts | Sigma | Mean | Median | Sigma |
| A | 3 | 63 | 15994351 | 436095.92 | 137 | 133 | 36.7 |
| A | 3 | 78 | 317291 | 8647.58 | 137 | 133 | 36.7 |
| A | 5 | 241 | 67047 | 1824.47 | 137 | 133 | 36.7 |
| B | 5 | 250 | 393305 | 2692.48 | 683 | 658 | 145.8 |
| B | 0 | 213 | 222771 | 1523.09 | 683 | 658 | 145.8 |
| B | 5 | 185 | 163696 | 1117.99 | 683 | 658 | 145.8 |
| C | 1 | 241 | 3223983 | 20063.35 | 576 | 570 | 160.7 |
| C | 15 | 224 | 2512256 | 15633.38 | 576 | 570 | 160.7 |
| C | 4 | 5 | 320991 | 1994.38 | 576 | 570 | 160.7 |
| D | 1 | 241 | 2556051 | 13804.94 | 638 | 609 | 185.1 |
| D | 13 | 153 | 153934 | 828.29 | 638 | 609 | 185.1 |
| D | 2 | 172 | 130575 | 702.1 | 638 | 609 | 185.1 |
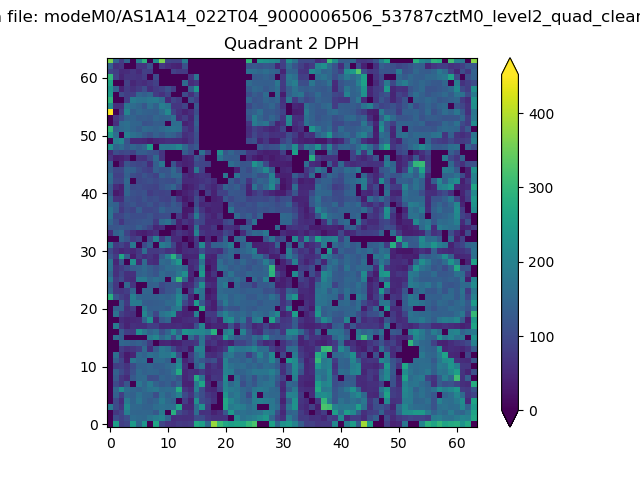
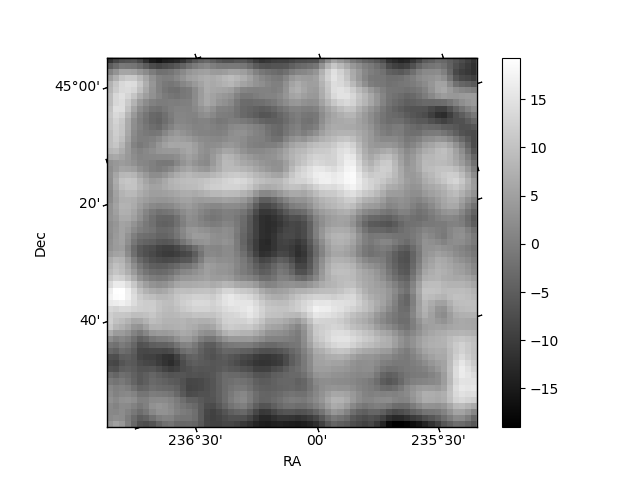
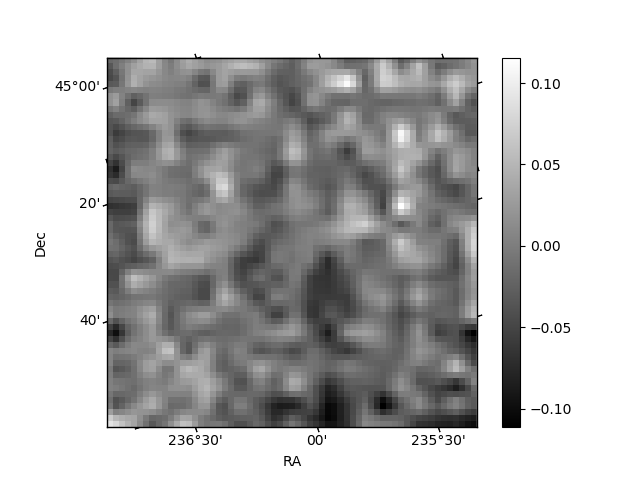
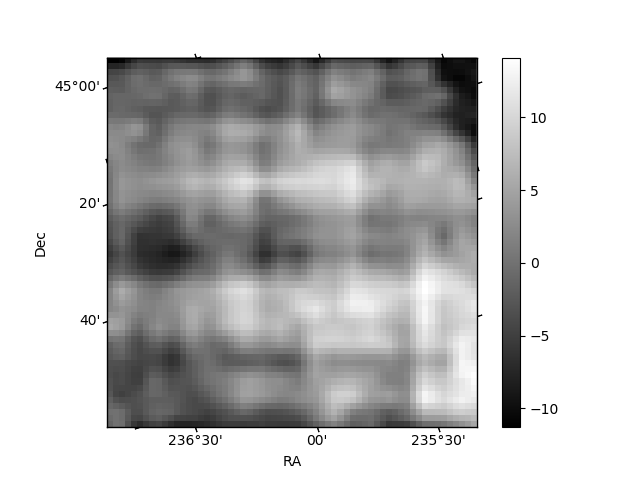
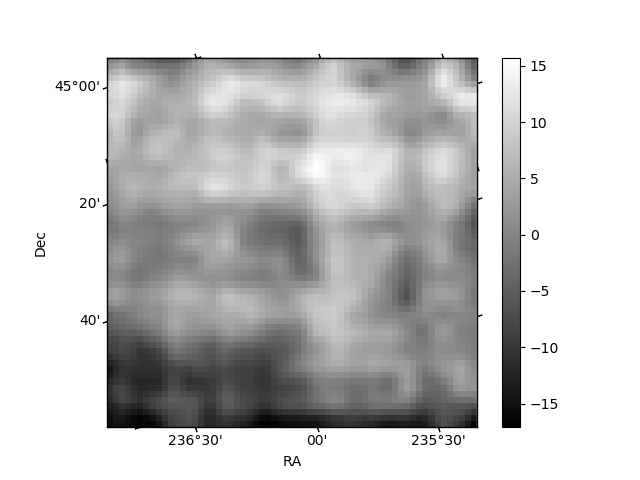
Histogram calculated using DETX and DETY for each event in the final _common_clean file
| Quadrant A | 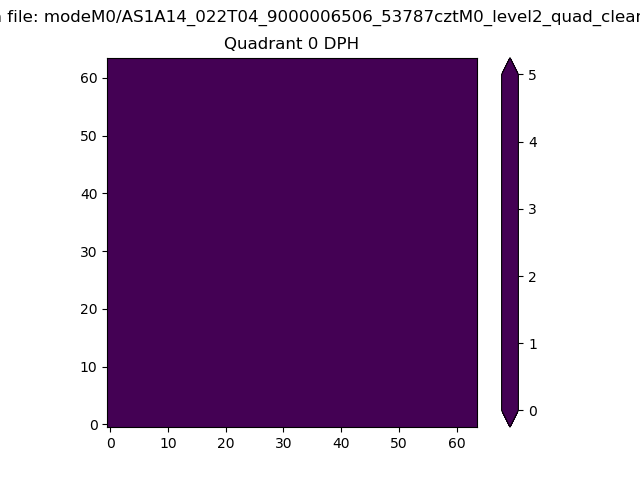 |
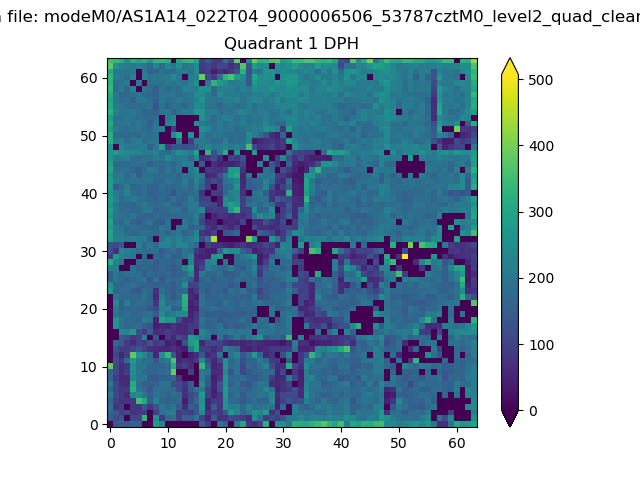 |
Quadrant B |
|---|---|---|---|
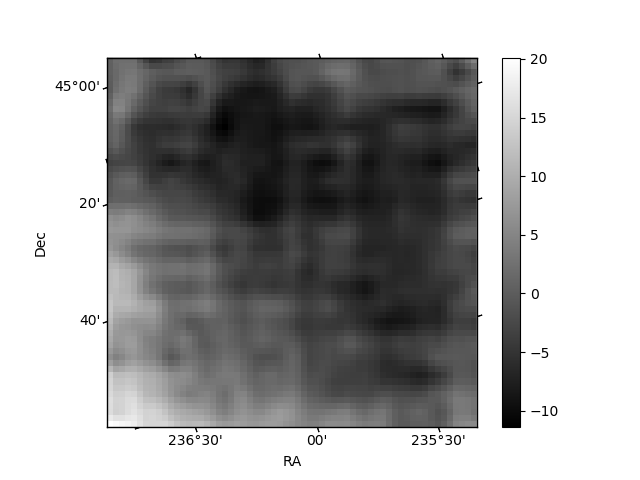
| Quadrant D | 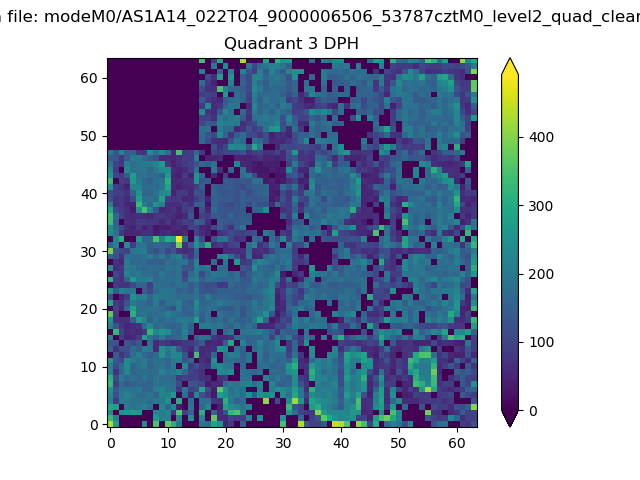 |
 |
Quadrant C |
| Plot type | Count rate plots | Images |
|---|---|---|
| Comparison with Poisson distribution Blue bars denote a histogram of data divided into 1 sec bins. Red curve is a Poisson curve with rate = median count rate of data. |
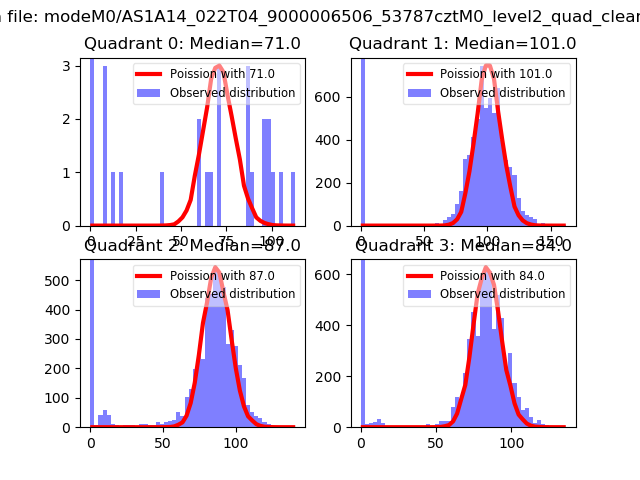 |
 |
| Quadrant-wise count rates Data is divided into 100 sec bins |
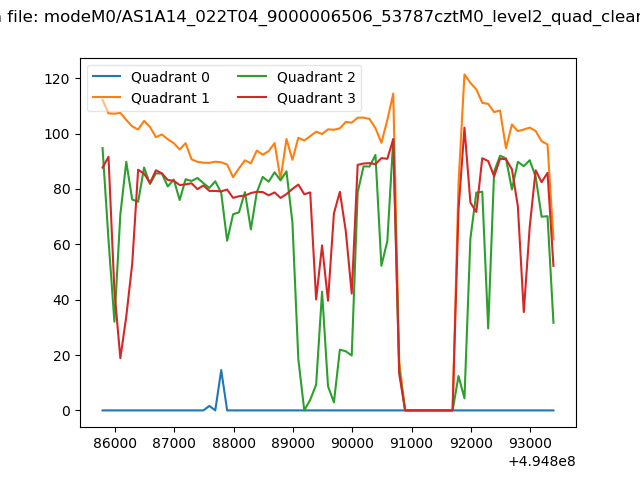 |
|
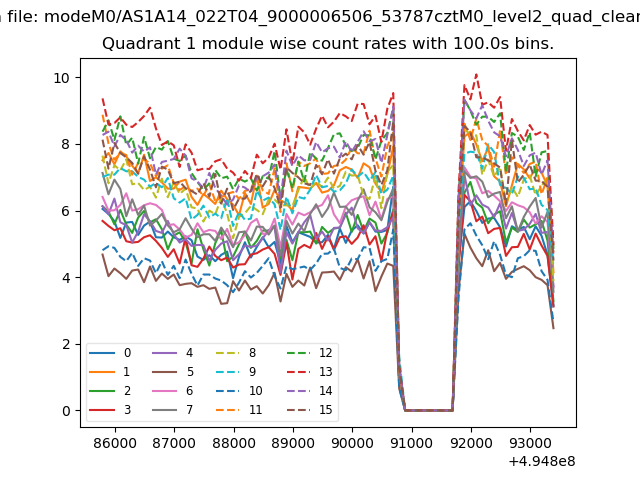
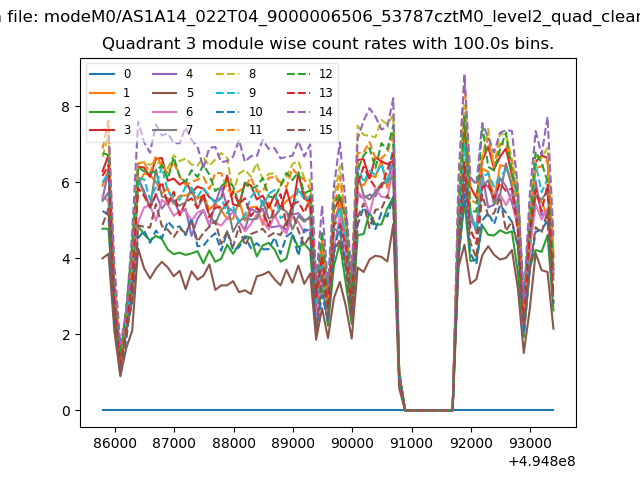
| Module-wise count rates for Quadrant A Data is divided into 100 sec bins |
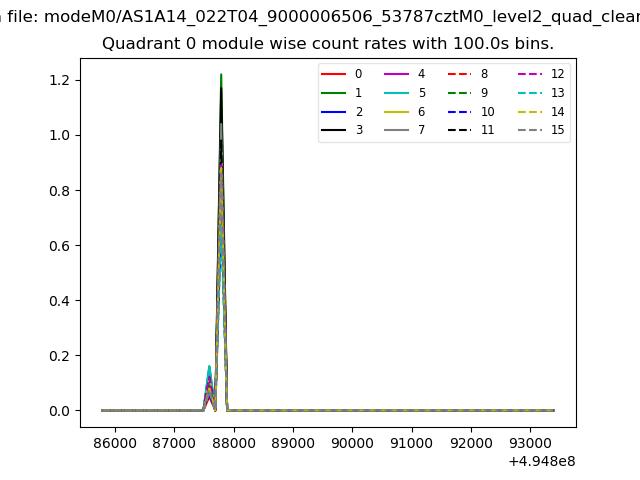 |
 |
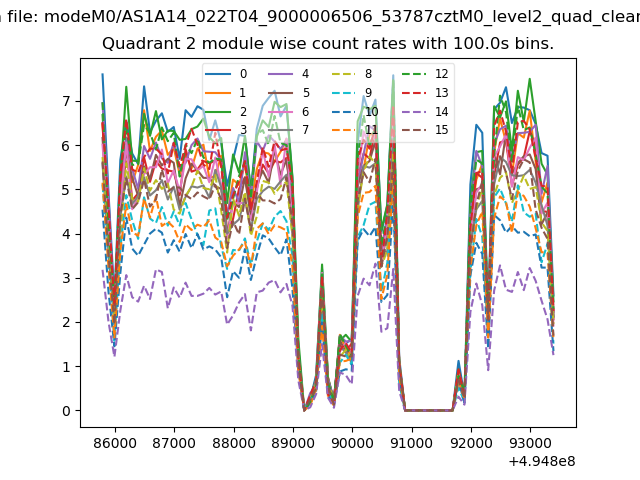
| Module-wise count rates for Quadrant B Data is divided into 100 sec bins |
 |
 |
| Module-wise count rates for Quadrant C Data is divided into 100 sec bins |
 |
 |
| Module-wise count rates for Quadrant D Data is divided into 100 sec bins |
 |
 |
| Parameter | Plot |
|---|---|
| CZT HV Monitor | 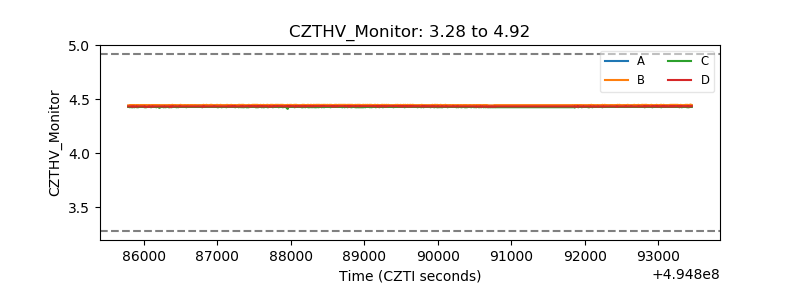 |
| D_VDD | 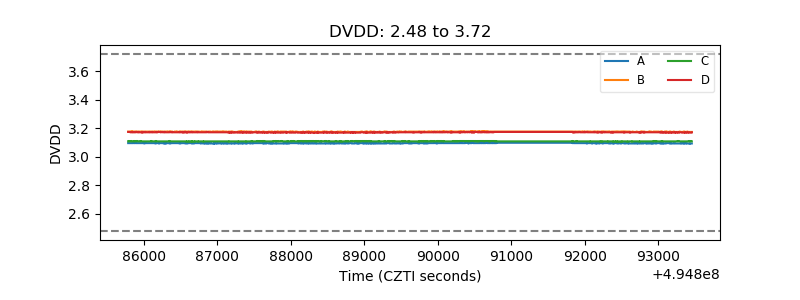 |
| Temperature 1 | 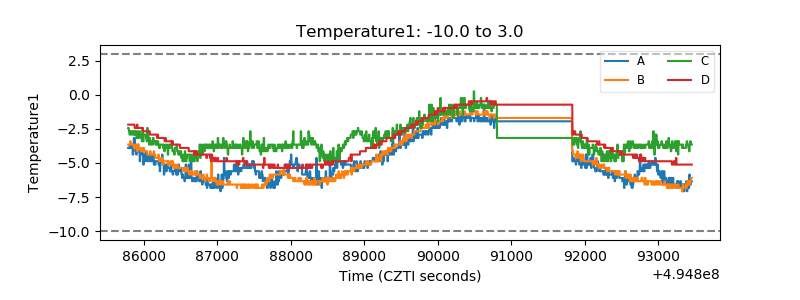 |
| Veto HV Monitor | 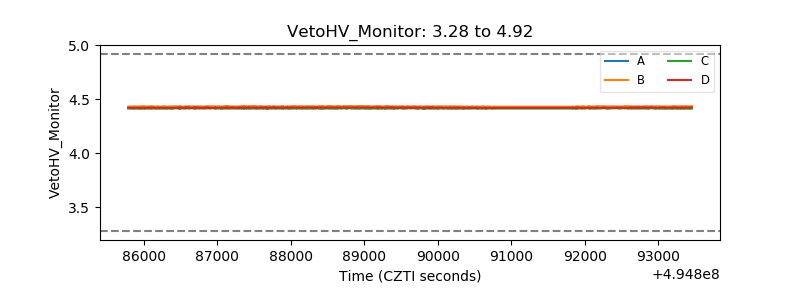 |
| Veto LLD | 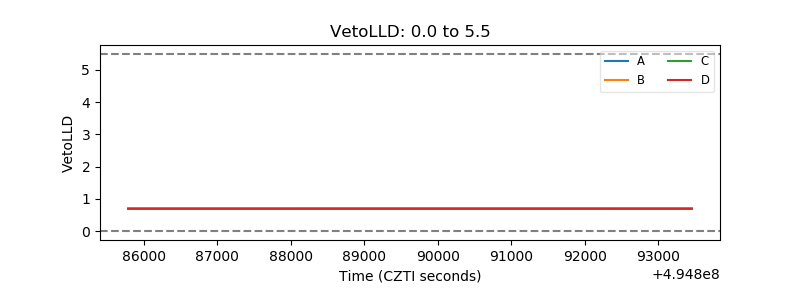 |
| Alpha Counter | 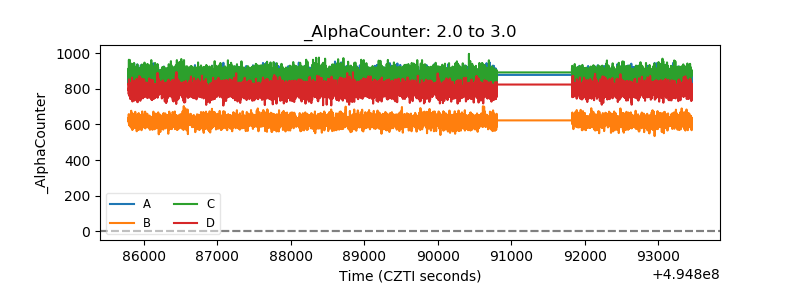 |
| _CPM_Rate | 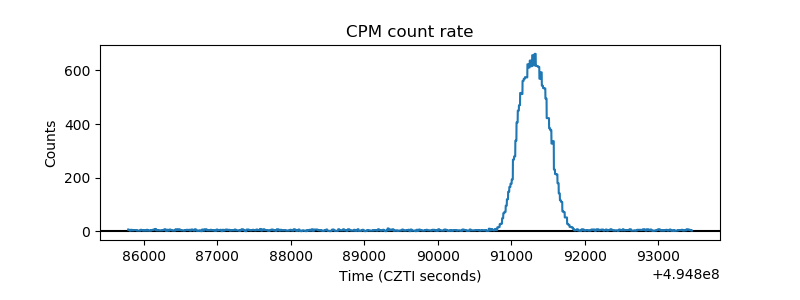 |
| CZT Counter | 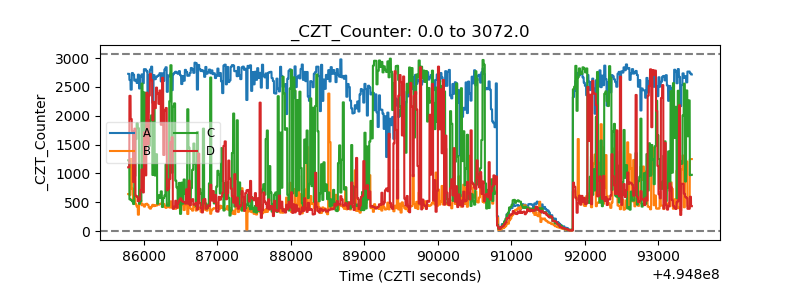 |
| +2.5 Volts monitor |  |
| +5 Volts monitor |  |
| _ROLL_ROT | 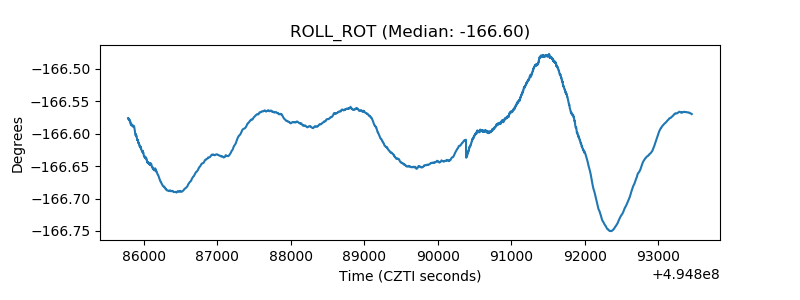 |
| _Roll_DEC | 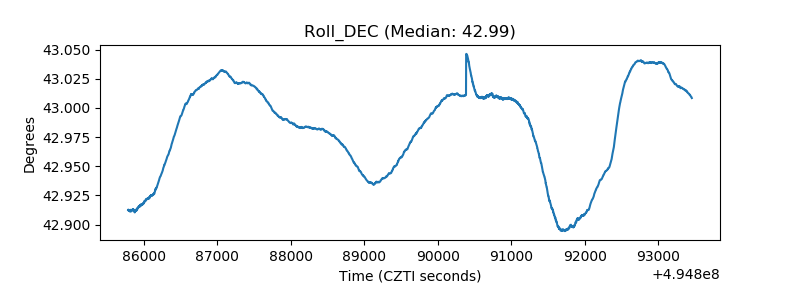 |
| _Roll_RA | 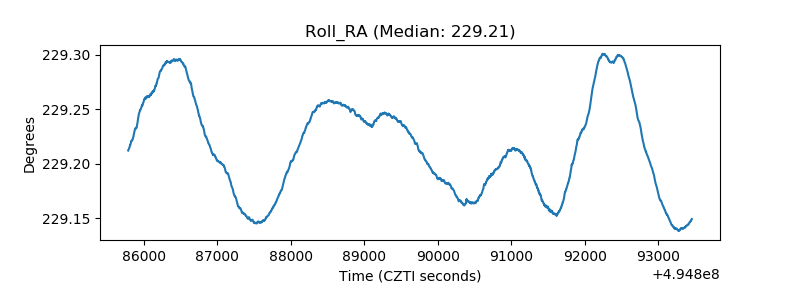 |
| Veto Counter | 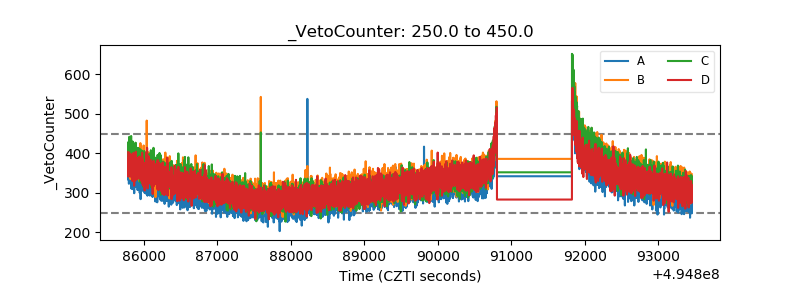 |