| Param | Original file | Final file |
|---|---|---|
| Filename | modeM0/AS1A14_022T04_9000006506_53788cztM0_level2.fits | modeM0/AS1A14_022T04_9000006506_53788cztM0_level2_quad_clean.evt |
| Size (bytes) | 892,192,320 | 78,275,520 |
| Size | 850.9 MB | 74.6 MB |
| Events in quadrant A | 16,474,687 | 95,647 |
| Events in quadrant B | 3,719,859 | 690,465 |
| Events in quadrant C | 6,824,229 | 557,573 |
| Events in quadrant D | 5,487,612 | 558,472 |
| Mode M0 | |||
|---|---|---|---|
| Quadrant | BADHDUFLAG | Total packets | Discarded packets |
| A | 0 | 53644 | 2 |
| B | 0 | 15917 | 2 |
| C | 0 | 24936 | 2 |
| D | 0 | 20950 | 9 |
| Mode SS | |||
|---|---|---|---|
| Quadrant | BADHDUFLAG | Total packets | Discarded packets |
| A | 0 | 136 | 0 |
| B | 0 | 136 | 0 |
| C | 0 | 136 | 0 |
| D | 0 | 136 | 0 |
| Mode M9 | |||
|---|---|---|---|
| Quadrant | BADHDUFLAG | Total packets | Discarded packets |
| A | 0 | 11 | 0 |
| B | 0 | 12 | 0 |
| C | 0 | 12 | 0 |
| D | 0 | 12 | 0 |
| Quadrant | Total seconds | Saturated seconds | Saturation percentage |
|---|---|---|---|
| A | 6711 | 5902 | 87.945165% |
| B | 6711 | 115 | 1.713605% |
| C | 6711 | 829 | 12.352854% |
| D | 6710 | 508 | 7.570790% |
Noise dominated data is calculated using 1-second bins in cleaned event files. If a bin has >2000 counts, and if more than 50% of those come from <1% of pixels, then it is considered to be noise-dominated and hence unusable.
| Quadrant | # 1 sec bins | Bins with >0 counts | Bins with >2000 counts | High rate bins dominated by noise | Noise dominated (total time) | Noise dominated (detector-on time) | Marked lightcurve |
|---|---|---|---|---|---|---|---|
| A | 7821 | 6712 | 5821 | 5821 | 74.43% | 86.73% | 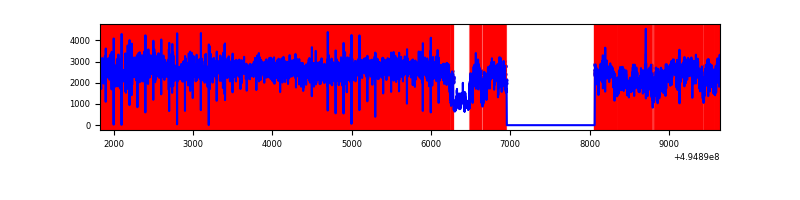 |
| B | 7821 | 6712 | 43 | 43 | 0.55% | 0.64% | 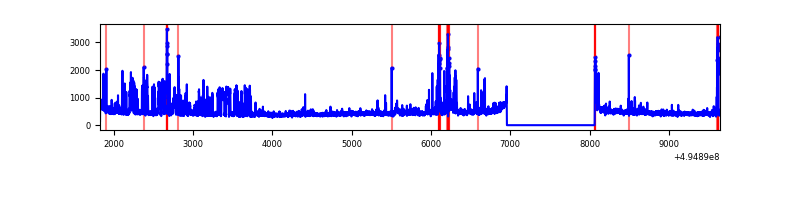 |
| C | 7821 | 6712 | 808 | 808 | 10.33% | 12.04% | 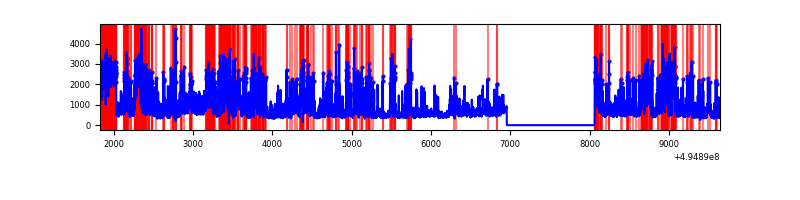 |
| D | 7820 | 6711 | 520 | 520 | 6.65% | 7.75% | 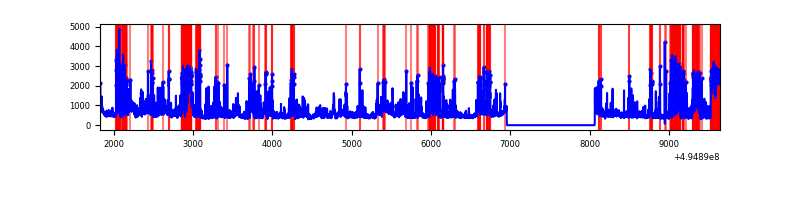 |
Top three noisy pixels from each quadrant. If the there are fewer than three noisy pixels in the level2.evt file, extra rows are filled as -1
| Pixel properties | Quadrant properties | ||||||
|---|---|---|---|---|---|---|---|
| Quadrant | DetID | PixID | Counts | Sigma | Mean | Median | Sigma |
| A | 3 | 63 | 14453122 | 189005.5 | 301 | 293 | 76.5 |
| A | 3 | 78 | 356447 | 4657.57 | 301 | 293 | 76.5 |
| A | 8 | 6 | 151473 | 1977.04 | 301 | 293 | 76.5 |
| B | 5 | 250 | 498366 | 3285.47 | 706 | 680 | 151.5 |
| B | 5 | 185 | 190100 | 1250.45 | 706 | 680 | 151.5 |
| B | 10 | 245 | 38694 | 250.95 | 706 | 680 | 151.5 |
| C | 15 | 224 | 2369820 | 13084.35 | 655 | 650 | 181.1 |
| C | 1 | 241 | 816996 | 4508.48 | 655 | 650 | 181.1 |
| C | 3 | 242 | 555420 | 3063.86 | 655 | 650 | 181.1 |
| D | 1 | 241 | 1382729 | 6966.32 | 678 | 645 | 198.4 |
| D | 7 | 70 | 637679 | 3210.94 | 678 | 645 | 198.4 |
| D | 13 | 153 | 185174 | 930.11 | 678 | 645 | 198.4 |
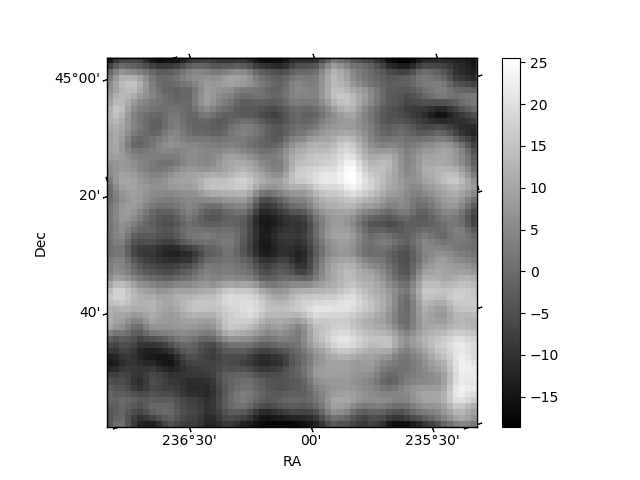
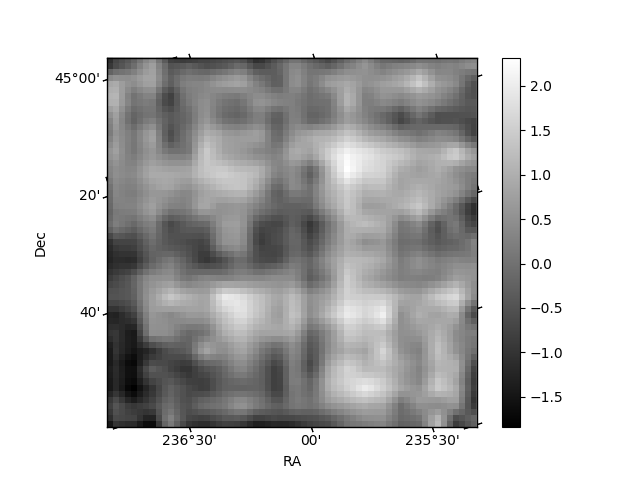
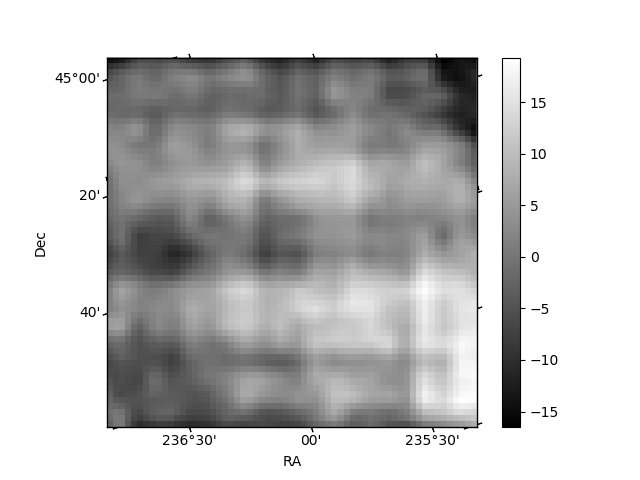
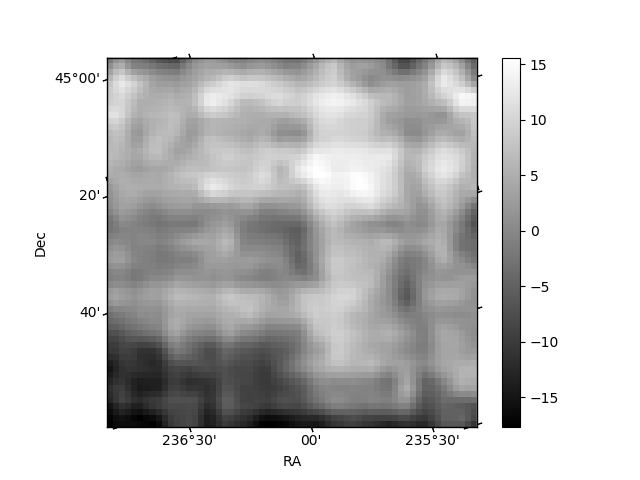
Histogram calculated using DETX and DETY for each event in the final _common_clean file
| Quadrant A | 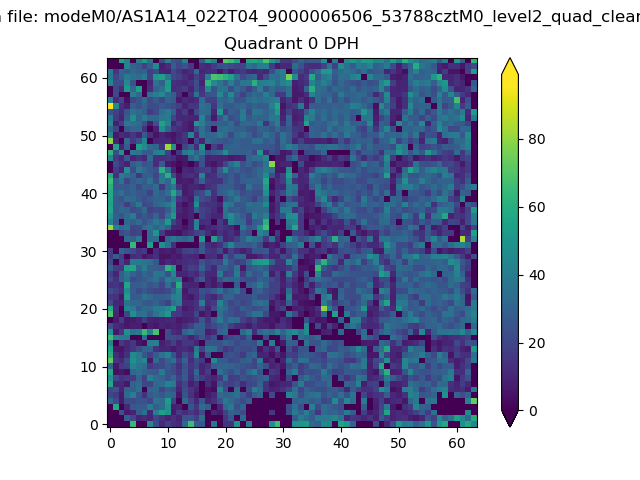 |
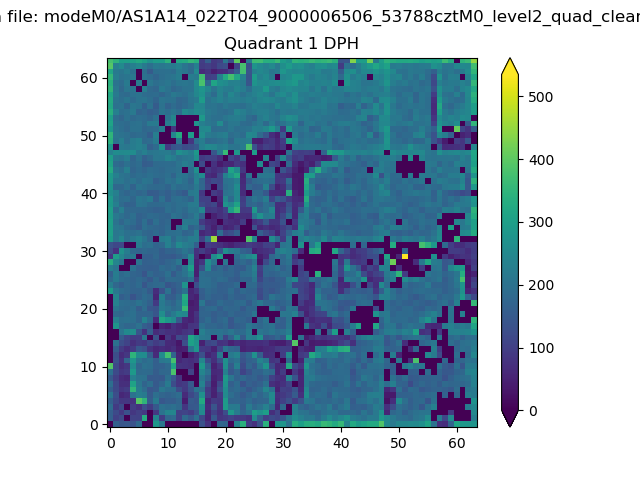 |
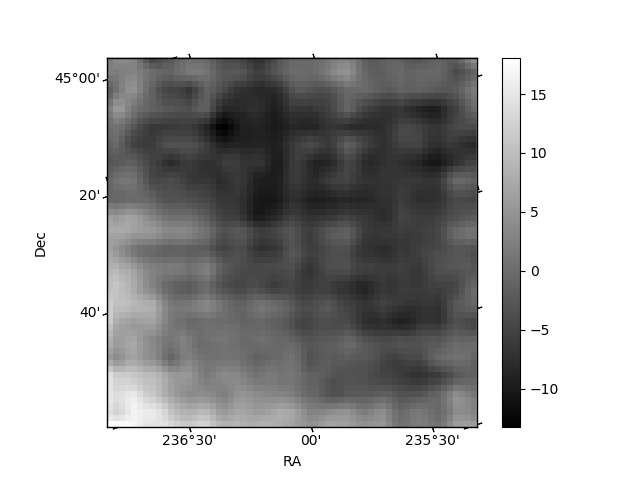
Quadrant B |
|---|---|---|---|
| Quadrant D | 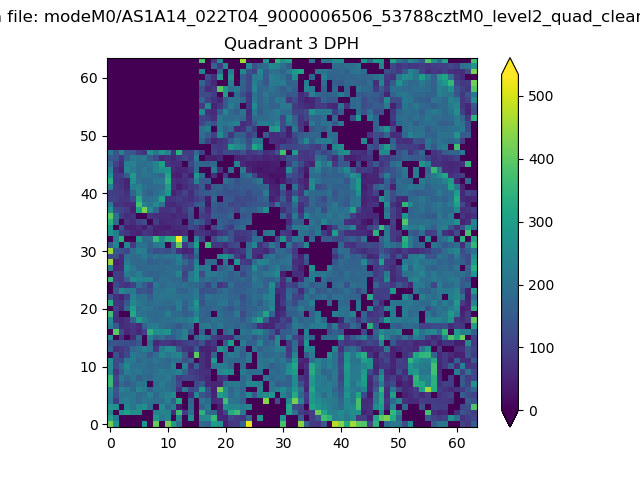 |
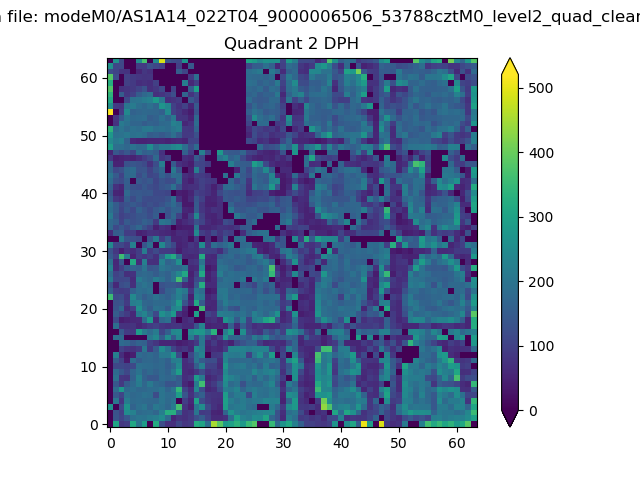 |
Quadrant C |
| Plot type | Count rate plots | Images |
|---|---|---|
| Comparison with Poisson distribution Blue bars denote a histogram of data divided into 1 sec bins. Red curve is a Poisson curve with rate = median count rate of data. |
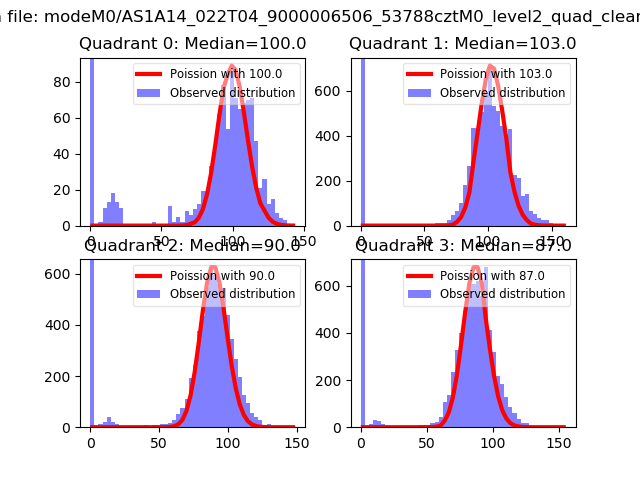 |
 |
| Quadrant-wise count rates Data is divided into 100 sec bins |
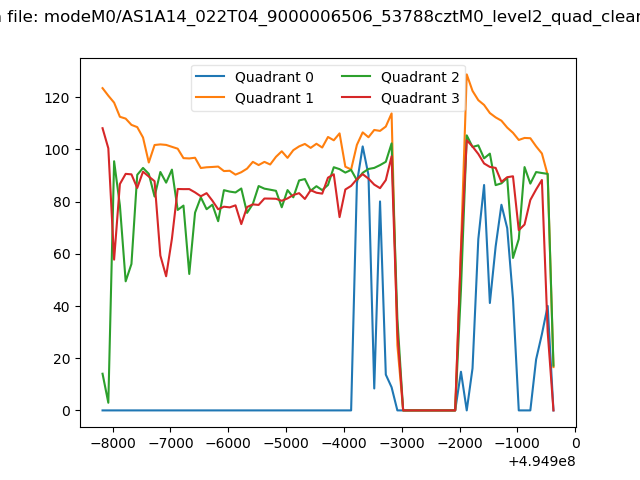 |
|
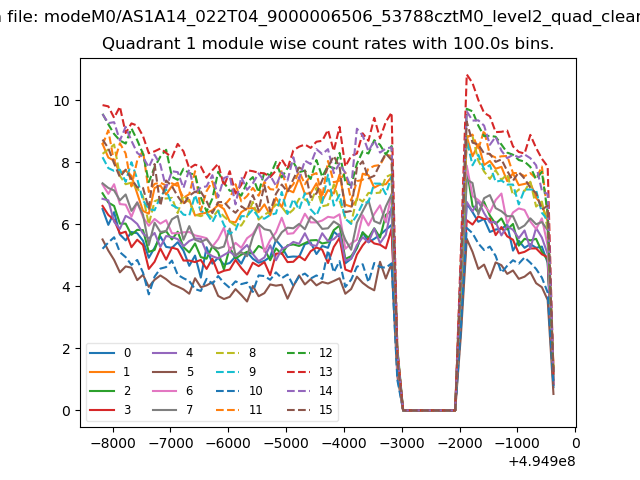
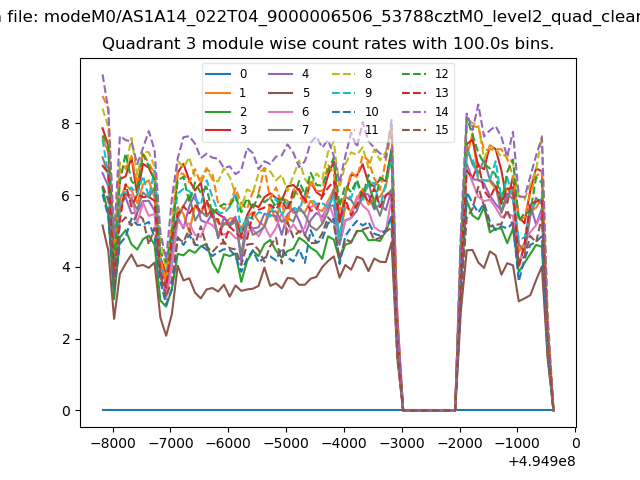
| Module-wise count rates for Quadrant A Data is divided into 100 sec bins |
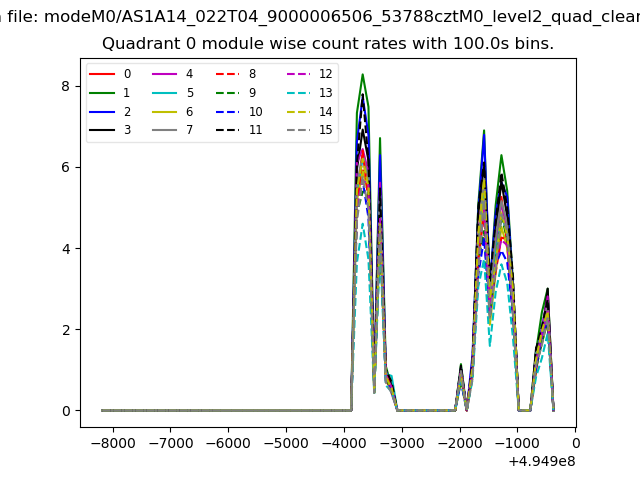 |
 |
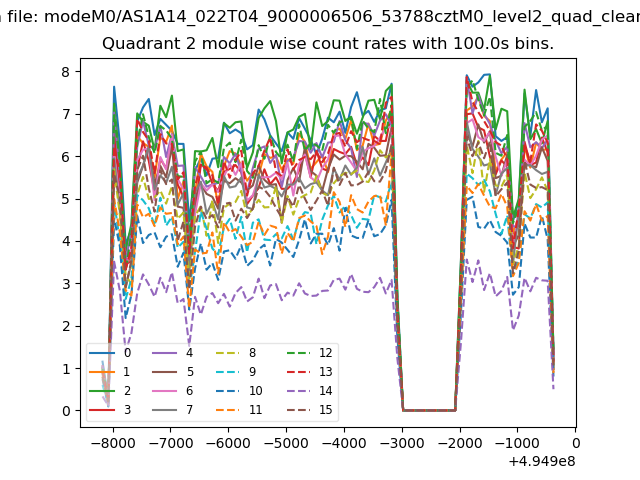
| Module-wise count rates for Quadrant B Data is divided into 100 sec bins |
 |
 |
| Module-wise count rates for Quadrant C Data is divided into 100 sec bins |
 |
 |
| Module-wise count rates for Quadrant D Data is divided into 100 sec bins |
 |
 |
| Parameter | Plot |
|---|---|
| CZT HV Monitor |  |
| D_VDD | 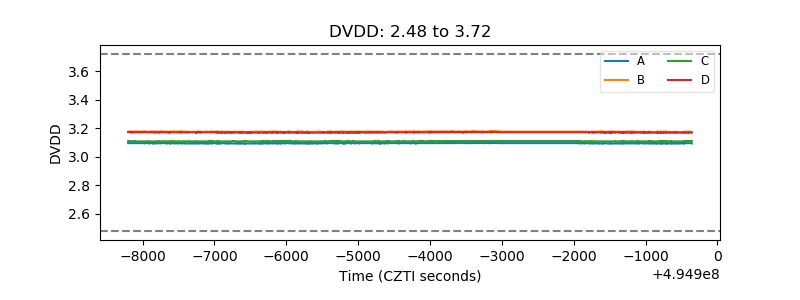 |
| Temperature 1 | 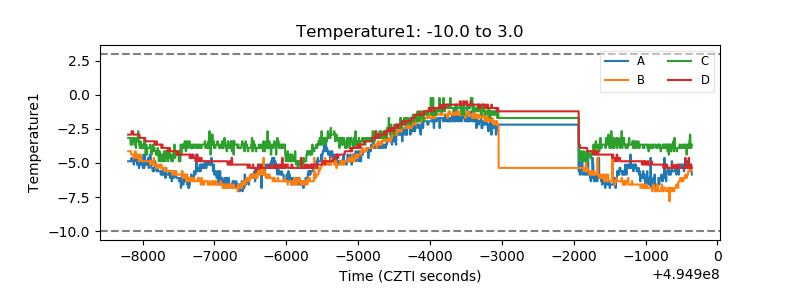 |
| Veto HV Monitor | 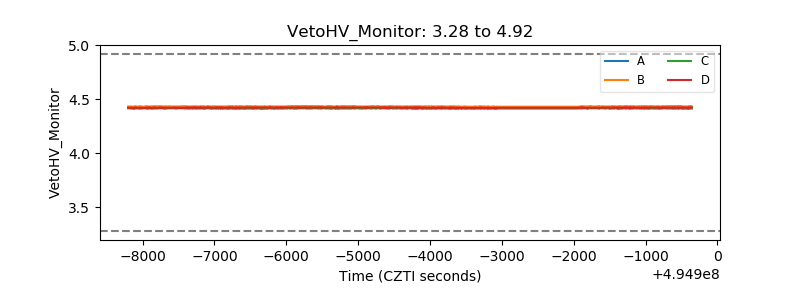 |
| Veto LLD | 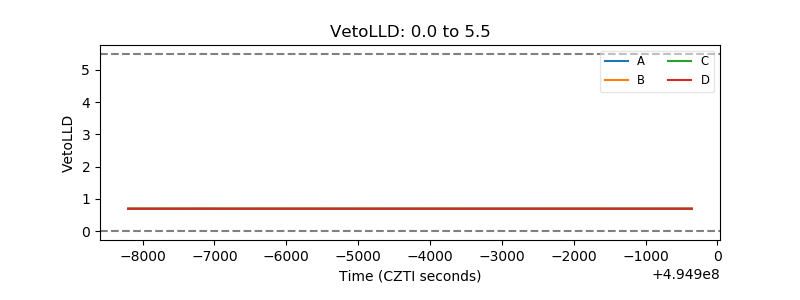 |
| Alpha Counter | 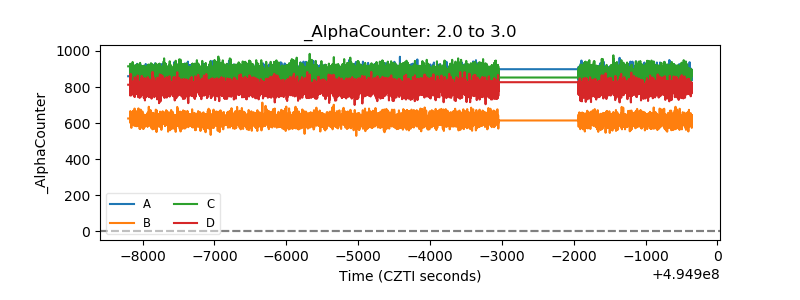 |
| _CPM_Rate | 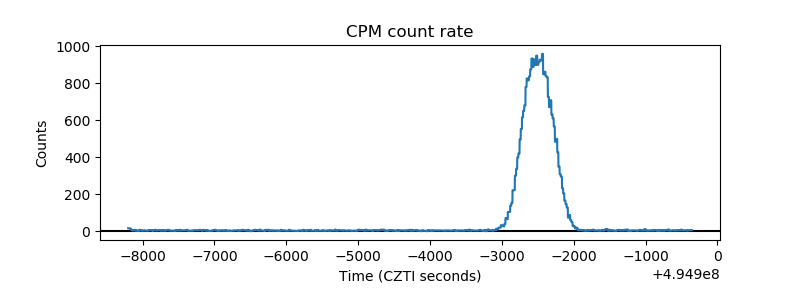 |
| CZT Counter | 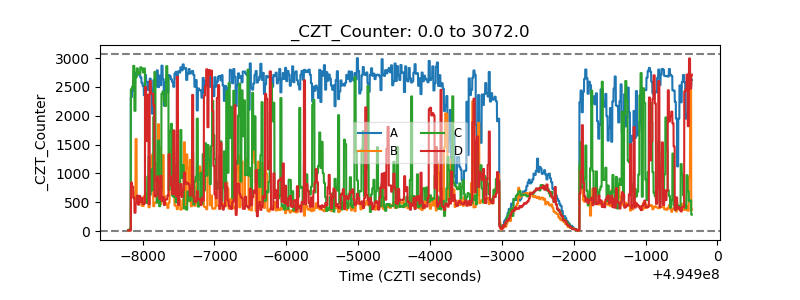 |
| +2.5 Volts monitor |  |
| +5 Volts monitor |  |
| _ROLL_ROT | 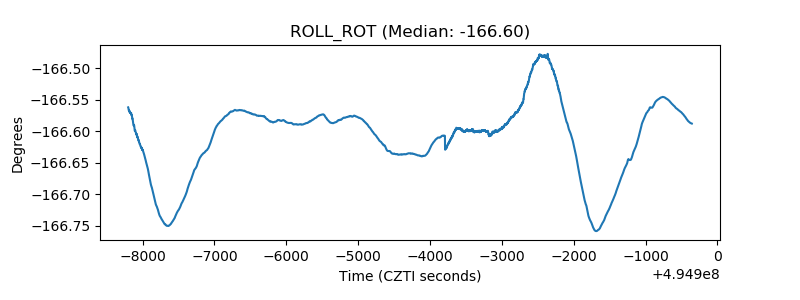 |
| _Roll_DEC | 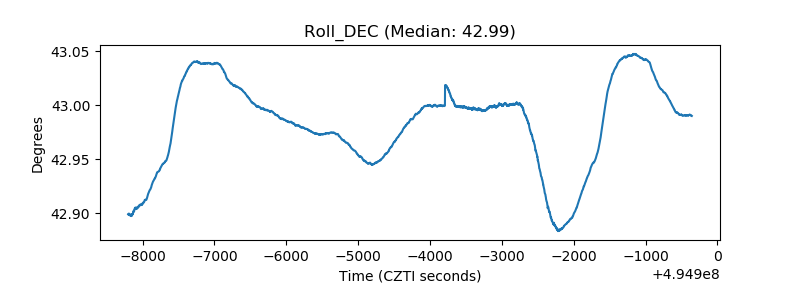 |
| _Roll_RA | 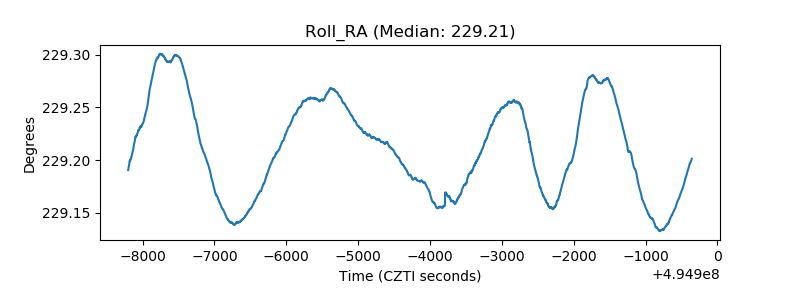 |
| Veto Counter | 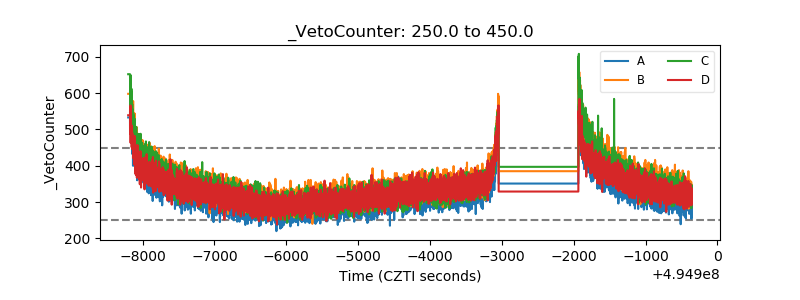 |