| Param | Original file | Final file |
|---|---|---|
| Filename | modeM0/AS1A14_022T04_9000006506_53789cztM0_level2.fits | modeM0/AS1A14_022T04_9000006506_53789cztM0_level2_quad_clean.evt |
| Size (bytes) | 892,889,280 | 61,047,360 |
| Size | 851.5 MB | 58.2 MB |
| Events in quadrant A | 13,338,494 | 136,777 |
| Events in quadrant B | 3,276,813 | 586,354 |
| Events in quadrant C | 6,066,350 | 439,532 |
| Events in quadrant D | 9,919,384 | 278,572 |
| Mode M0 | |||
|---|---|---|---|
| Quadrant | BADHDUFLAG | Total packets | Discarded packets |
| A | 0 | 43617 | 3 |
| B | 0 | 14041 | 1 |
| C | 0 | 22127 | 1 |
| D | 0 | 33503 | 1 |
| Mode SS | |||
|---|---|---|---|
| Quadrant | BADHDUFLAG | Total packets | Discarded packets |
| A | 0 | 118 | 0 |
| B | 0 | 118 | 0 |
| C | 0 | 118 | 0 |
| D | 0 | 118 | 0 |
| Mode M9 | |||
|---|---|---|---|
| Quadrant | BADHDUFLAG | Total packets | Discarded packets |
| A | 0 | 11 | 0 |
| B | 0 | 11 | 0 |
| C | 0 | 11 | 0 |
| D | 0 | 11 | 0 |
| Quadrant | Total seconds | Saturated seconds | Saturation percentage |
|---|---|---|---|
| A | 5824 | 4548 | 78.090659% |
| B | 5825 | 300 | 5.150215% |
| C | 5825 | 1133 | 19.450644% |
| D | 5825 | 2969 | 50.969957% |
Noise dominated data is calculated using 1-second bins in cleaned event files. If a bin has >2000 counts, and if more than 50% of those come from <1% of pixels, then it is considered to be noise-dominated and hence unusable.
| Quadrant | # 1 sec bins | Bins with >0 counts | Bins with >2000 counts | High rate bins dominated by noise | Noise dominated (total time) | Noise dominated (detector-on time) | Marked lightcurve |
|---|---|---|---|---|---|---|---|
| A | 6954 | 5825 | 4521 | 4521 | 65.01% | 77.61% | 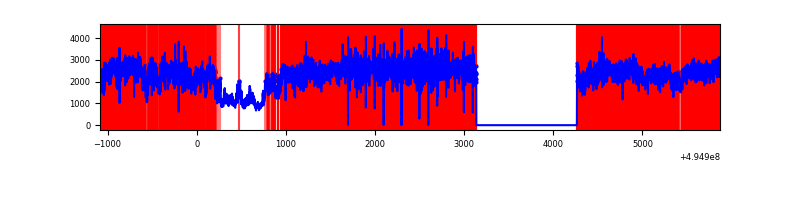 |
| B | 6955 | 5826 | 150 | 150 | 2.16% | 2.57% | 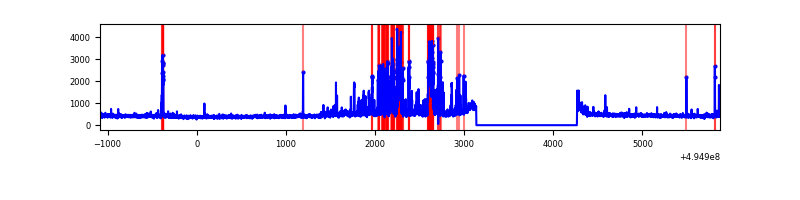 |
| C | 6955 | 5826 | 1044 | 1044 | 15.01% | 17.92% | 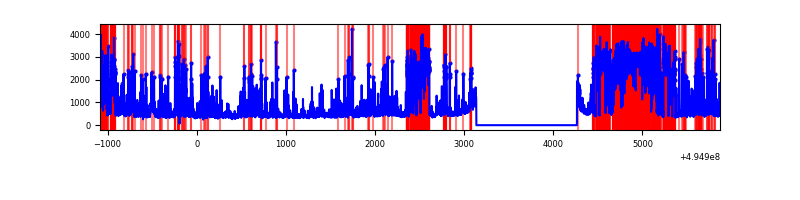 |
| D | 6955 | 5826 | 2933 | 2933 | 42.17% | 50.34% | 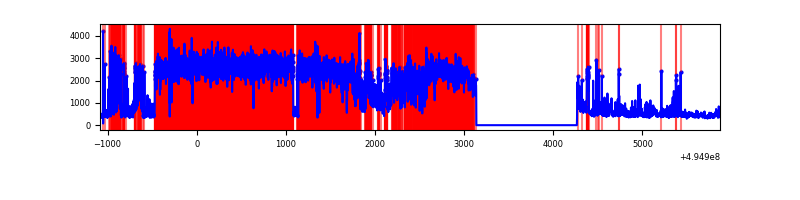 |
Top three noisy pixels from each quadrant. If the there are fewer than three noisy pixels in the level2.evt file, extra rows are filled as -1
| Pixel properties | Quadrant properties | ||||||
|---|---|---|---|---|---|---|---|
| Quadrant | DetID | PixID | Counts | Sigma | Mean | Median | Sigma |
| A | 3 | 63 | 11115593 | 124696.56 | 357 | 347 | 89.1 |
| A | 8 | 249 | 359754 | 4032.01 | 357 | 347 | 89.1 |
| A | 3 | 78 | 237547 | 2661.03 | 357 | 347 | 89.1 |
| B | 5 | 185 | 569019 | 4361.87 | 609 | 587 | 130.3 |
| B | 8 | 234 | 105713 | 806.69 | 609 | 587 | 130.3 |
| B | 10 | 245 | 54103 | 410.66 | 609 | 587 | 130.3 |
| C | 15 | 224 | 1847519 | 12209.94 | 542 | 537 | 151.3 |
| C | 1 | 241 | 1809199 | 11956.61 | 542 | 537 | 151.3 |
| C | 12 | 2 | 103030 | 677.56 | 542 | 537 | 151.3 |
| D | 7 | 70 | 5983027 | 42446.17 | 486 | 465 | 140.9 |
| D | 2 | 153 | 1350907 | 9581.36 | 486 | 465 | 140.9 |
| D | 1 | 241 | 324743 | 2300.75 | 486 | 465 | 140.9 |
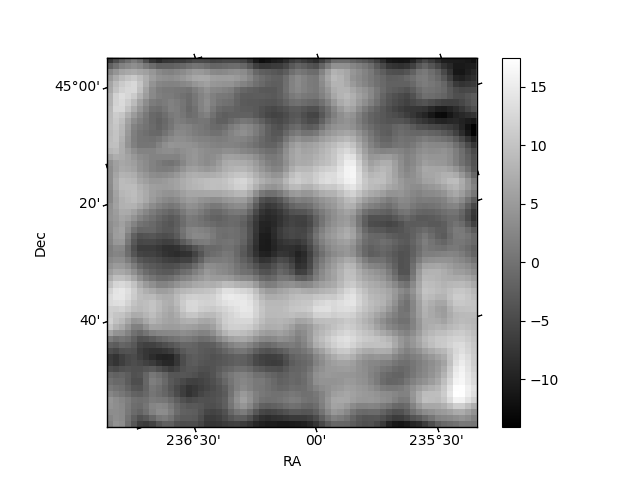
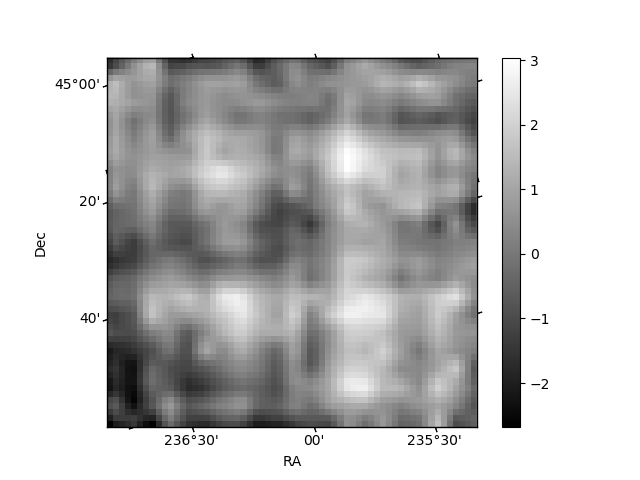
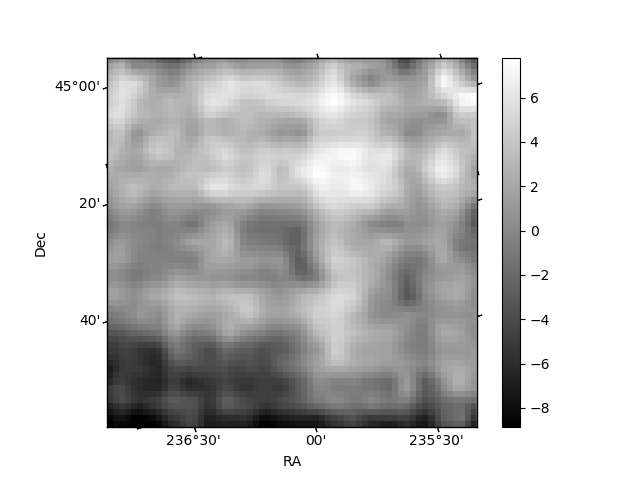
Histogram calculated using DETX and DETY for each event in the final _common_clean file
| Quadrant A | 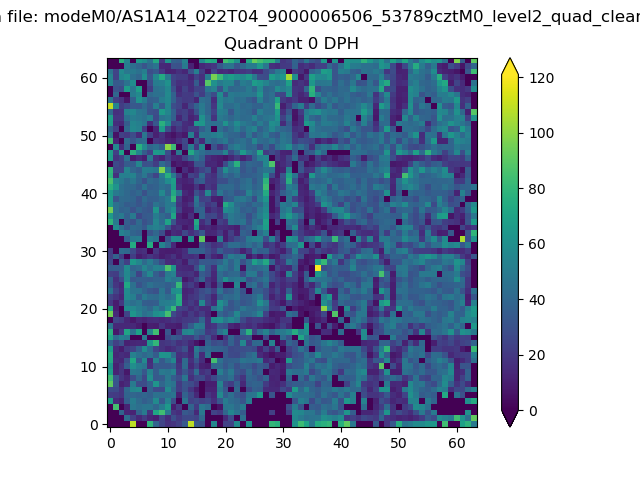 |
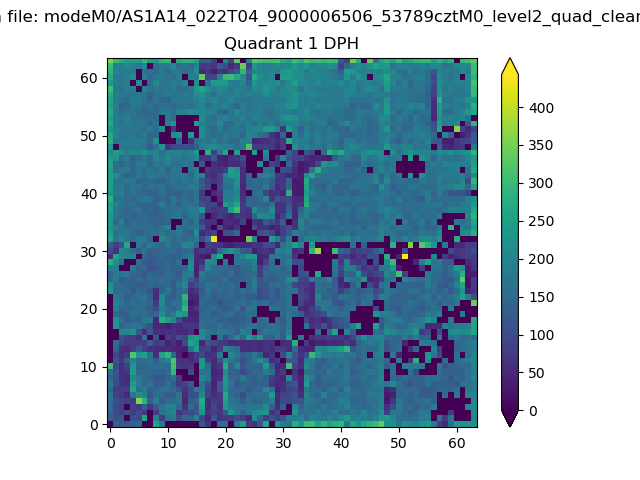 |
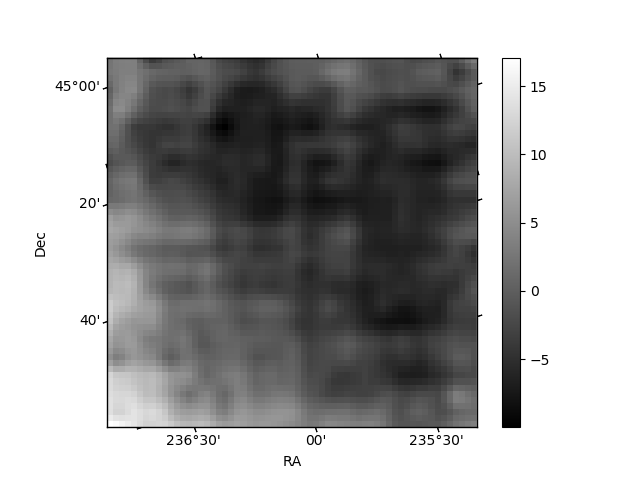
Quadrant B |
|---|---|---|---|
| Quadrant D | 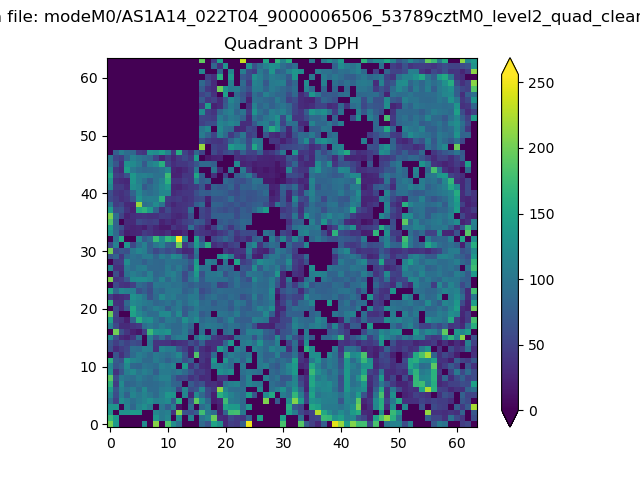 |
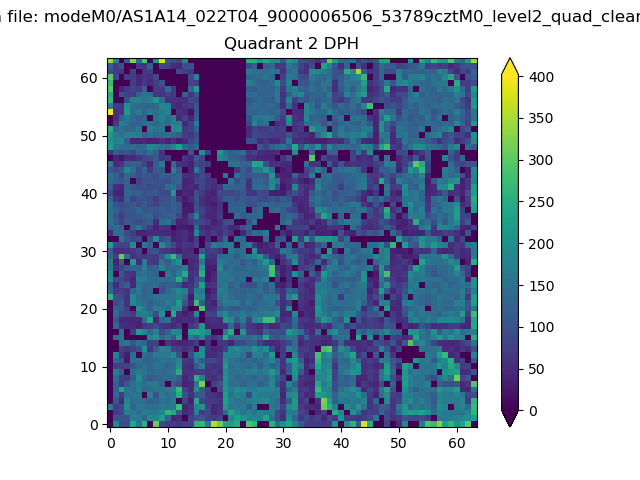 |
Quadrant C |
| Plot type | Count rate plots | Images |
|---|---|---|
| Comparison with Poisson distribution Blue bars denote a histogram of data divided into 1 sec bins. Red curve is a Poisson curve with rate = median count rate of data. |
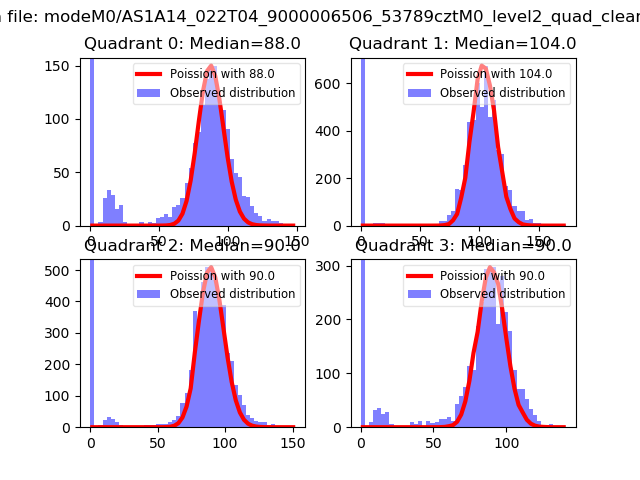 |
 |
| Quadrant-wise count rates Data is divided into 100 sec bins |
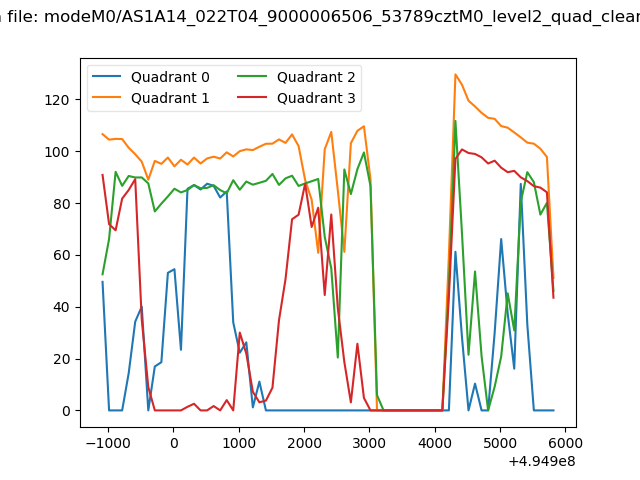 |
|
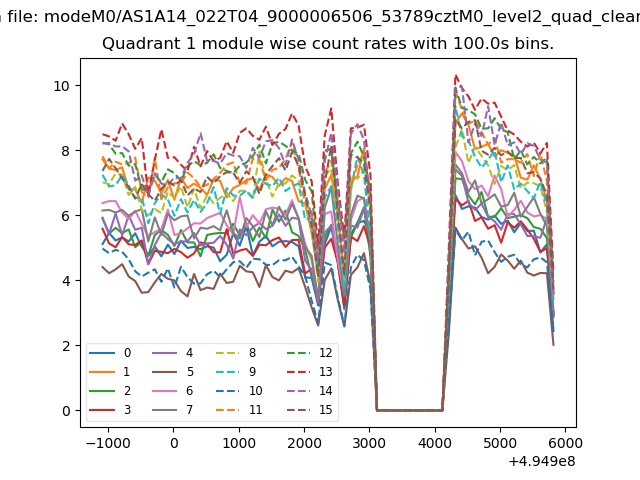
| Module-wise count rates for Quadrant A Data is divided into 100 sec bins |
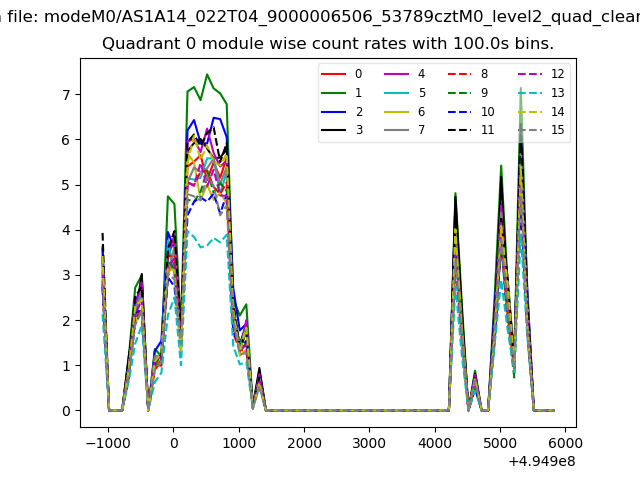 |
 |
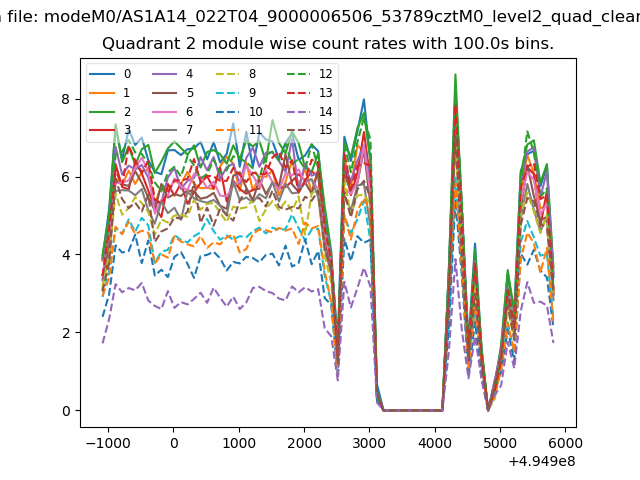
| Module-wise count rates for Quadrant B Data is divided into 100 sec bins |
 |
 |
| Module-wise count rates for Quadrant C Data is divided into 100 sec bins |
 |
 |
| Module-wise count rates for Quadrant D Data is divided into 100 sec bins |
 |
 |
| Parameter | Plot |
|---|---|
| CZT HV Monitor | 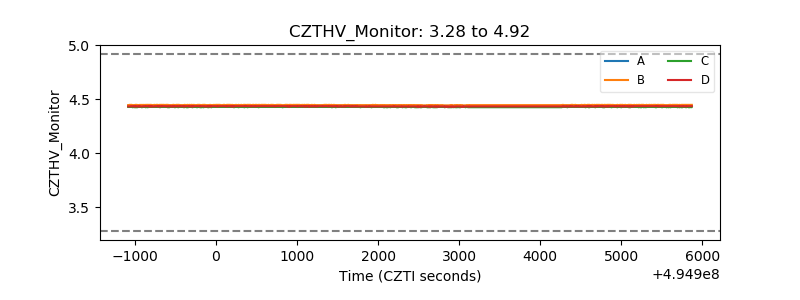 |
| D_VDD | 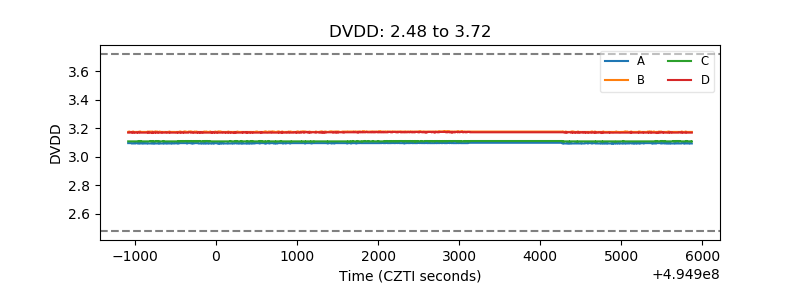 |
| Temperature 1 | 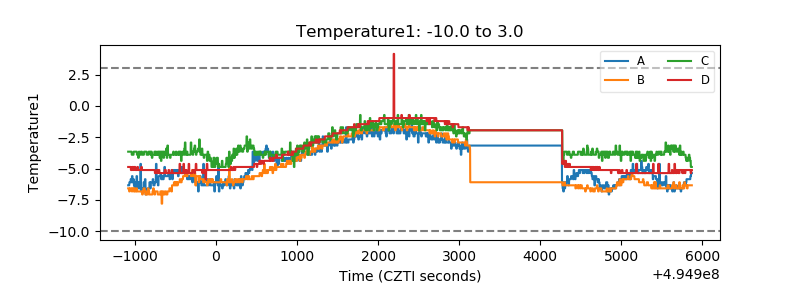 |
| Veto HV Monitor | 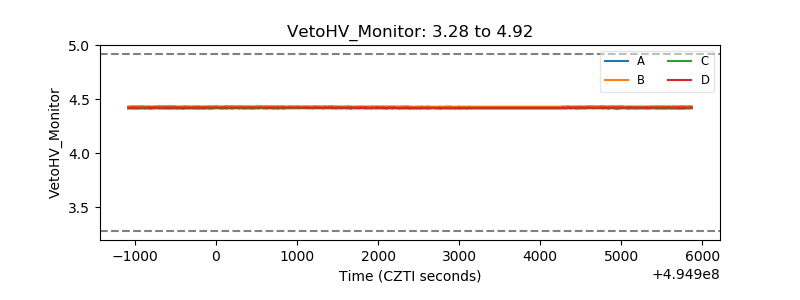 |
| Veto LLD | 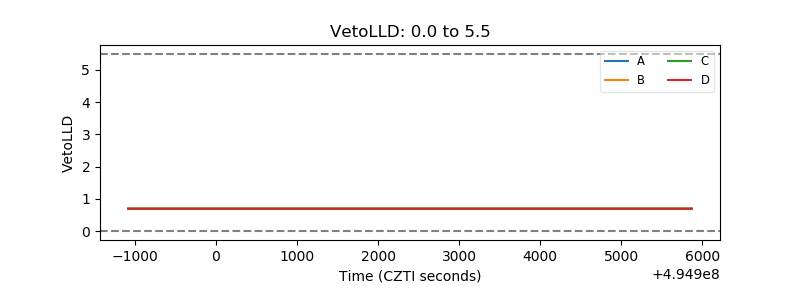 |
| Alpha Counter | 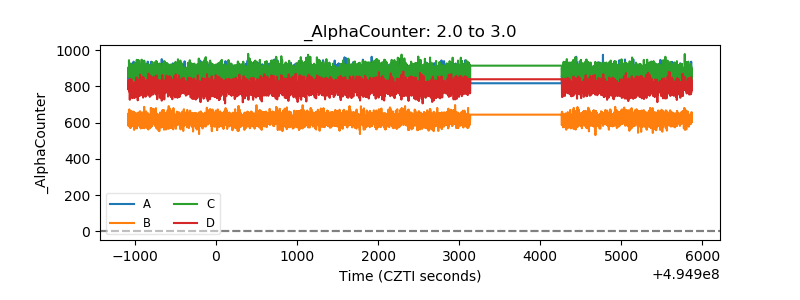 |
| _CPM_Rate | 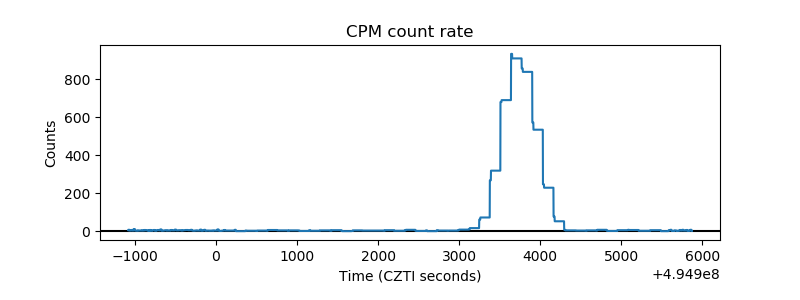 |
| CZT Counter | 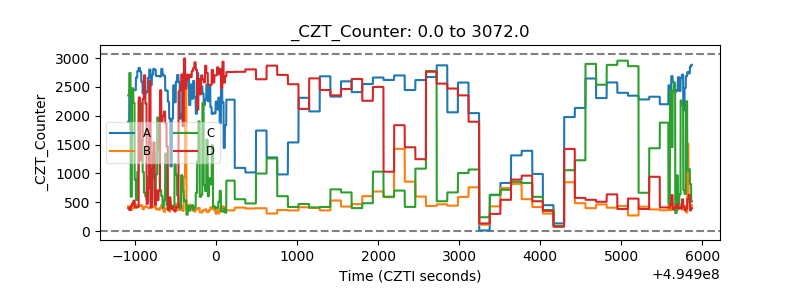 |
| +2.5 Volts monitor |  |
| +5 Volts monitor | 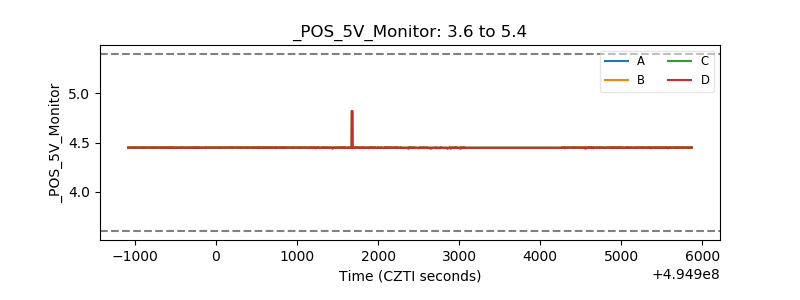 |
| _ROLL_ROT | 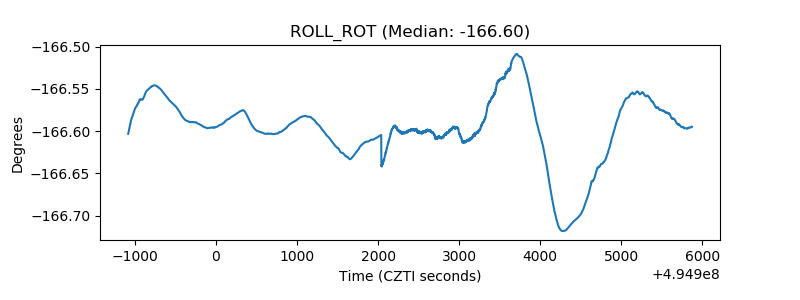 |
| _Roll_DEC | 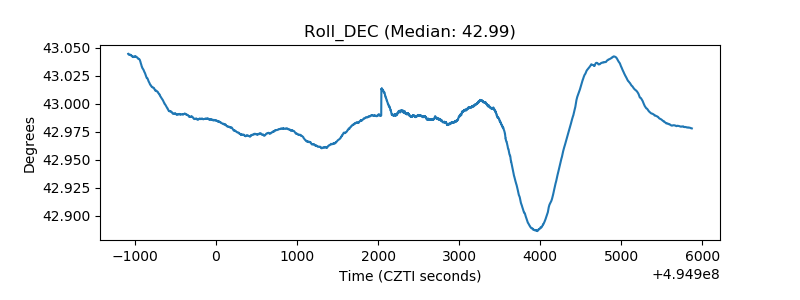 |
| _Roll_RA | 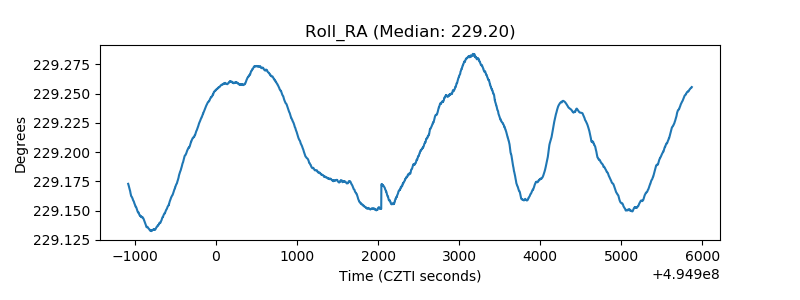 |
| Veto Counter | 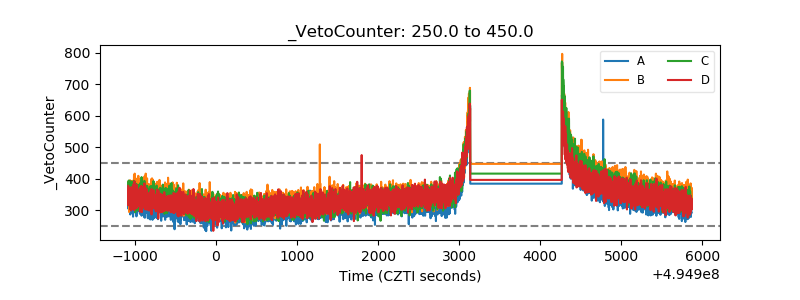 |