| Param | Original file | Final file |
|---|---|---|
| Filename | modeM0/AS1A14_022T04_9000006506_53790cztM0_level2.fits | modeM0/AS1A14_022T04_9000006506_53790cztM0_level2_quad_clean.evt |
| Size (bytes) | 779,564,160 | 67,933,440 |
| Size | 743.5 MB | 64.8 MB |
| Events in quadrant A | 12,972,144 | 144,511 |
| Events in quadrant B | 3,515,194 | 600,635 |
| Events in quadrant C | 5,825,160 | 479,536 |
| Events in quadrant D | 6,081,120 | 414,728 |
| Mode M0 | |||
|---|---|---|---|
| Quadrant | BADHDUFLAG | Total packets | Discarded packets |
| A | 0 | 42690 | 3 |
| B | 0 | 14812 | 1 |
| C | 0 | 21431 | 1 |
| D | 0 | 22326 | 1 |
| Mode SS | |||
|---|---|---|---|
| Quadrant | BADHDUFLAG | Total packets | Discarded packets |
| A | 0 | 122 | 0 |
| B | 0 | 122 | 0 |
| C | 0 | 122 | 0 |
| D | 0 | 122 | 0 |
| Mode M9 | |||
|---|---|---|---|
| Quadrant | BADHDUFLAG | Total packets | Discarded packets |
| A | 0 | 11 | 0 |
| B | 0 | 11 | 0 |
| C | 0 | 11 | 0 |
| D | 0 | 11 | 0 |
| Quadrant | Total seconds | Saturated seconds | Saturation percentage |
|---|---|---|---|
| A | 5973 | 4655 | 77.934036% |
| B | 5974 | 347 | 5.808504% |
| C | 5974 | 977 | 16.354202% |
| D | 5974 | 1322 | 22.129227% |
Noise dominated data is calculated using 1-second bins in cleaned event files. If a bin has >2000 counts, and if more than 50% of those come from <1% of pixels, then it is considered to be noise-dominated and hence unusable.
| Quadrant | # 1 sec bins | Bins with >0 counts | Bins with >2000 counts | High rate bins dominated by noise | Noise dominated (total time) | Noise dominated (detector-on time) | Marked lightcurve |
|---|---|---|---|---|---|---|---|
| A | 7123 | 5973 | 4208 | 4208 | 59.08% | 70.45% | 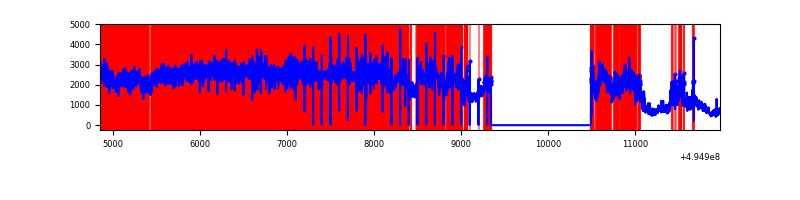 |
| B | 7124 | 5975 | 202 | 202 | 2.84% | 3.38% | 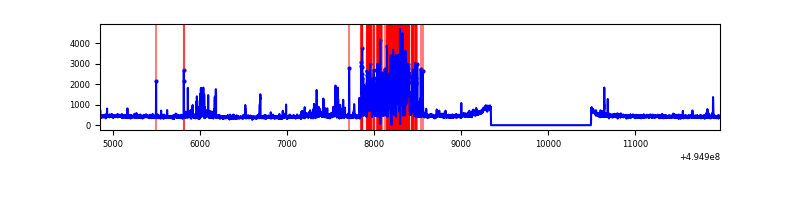 |
| C | 7124 | 5975 | 876 | 876 | 12.30% | 14.66% | 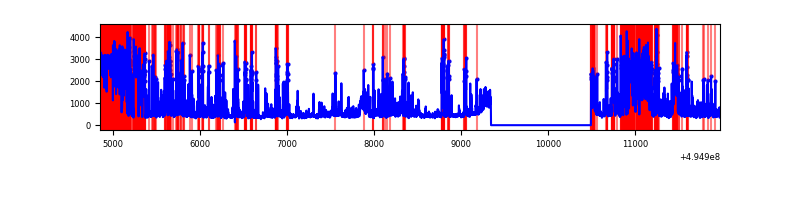 |
| D | 7124 | 5975 | 1211 | 1211 | 17.00% | 20.27% | 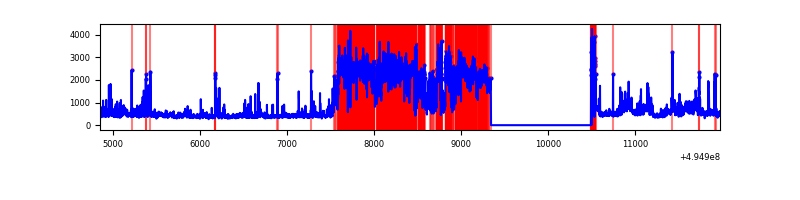 |
Top three noisy pixels from each quadrant. If the there are fewer than three noisy pixels in the level2.evt file, extra rows are filled as -1
| Pixel properties | Quadrant properties | ||||||
|---|---|---|---|---|---|---|---|
| Quadrant | DetID | PixID | Counts | Sigma | Mean | Median | Sigma |
| A | 3 | 63 | 11483329 | 150287.42 | 303 | 295 | 76.4 |
| A | 8 | 249 | 206532 | 2699.18 | 303 | 295 | 76.4 |
| A | 8 | 6 | 22985 | 296.96 | 303 | 295 | 76.4 |
| B | 5 | 185 | 732172 | 5421.47 | 624 | 600 | 134.9 |
| B | 0 | 213 | 77004 | 566.21 | 624 | 600 | 134.9 |
| B | 4 | 171 | 72378 | 531.93 | 624 | 600 | 134.9 |
| C | 1 | 241 | 1671016 | 10501.54 | 572 | 566 | 159.1 |
| C | 15 | 224 | 1631277 | 10251.71 | 572 | 566 | 159.1 |
| C | 7 | 64 | 67455 | 420.51 | 572 | 566 | 159.1 |
| D | 2 | 153 | 2734178 | 17392.89 | 548 | 524 | 157.2 |
| D | 2 | 172 | 696938 | 4430.94 | 548 | 524 | 157.2 |
| D | 3 | 224 | 119565 | 757.4 | 548 | 524 | 157.2 |
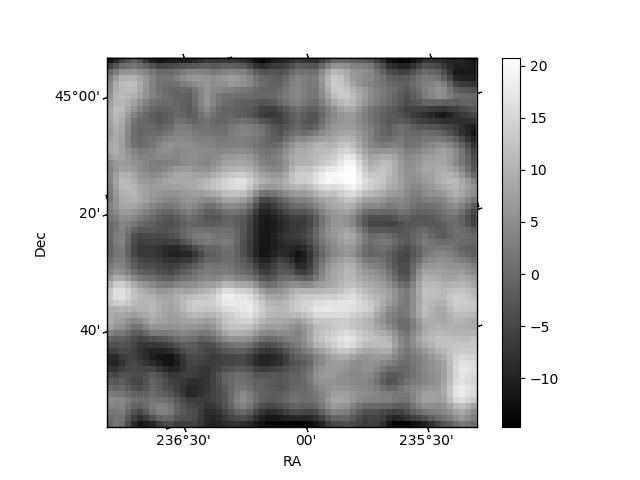
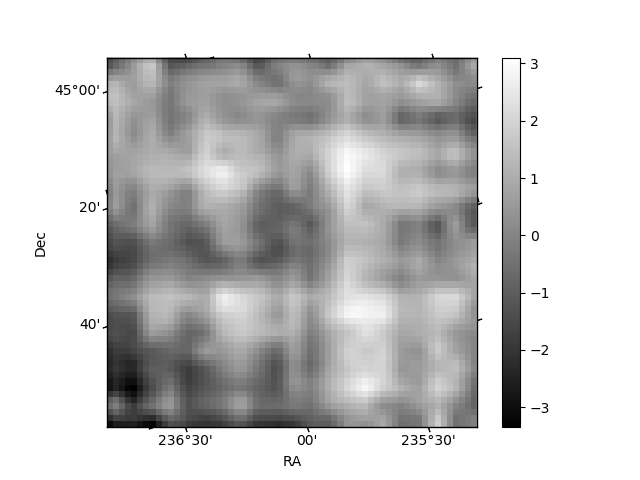
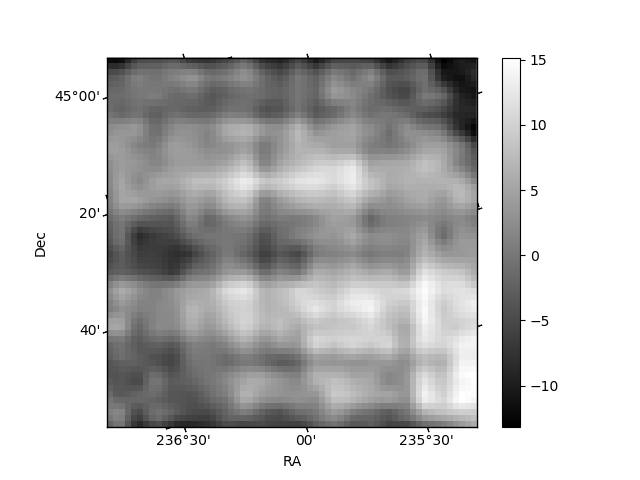
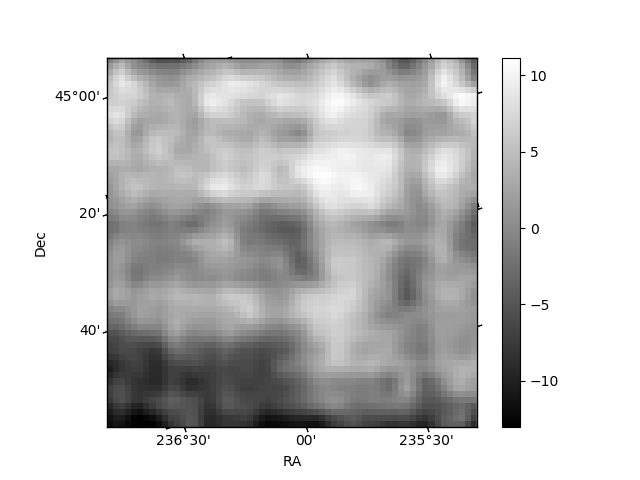
Histogram calculated using DETX and DETY for each event in the final _common_clean file
| Quadrant A | 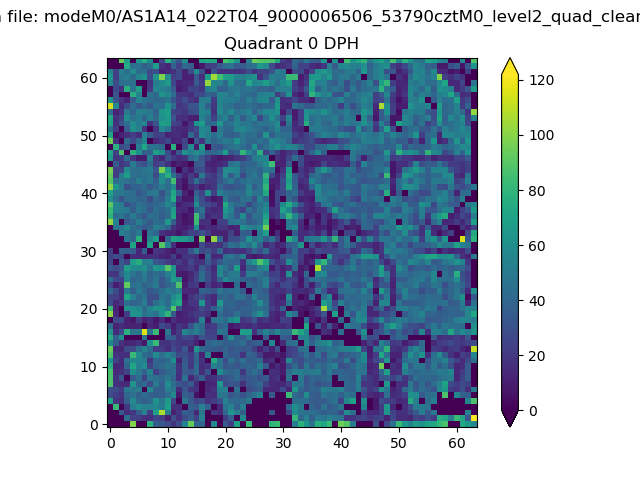 |
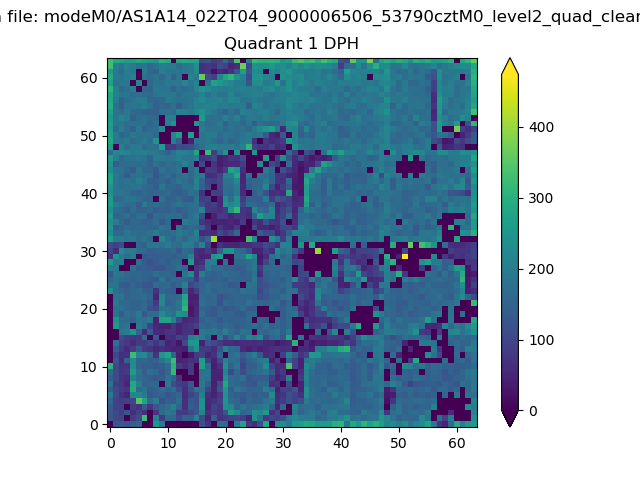 |
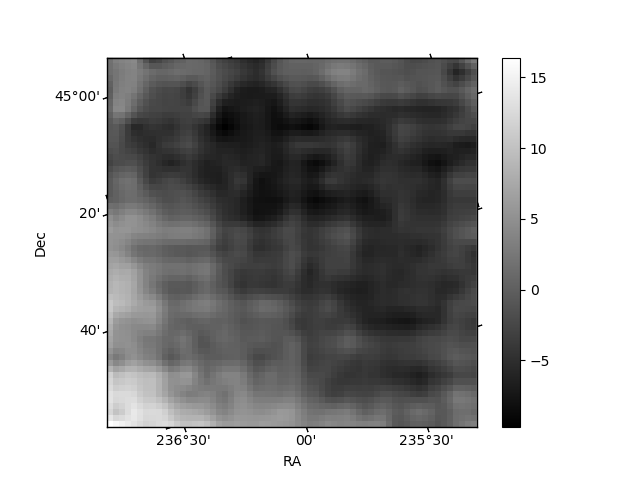
Quadrant B |
|---|---|---|---|
| Quadrant D | 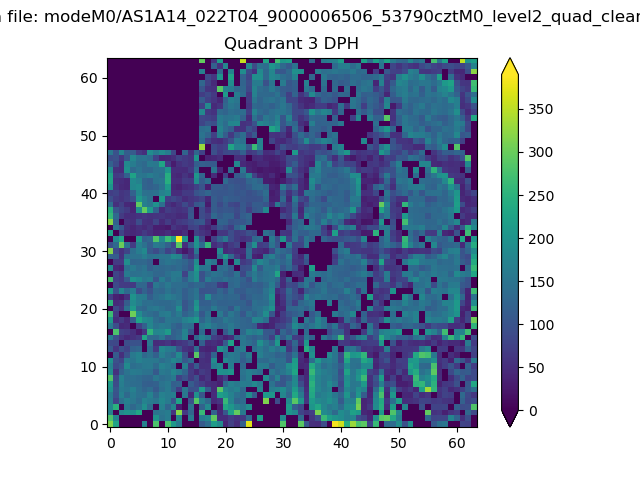 |
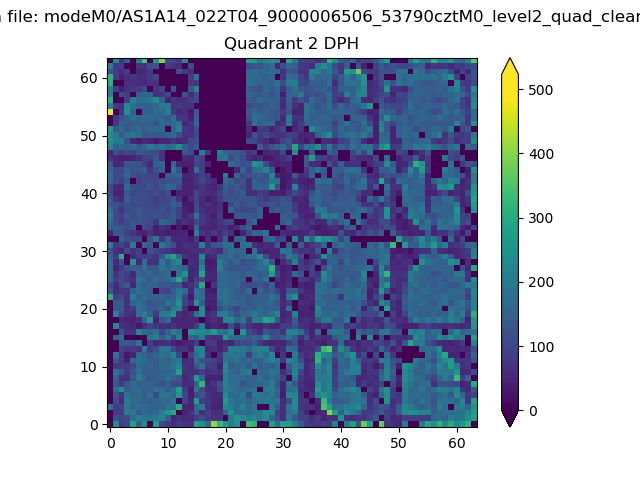 |
Quadrant C |
| Plot type | Count rate plots | Images |
|---|---|---|
| Comparison with Poisson distribution Blue bars denote a histogram of data divided into 1 sec bins. Red curve is a Poisson curve with rate = median count rate of data. |
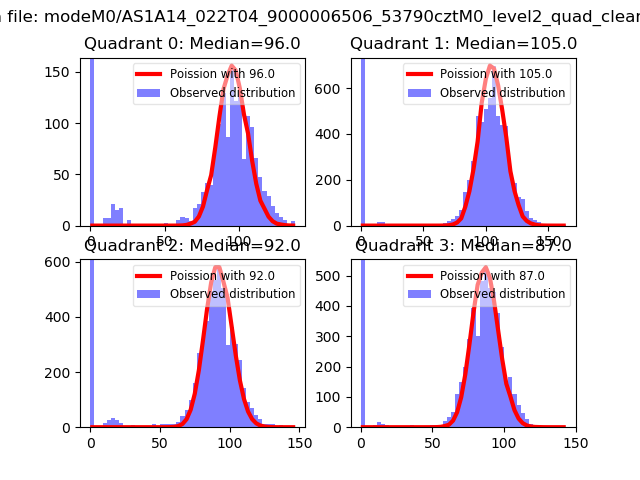 |
 |
| Quadrant-wise count rates Data is divided into 100 sec bins |
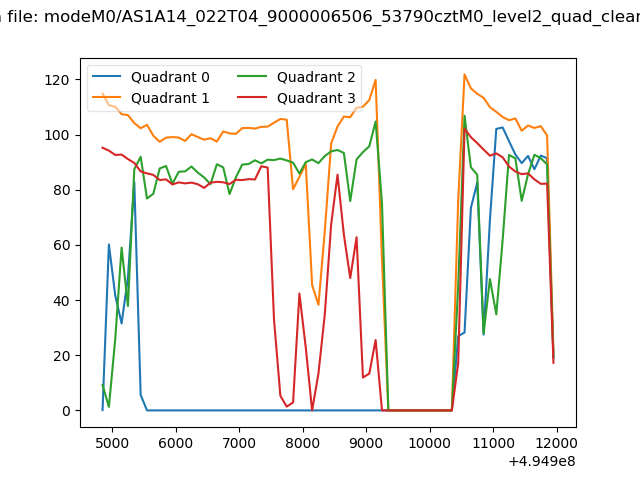 |
|
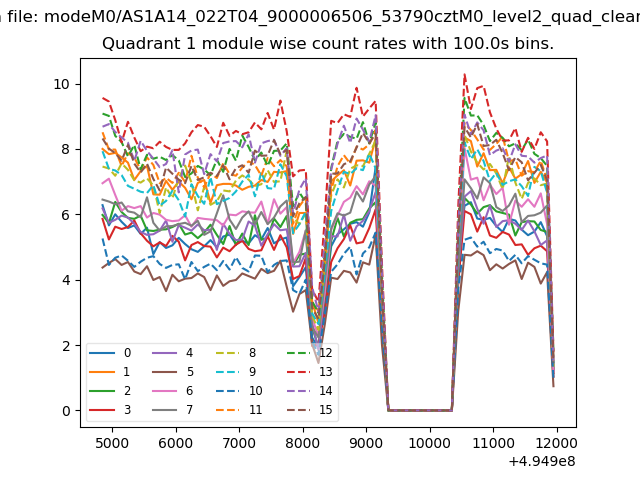
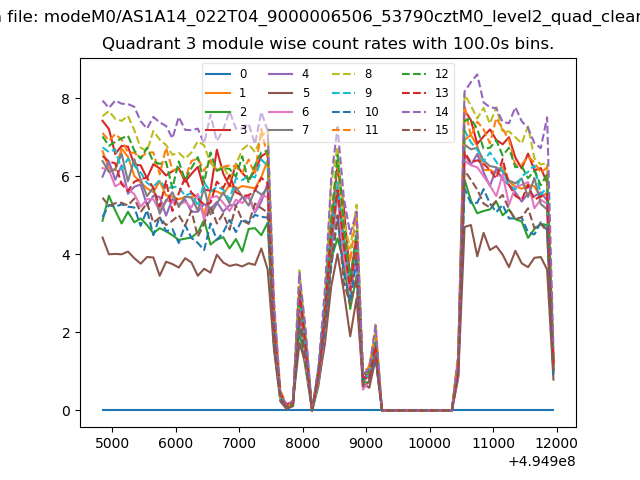
| Module-wise count rates for Quadrant A Data is divided into 100 sec bins |
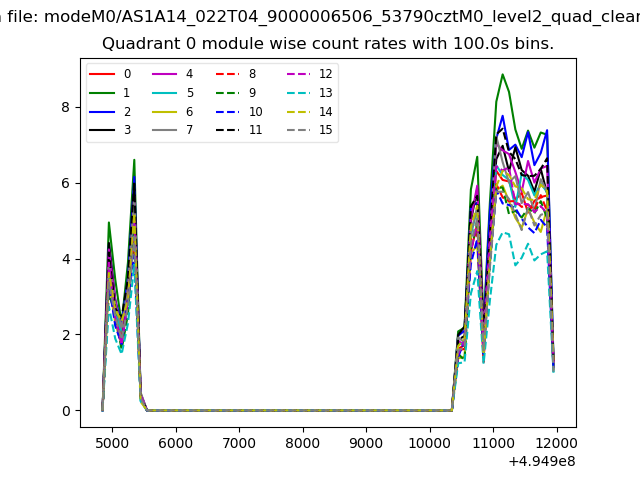 |
 |
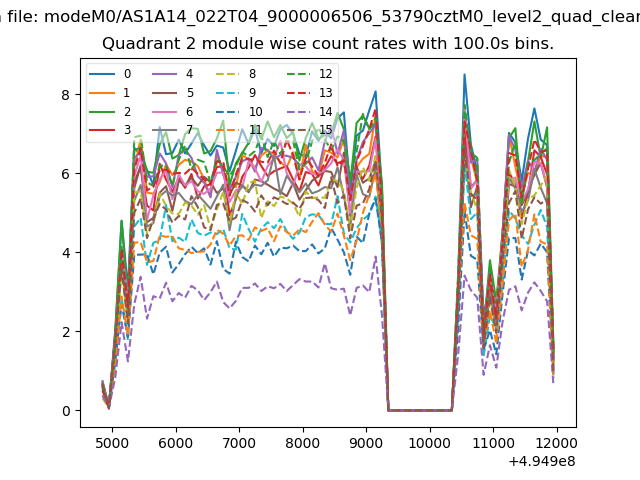
| Module-wise count rates for Quadrant B Data is divided into 100 sec bins |
 |
 |
| Module-wise count rates for Quadrant C Data is divided into 100 sec bins |
 |
 |
| Module-wise count rates for Quadrant D Data is divided into 100 sec bins |
 |
 |
| Parameter | Plot |
|---|---|
| CZT HV Monitor | 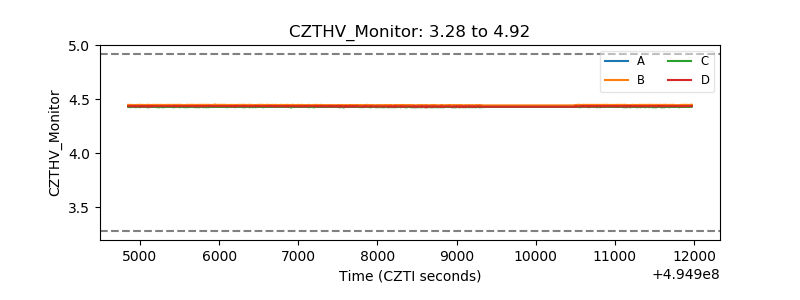 |
| D_VDD | 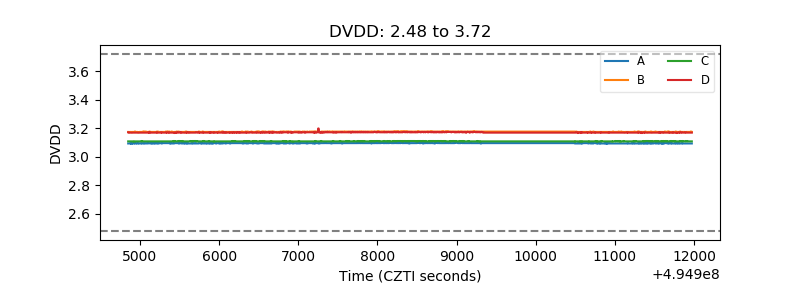 |
| Temperature 1 | 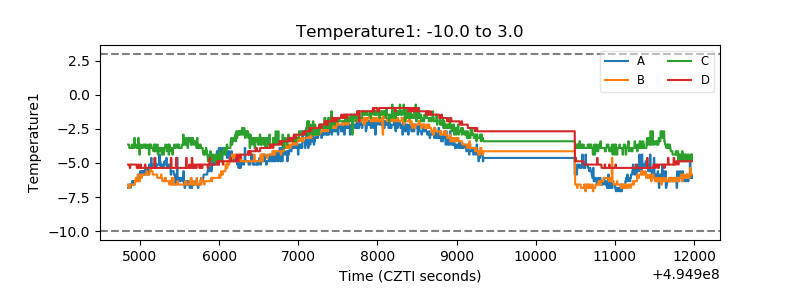 |
| Veto HV Monitor | 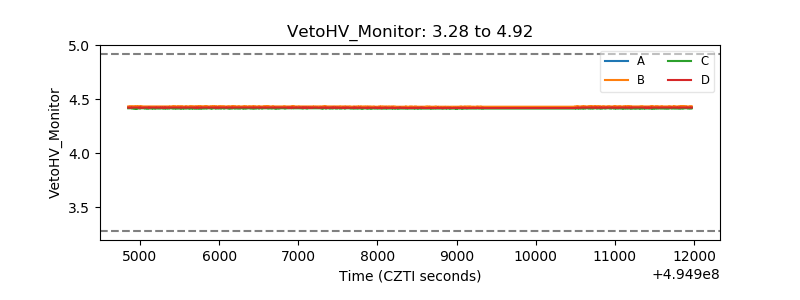 |
| Veto LLD | 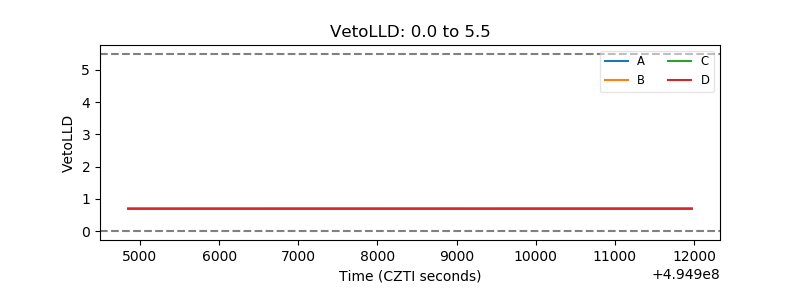 |
| Alpha Counter | 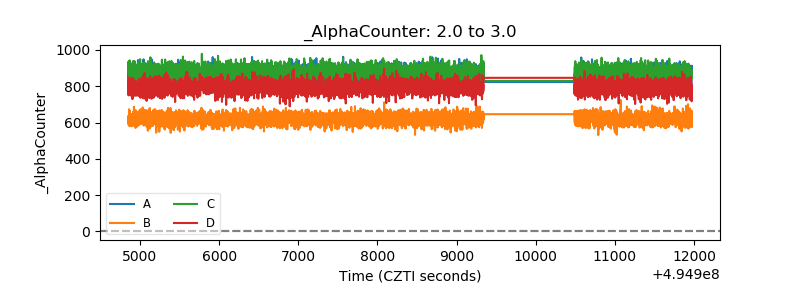 |
| _CPM_Rate | 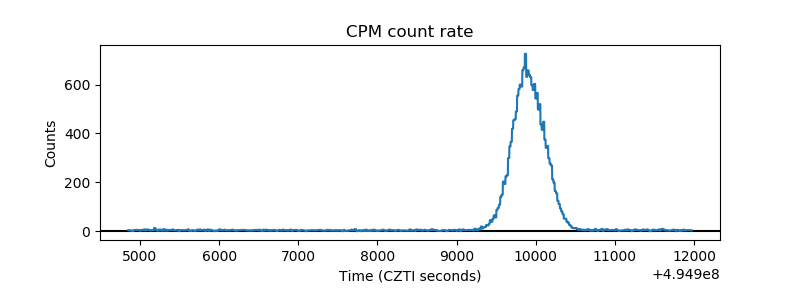 |
| CZT Counter | 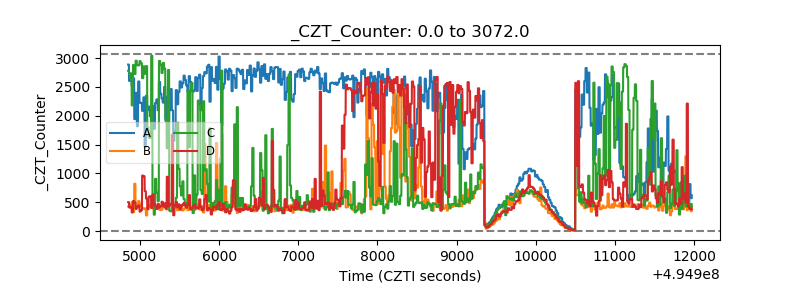 |
| +2.5 Volts monitor | 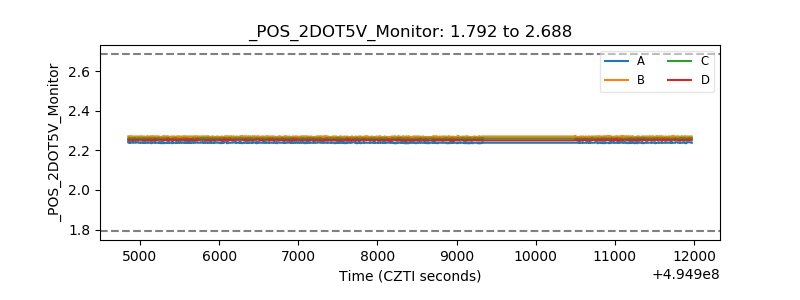 |
| +5 Volts monitor |  |
| _ROLL_ROT | 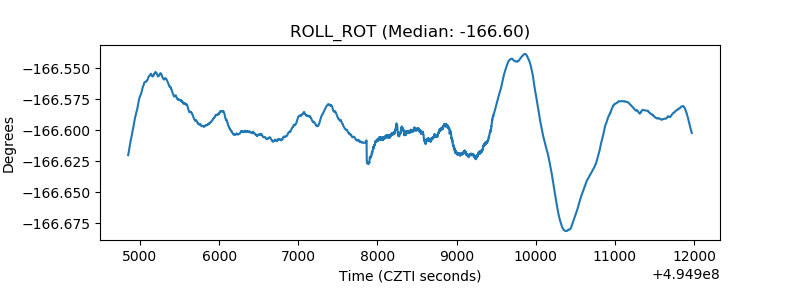 |
| _Roll_DEC | 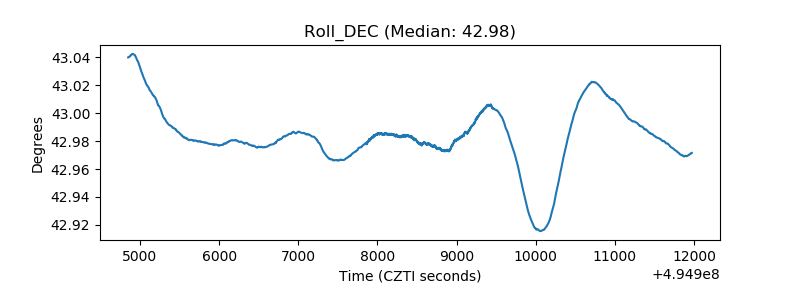 |
| _Roll_RA | 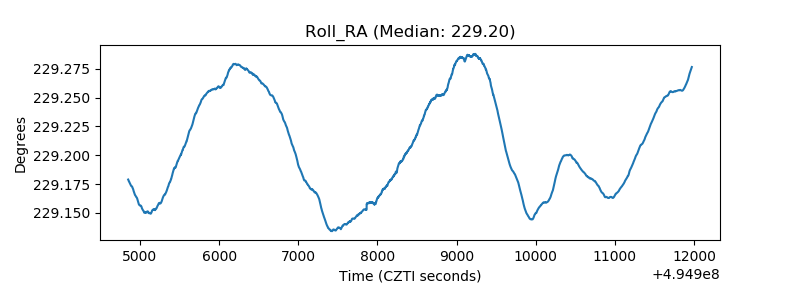 |
| Veto Counter | 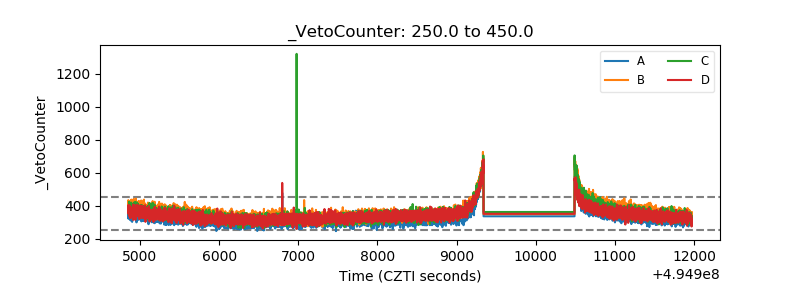 |