| Param | Original file | Final file |
|---|---|---|
| Filename | modeM0/AS1A14_022T04_9000006506_53791cztM0_level2.fits | modeM0/AS1A14_022T04_9000006506_53791cztM0_level2_quad_clean.evt |
| Size (bytes) | 713,623,680 | 88,992,000 |
| Size | 680.6 MB | 84.9 MB |
| Events in quadrant A | 9,472,971 | 482,664 |
| Events in quadrant B | 3,817,920 | 674,572 |
| Events in quadrant C | 6,119,445 | 548,643 |
| Events in quadrant D | 6,494,062 | 527,115 |
| Mode M0 | |||
|---|---|---|---|
| Quadrant | BADHDUFLAG | Total packets | Discarded packets |
| A | 0 | 32813 | 2 |
| B | 0 | 16152 | 2 |
| C | 0 | 22844 | 2 |
| D | 0 | 23887 | 2 |
| Mode SS | |||
|---|---|---|---|
| Quadrant | BADHDUFLAG | Total packets | Discarded packets |
| A | 0 | 136 | 0 |
| B | 0 | 136 | 0 |
| C | 0 | 136 | 0 |
| D | 0 | 136 | 0 |
| Mode M9 | |||
|---|---|---|---|
| Quadrant | BADHDUFLAG | Total packets | Discarded packets |
| A | 0 | 10 | 0 |
| B | 0 | 10 | 0 |
| C | 0 | 10 | 0 |
| D | 0 | 10 | 0 |
| Quadrant | Total seconds | Saturated seconds | Saturation percentage |
|---|---|---|---|
| A | 6614 | 1861 | 28.137285% |
| B | 6614 | 226 | 3.416994% |
| C | 6615 | 873 | 13.197279% |
| D | 6614 | 729 | 11.022074% |
Noise dominated data is calculated using 1-second bins in cleaned event files. If a bin has >2000 counts, and if more than 50% of those come from <1% of pixels, then it is considered to be noise-dominated and hence unusable.
| Quadrant | # 1 sec bins | Bins with >0 counts | Bins with >2000 counts | High rate bins dominated by noise | Noise dominated (total time) | Noise dominated (detector-on time) | Marked lightcurve |
|---|---|---|---|---|---|---|---|
| A | 7694 | 6615 | 1799 | 1799 | 23.38% | 27.20% | 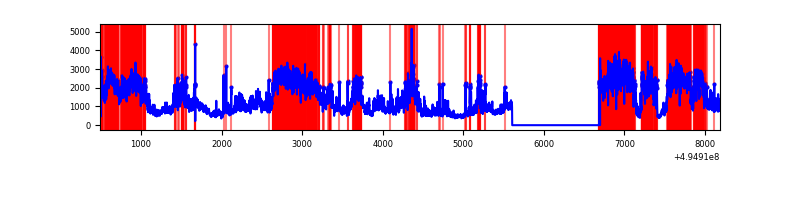 |
| B | 7694 | 6615 | 117 | 117 | 1.52% | 1.77% | 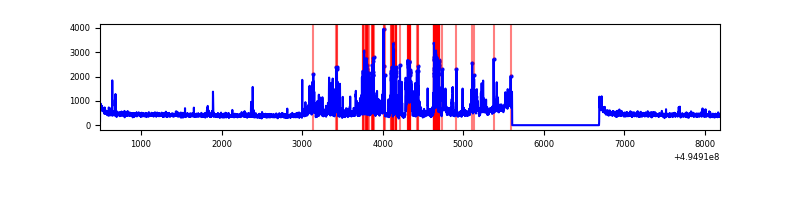 |
| C | 7695 | 6616 | 704 | 704 | 9.15% | 10.64% | 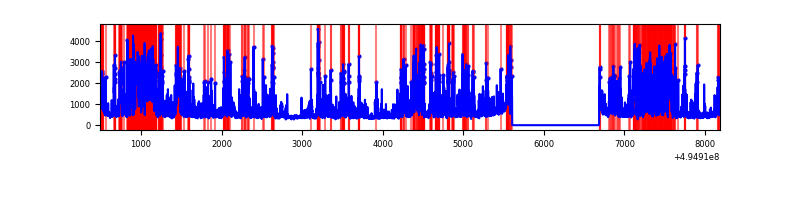 |
| D | 7694 | 6615 | 613 | 613 | 7.97% | 9.27% | 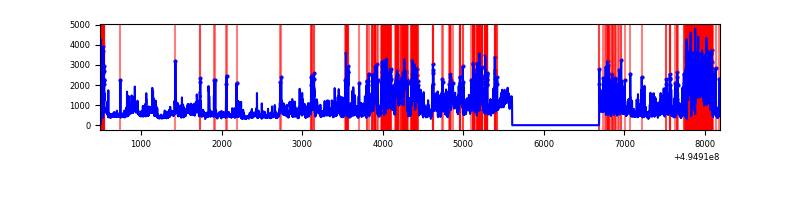 |
Top three noisy pixels from each quadrant. If the there are fewer than three noisy pixels in the level2.evt file, extra rows are filled as -1
| Pixel properties | Quadrant properties | ||||||
|---|---|---|---|---|---|---|---|
| Quadrant | DetID | PixID | Counts | Sigma | Mean | Median | Sigma |
| A | 3 | 63 | 6328086 | 40547.43 | 631 | 614 | 156.1 |
| A | 8 | 249 | 328568 | 2101.58 | 631 | 614 | 156.1 |
| A | 4 | 249 | 199574 | 1274.97 | 631 | 614 | 156.1 |
| B | 4 | 171 | 483742 | 3197.81 | 700 | 673 | 151.1 |
| B | 5 | 185 | 196654 | 1297.35 | 700 | 673 | 151.1 |
| B | 8 | 234 | 188592 | 1243.98 | 700 | 673 | 151.1 |
| C | 15 | 224 | 2678182 | 14836.59 | 651 | 643 | 180.5 |
| C | 1 | 241 | 593583 | 3285.56 | 651 | 643 | 180.5 |
| C | 12 | 2 | 120366 | 663.4 | 651 | 643 | 180.5 |
| D | 1 | 241 | 1102805 | 5956.36 | 650 | 622 | 185.0 |
| D | 2 | 153 | 660000 | 3563.38 | 650 | 622 | 185.0 |
| D | 2 | 172 | 637455 | 3441.54 | 650 | 622 | 185.0 |
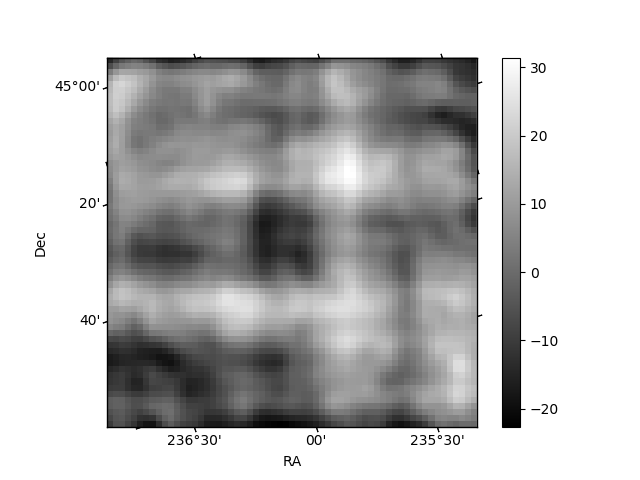
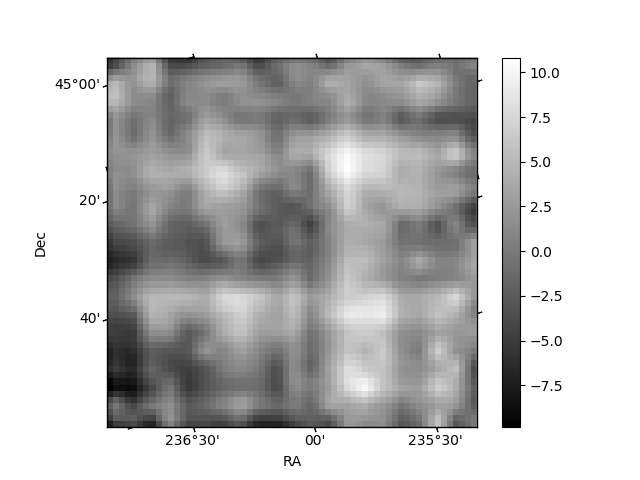
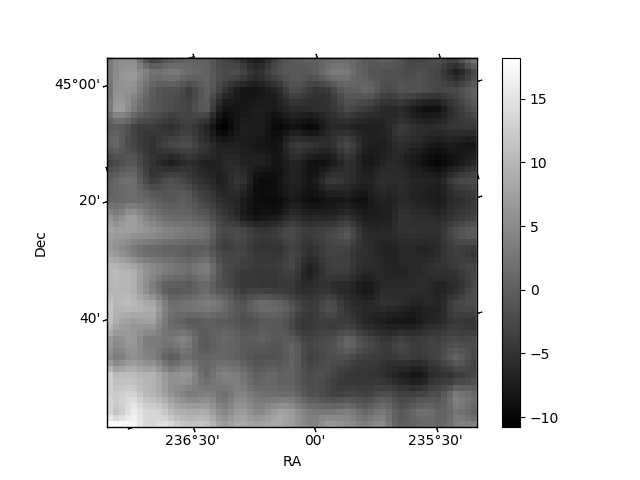
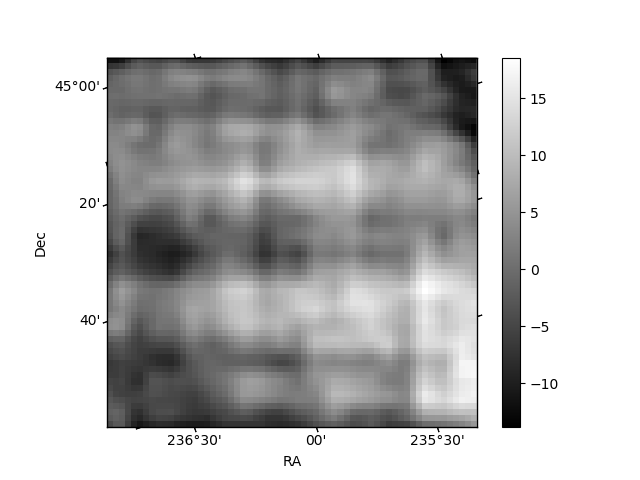
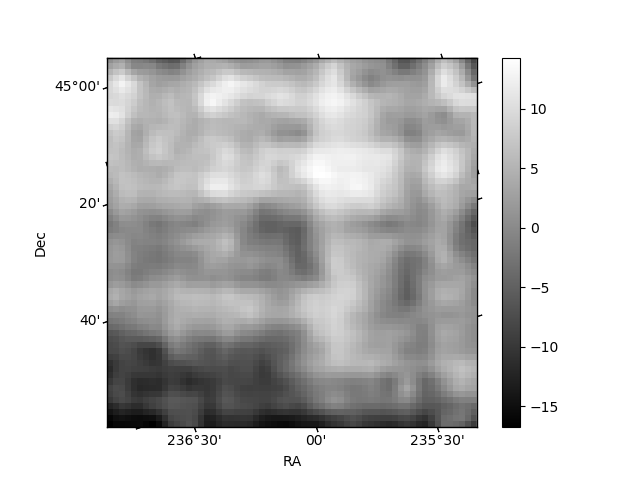
Histogram calculated using DETX and DETY for each event in the final _common_clean file
| Quadrant A | 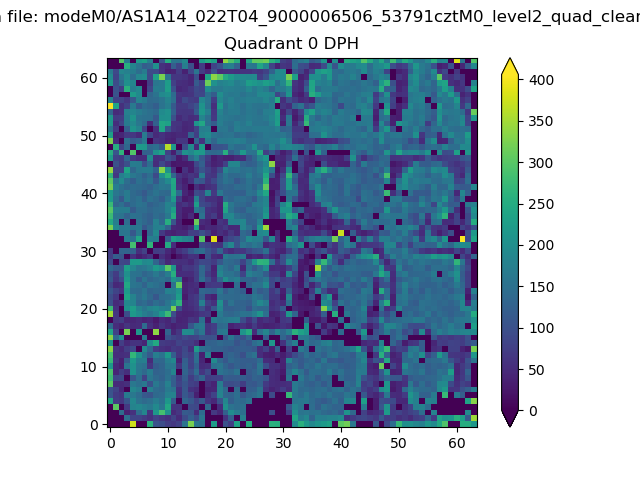 |
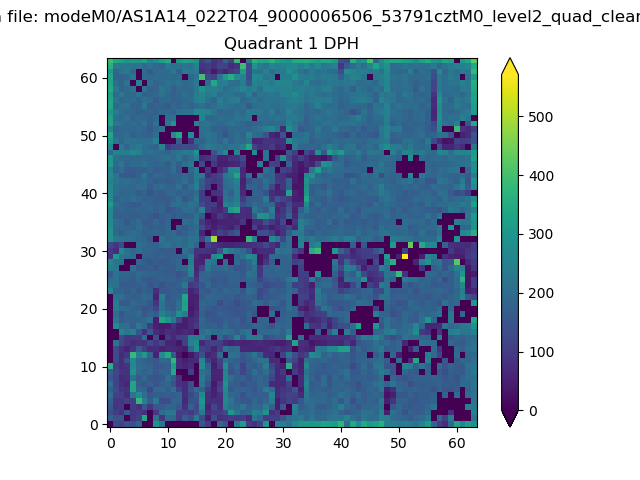 |
Quadrant B |
|---|---|---|---|
| Quadrant D | 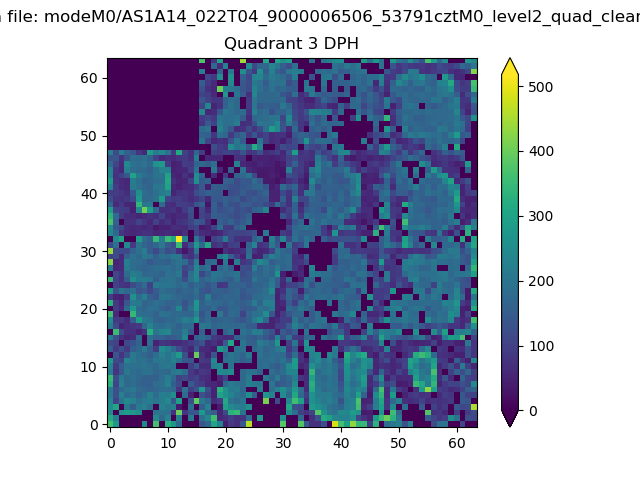 |
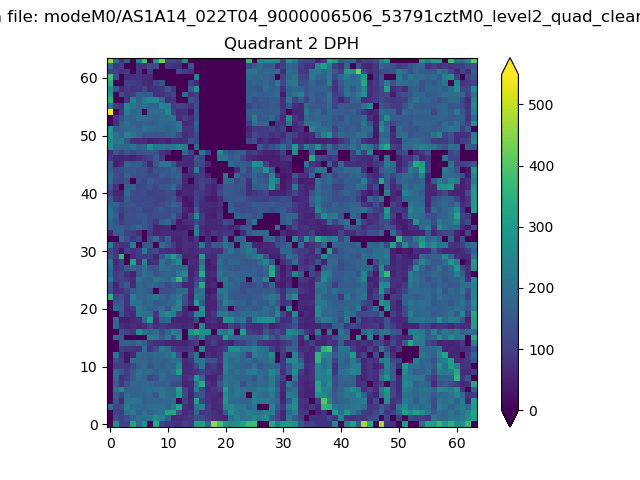 |
Quadrant C |
| Plot type | Count rate plots | Images |
|---|---|---|
| Comparison with Poisson distribution Blue bars denote a histogram of data divided into 1 sec bins. Red curve is a Poisson curve with rate = median count rate of data. |
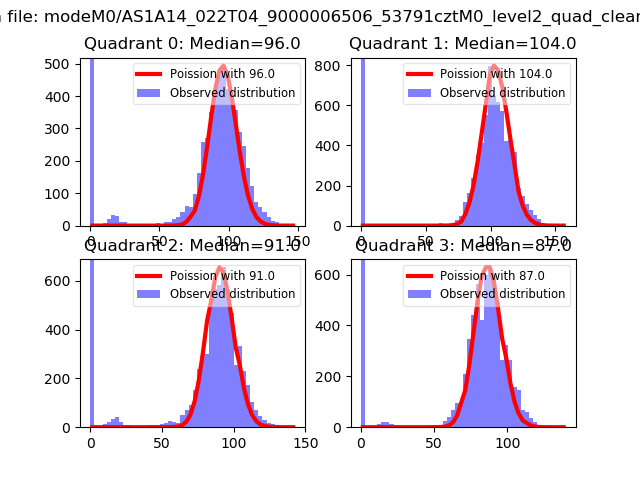 |
 |
| Quadrant-wise count rates Data is divided into 100 sec bins |
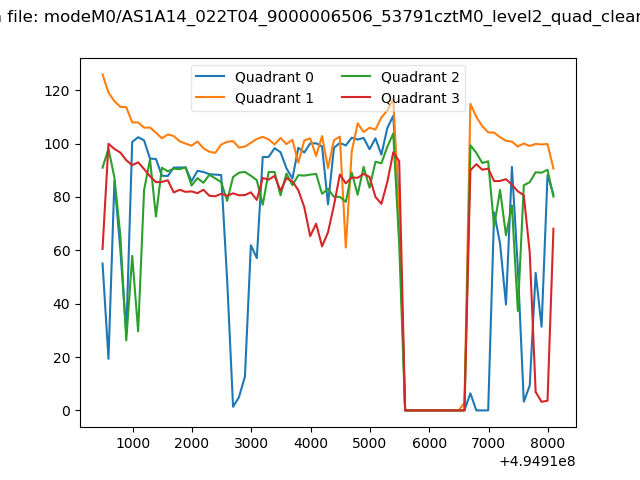 |
|
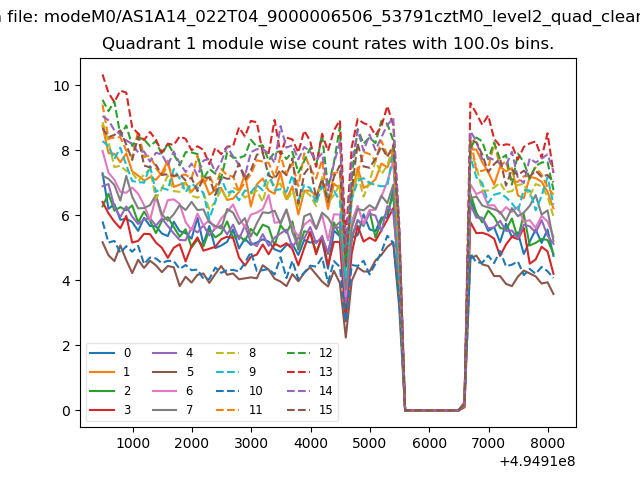
| Module-wise count rates for Quadrant A Data is divided into 100 sec bins |
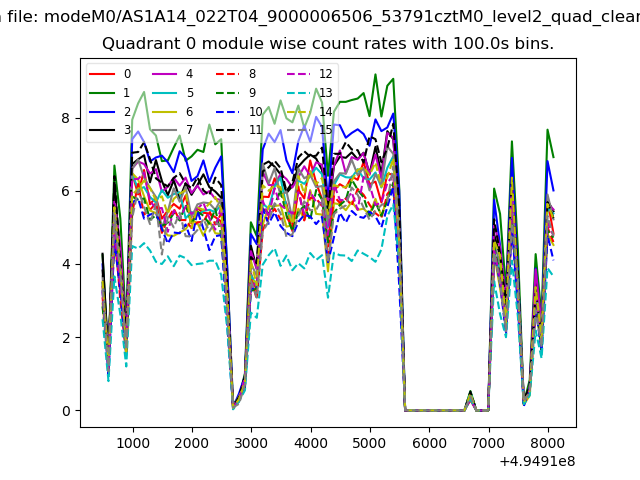 |
 |
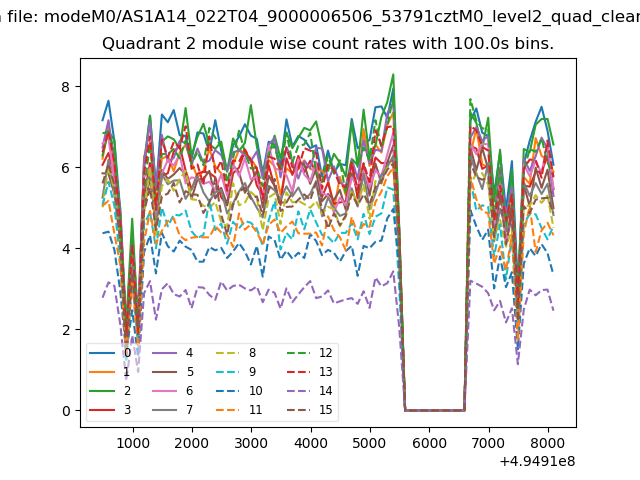
| Module-wise count rates for Quadrant B Data is divided into 100 sec bins |
 |
 |
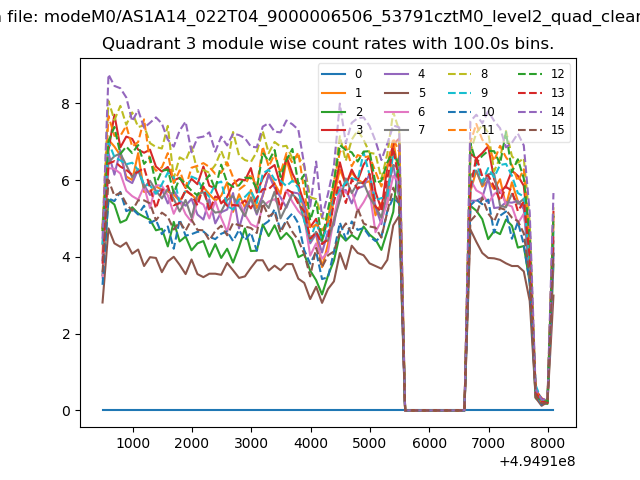
| Module-wise count rates for Quadrant C Data is divided into 100 sec bins |
 |
 |
| Module-wise count rates for Quadrant D Data is divided into 100 sec bins |
 |
 |
| Parameter | Plot |
|---|---|
| CZT HV Monitor | 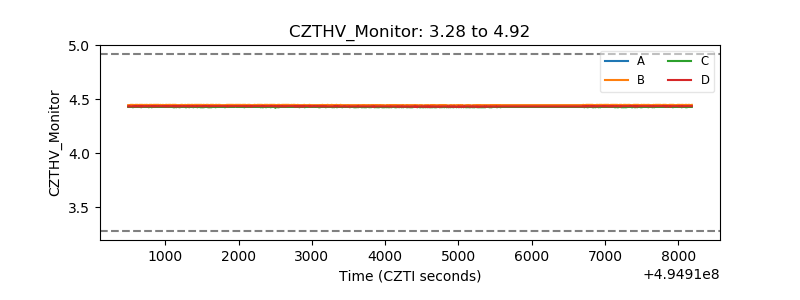 |
| D_VDD | 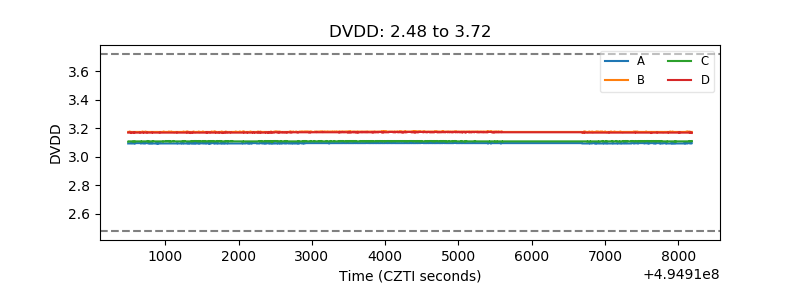 |
| Temperature 1 |  |
| Veto HV Monitor | 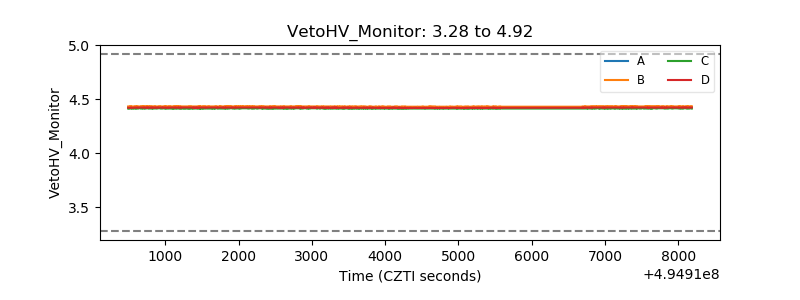 |
| Veto LLD | 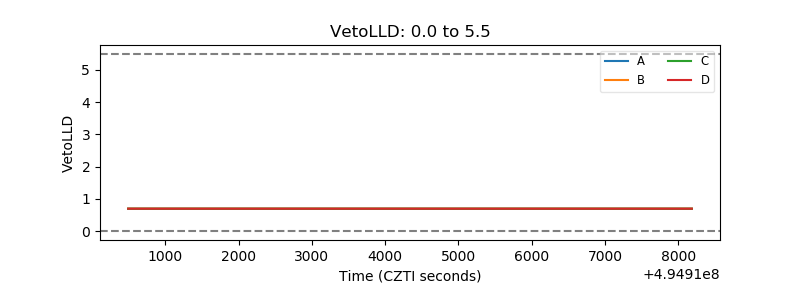 |
| Alpha Counter | 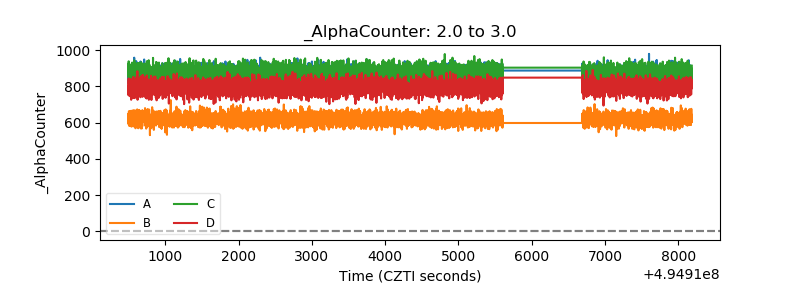 |
| _CPM_Rate | 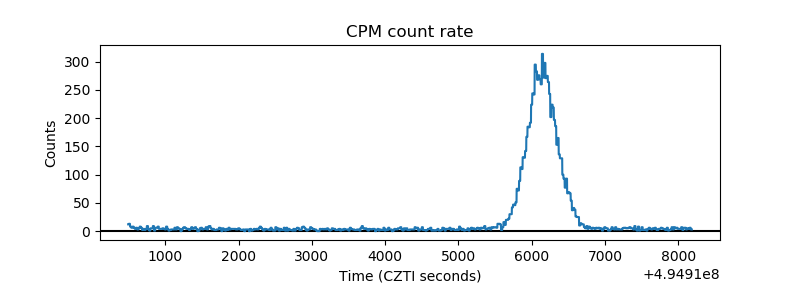 |
| CZT Counter | 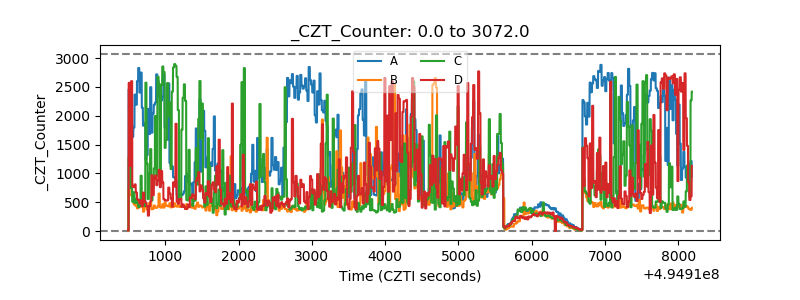 |
| +2.5 Volts monitor |  |
| +5 Volts monitor |  |
| _ROLL_ROT | 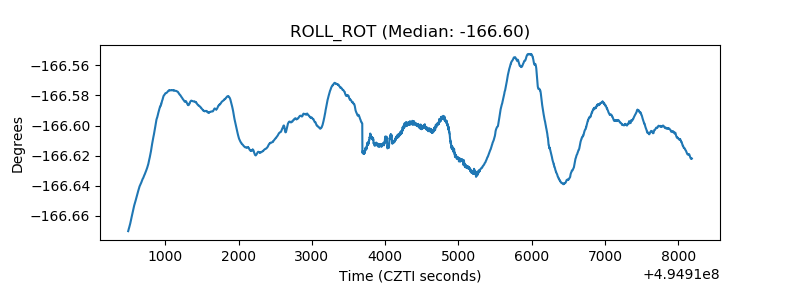 |
| _Roll_DEC | 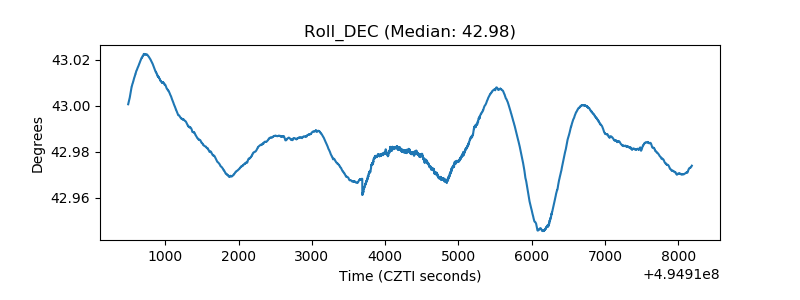 |
| _Roll_RA | 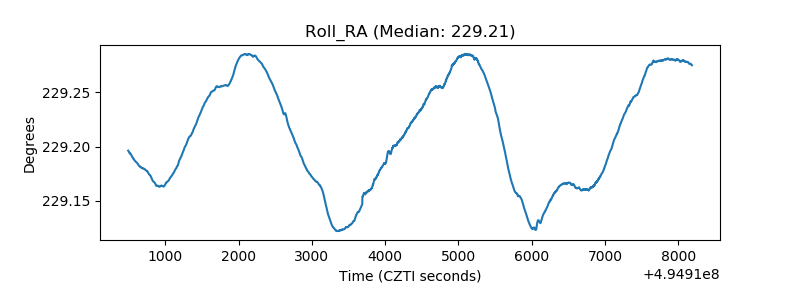 |
| Veto Counter | 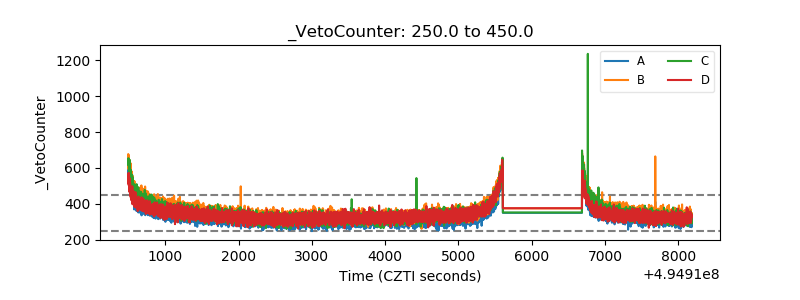 |