| Param | Original file | Final file |
|---|---|---|
| Filename | modeM0/AS1A14_022T04_9000006506_53792cztM0_level2.fits | modeM0/AS1A14_022T04_9000006506_53792cztM0_level2_quad_clean.evt |
| Size (bytes) | 798,955,200 | 82,103,040 |
| Size | 761.9 MB | 78.3 MB |
| Events in quadrant A | 11,327,878 | 344,722 |
| Events in quadrant B | 4,016,855 | 661,976 |
| Events in quadrant C | 6,035,259 | 537,452 |
| Events in quadrant D | 7,669,343 | 468,857 |
| Mode M0 | |||
|---|---|---|---|
| Quadrant | BADHDUFLAG | Total packets | Discarded packets |
| A | 0 | 38386 | 1 |
| B | 0 | 16772 | 1 |
| C | 0 | 22881 | 1 |
| D | 0 | 27525 | 5 |
| Mode SS | |||
|---|---|---|---|
| Quadrant | BADHDUFLAG | Total packets | Discarded packets |
| A | 0 | 138 | 0 |
| B | 0 | 138 | 0 |
| C | 0 | 138 | 0 |
| D | 0 | 138 | 0 |
| Mode M9 | |||
|---|---|---|---|
| Quadrant | BADHDUFLAG | Total packets | Discarded packets |
| A | 0 | 8 | 0 |
| B | 0 | 8 | 0 |
| C | 0 | 8 | 0 |
| D | 0 | 8 | 0 |
| Quadrant | Total seconds | Saturated seconds | Saturation percentage |
|---|---|---|---|
| A | 6781 | 3257 | 48.031264% |
| B | 6781 | 343 | 5.058251% |
| C | 6782 | 956 | 14.096137% |
| D | 6781 | 1449 | 21.368530% |
Noise dominated data is calculated using 1-second bins in cleaned event files. If a bin has >2000 counts, and if more than 50% of those come from <1% of pixels, then it is considered to be noise-dominated and hence unusable.
| Quadrant | # 1 sec bins | Bins with >0 counts | Bins with >2000 counts | High rate bins dominated by noise | Noise dominated (total time) | Noise dominated (detector-on time) | Marked lightcurve |
|---|---|---|---|---|---|---|---|
| A | 7591 | 6782 | 2954 | 2954 | 38.91% | 43.56% | 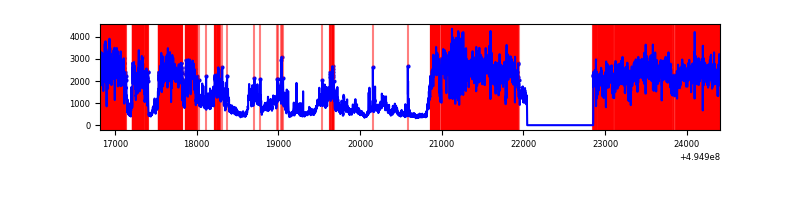 |
| B | 7591 | 6782 | 174 | 174 | 2.29% | 2.57% | 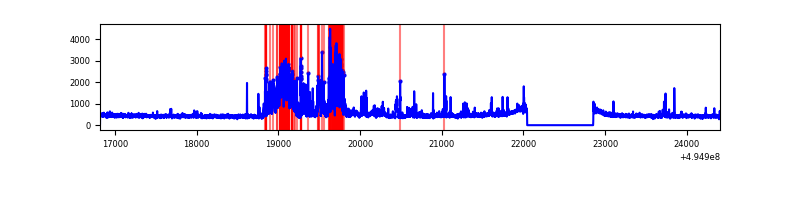 |
| C | 7592 | 6783 | 737 | 737 | 9.71% | 10.87% | 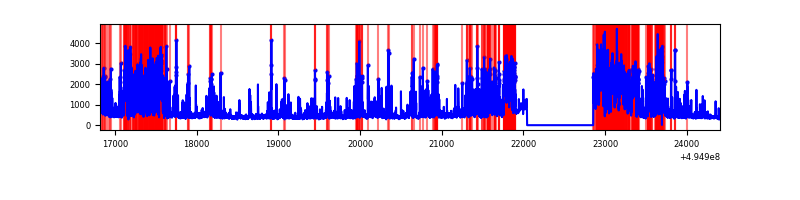 |
| D | 7591 | 6782 | 1185 | 1185 | 15.61% | 17.47% | 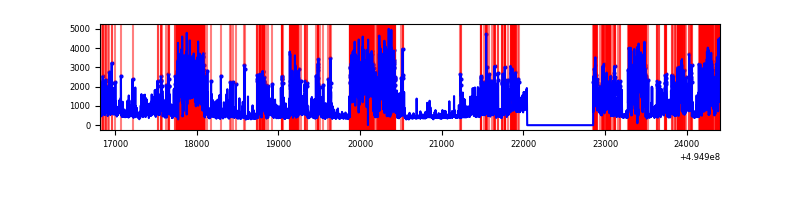 |
Top three noisy pixels from each quadrant. If the there are fewer than three noisy pixels in the level2.evt file, extra rows are filled as -1
| Pixel properties | Quadrant properties | ||||||
|---|---|---|---|---|---|---|---|
| Quadrant | DetID | PixID | Counts | Sigma | Mean | Median | Sigma |
| A | 3 | 63 | 8761247 | 63932.49 | 558 | 546 | 137.0 |
| A | 8 | 249 | 132489 | 962.87 | 558 | 546 | 137.0 |
| A | 4 | 249 | 75522 | 547.15 | 558 | 546 | 137.0 |
| B | 8 | 234 | 472053 | 3096.16 | 705 | 679 | 152.2 |
| B | 5 | 185 | 295691 | 1937.75 | 705 | 679 | 152.2 |
| B | 4 | 171 | 233452 | 1528.94 | 705 | 679 | 152.2 |
| C | 15 | 224 | 2084096 | 11565.98 | 650 | 644 | 180.1 |
| C | 1 | 241 | 1101274 | 6109.99 | 650 | 644 | 180.1 |
| C | 12 | 2 | 109080 | 601.97 | 650 | 644 | 180.1 |
| D | 1 | 241 | 2595620 | 14463.05 | 624 | 595 | 179.4 |
| D | 8 | 176 | 1329441 | 7406.16 | 624 | 595 | 179.4 |
| D | 2 | 172 | 560582 | 3121.02 | 624 | 595 | 179.4 |
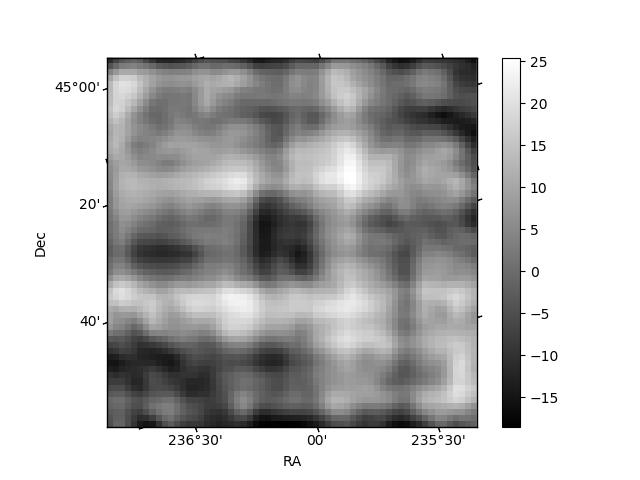
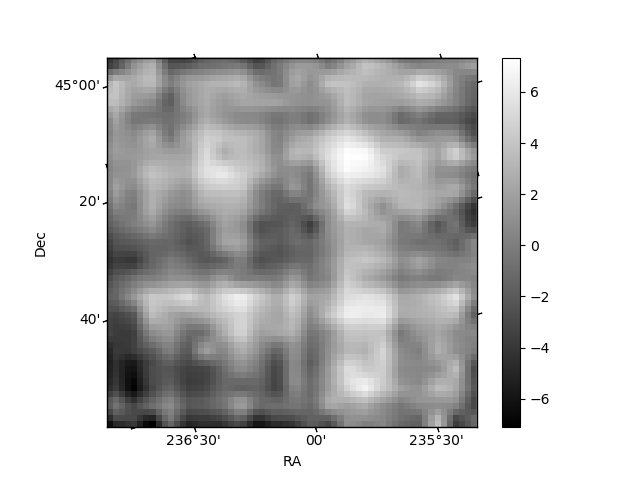
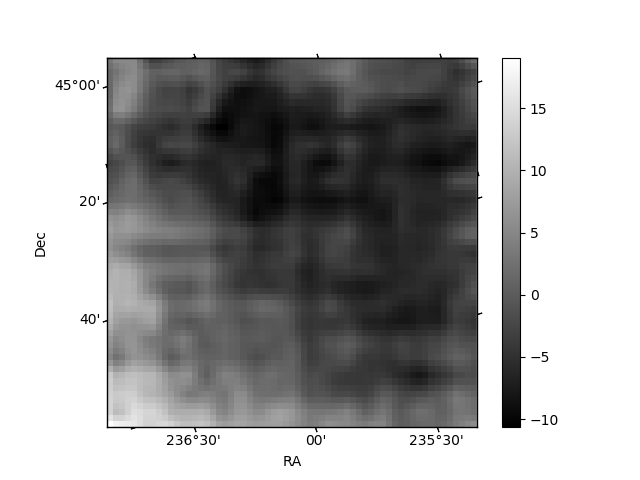
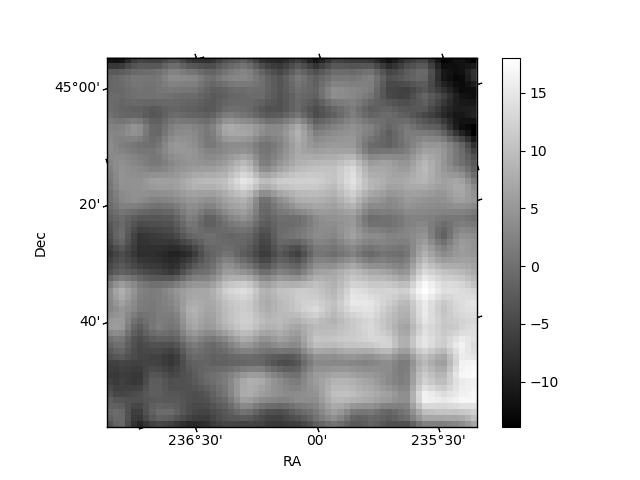
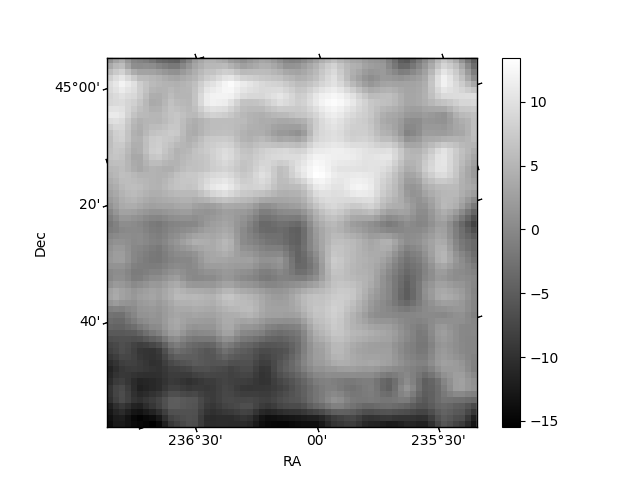
Histogram calculated using DETX and DETY for each event in the final _common_clean file
| Quadrant A | 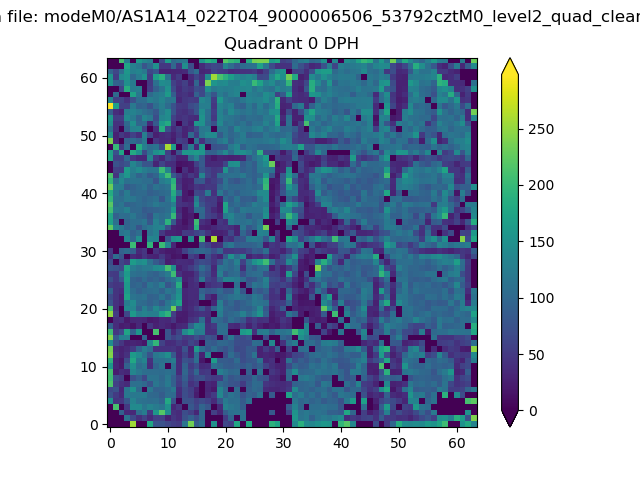 |
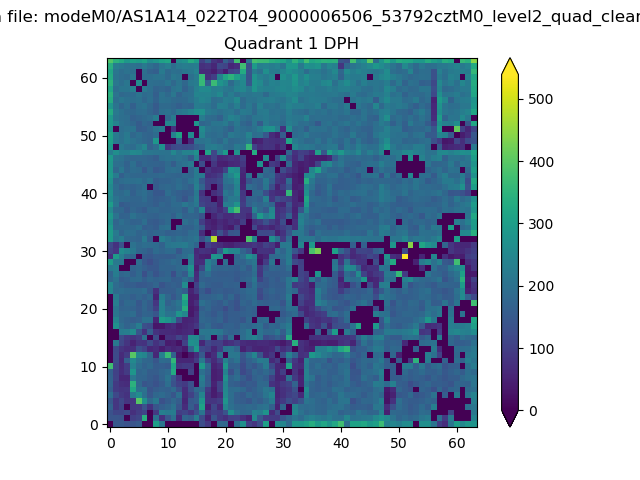 |
Quadrant B |
|---|---|---|---|
| Quadrant D | 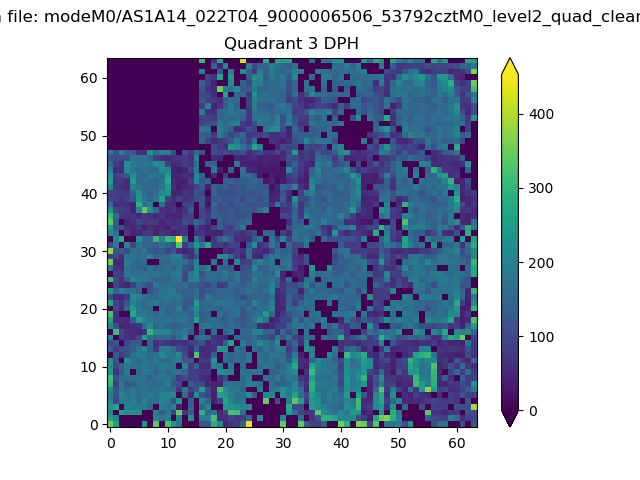 |
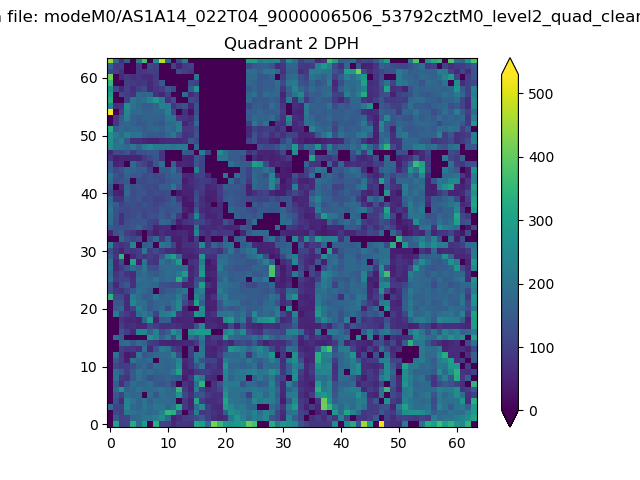 |
Quadrant C |
| Plot type | Count rate plots | Images |
|---|---|---|
| Comparison with Poisson distribution Blue bars denote a histogram of data divided into 1 sec bins. Red curve is a Poisson curve with rate = median count rate of data. |
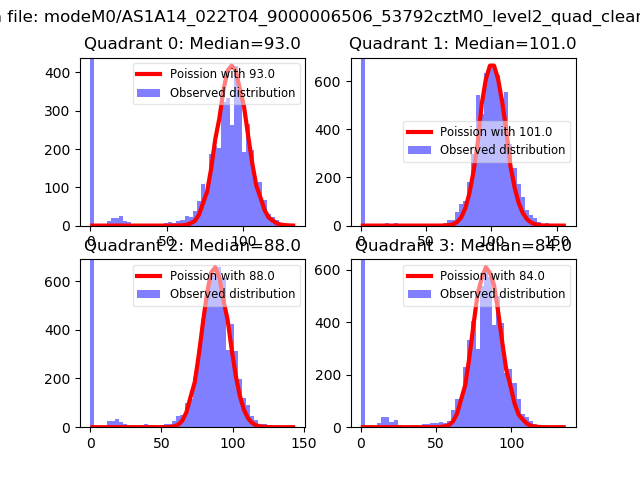 |
 |
| Quadrant-wise count rates Data is divided into 100 sec bins |
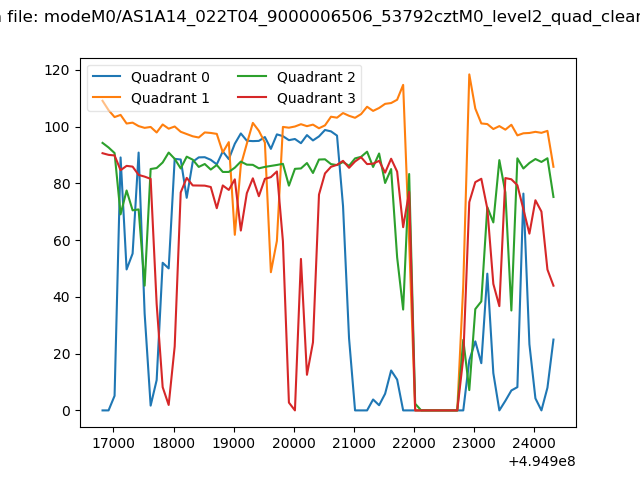 |
|
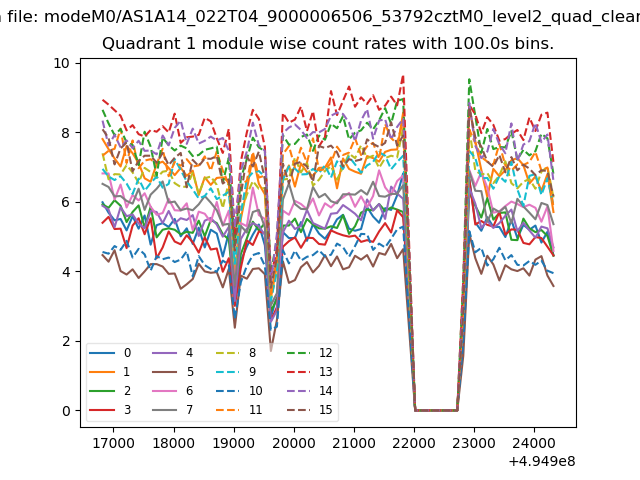
| Module-wise count rates for Quadrant A Data is divided into 100 sec bins |
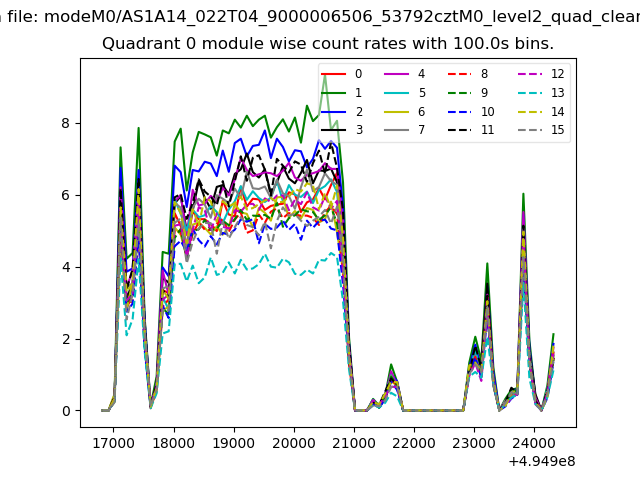 |
 |
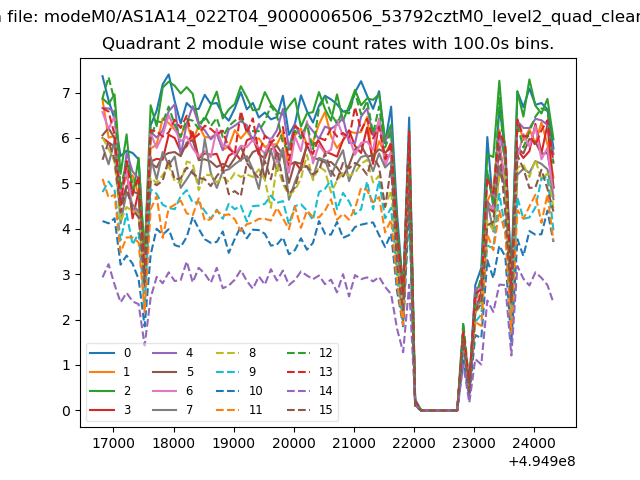
| Module-wise count rates for Quadrant B Data is divided into 100 sec bins |
 |
 |
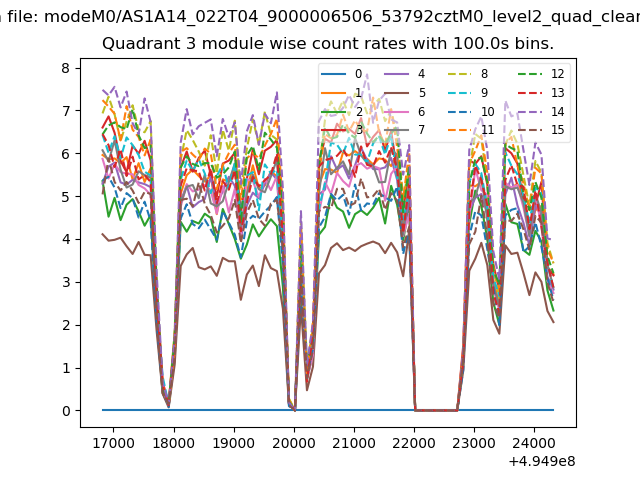
| Module-wise count rates for Quadrant C Data is divided into 100 sec bins |
 |
 |
| Module-wise count rates for Quadrant D Data is divided into 100 sec bins |
 |
 |
| Parameter | Plot |
|---|---|
| CZT HV Monitor | 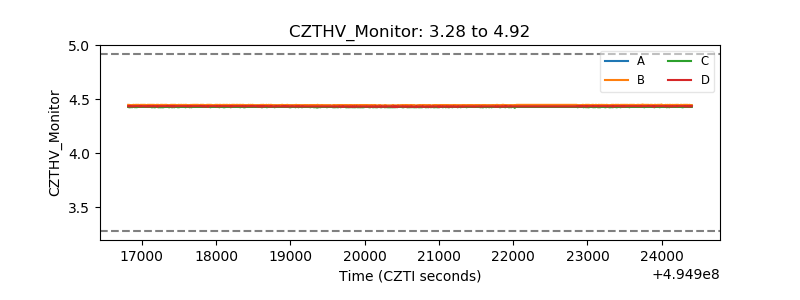 |
| D_VDD | 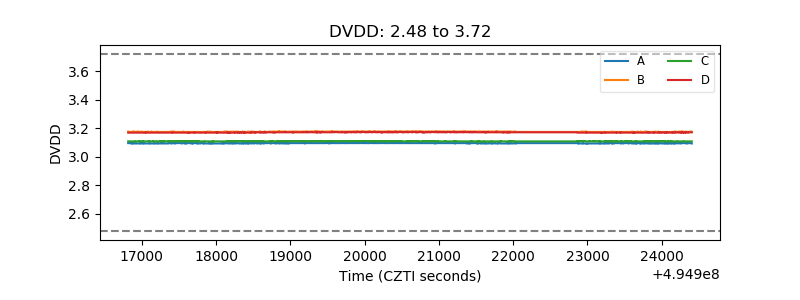 |
| Temperature 1 | 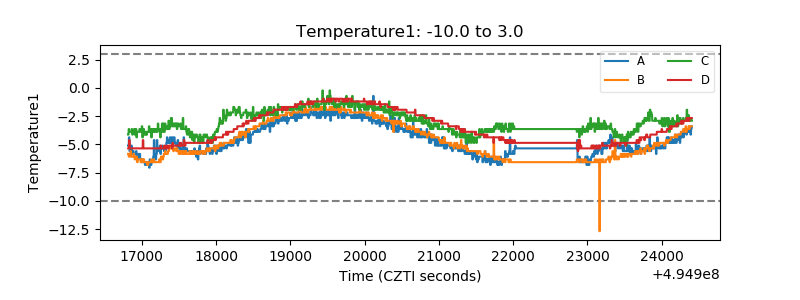 |
| Veto HV Monitor | 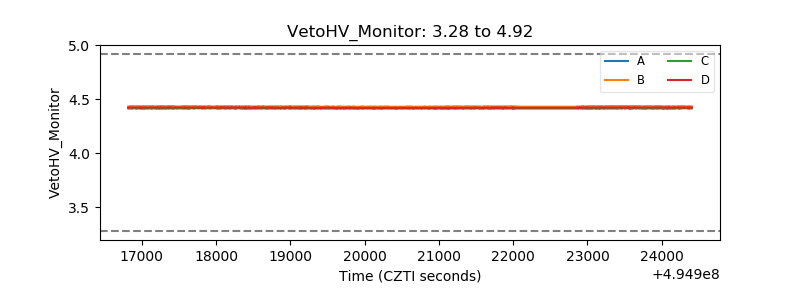 |
| Veto LLD | 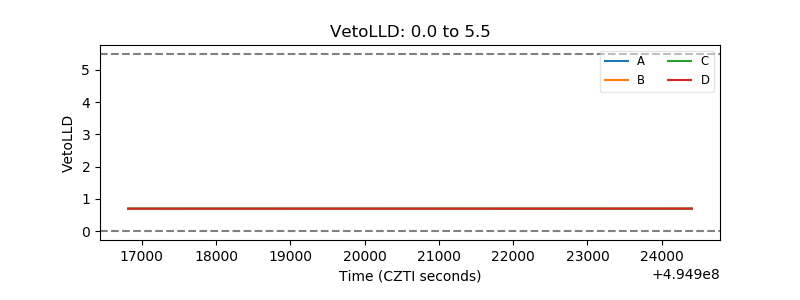 |
| Alpha Counter | 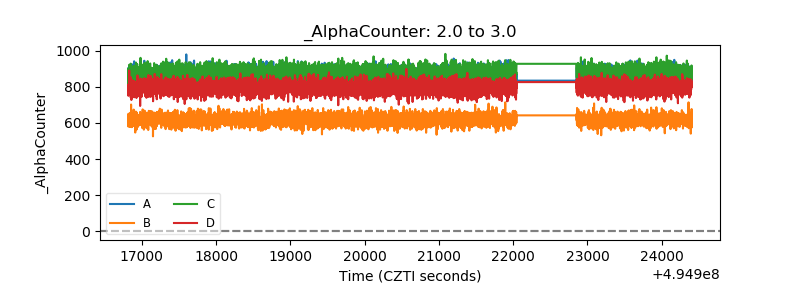 |
| _CPM_Rate | 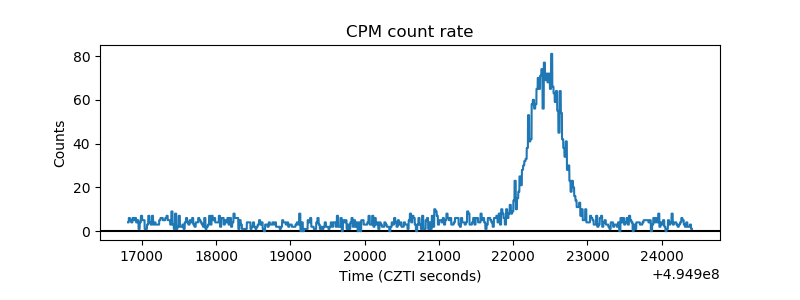 |
| CZT Counter | 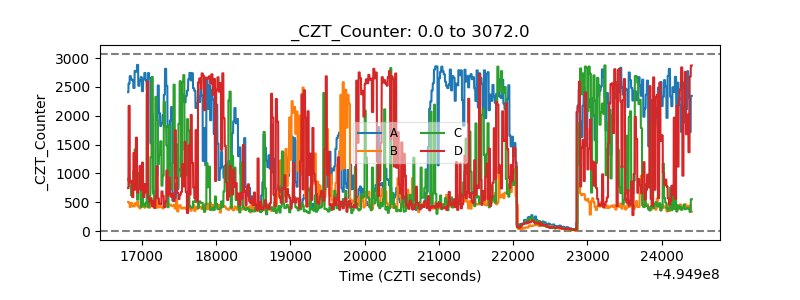 |
| +2.5 Volts monitor | 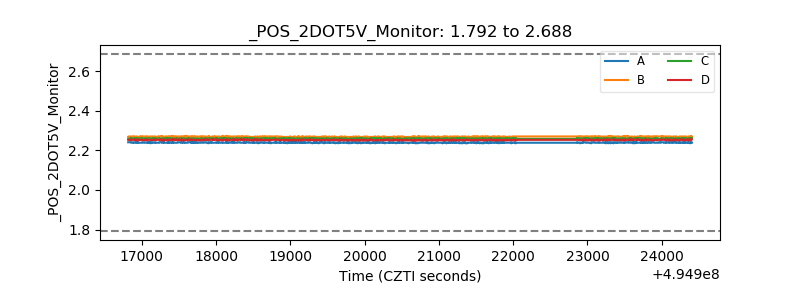 |
| +5 Volts monitor | 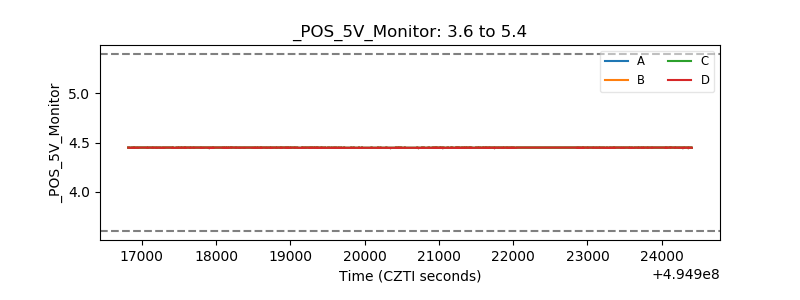 |
| _ROLL_ROT | 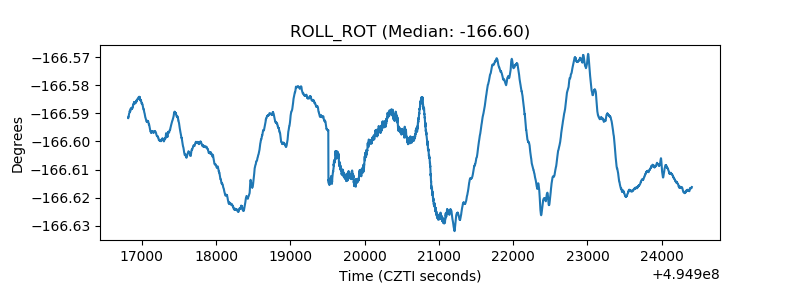 |
| _Roll_DEC | 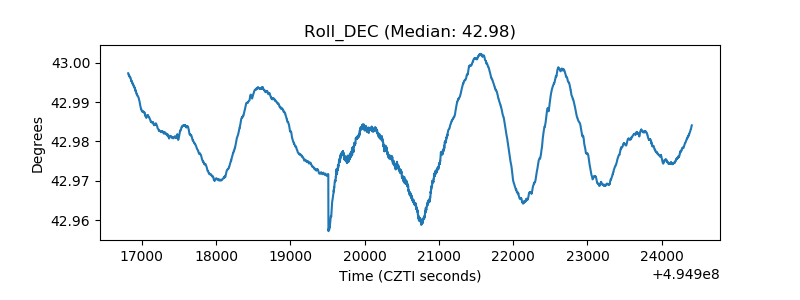 |
| _Roll_RA | 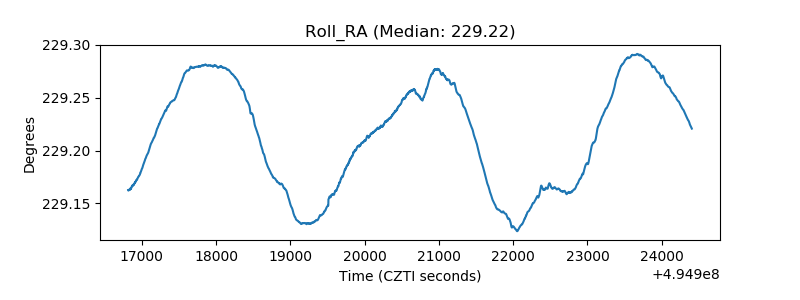 |
| Veto Counter | 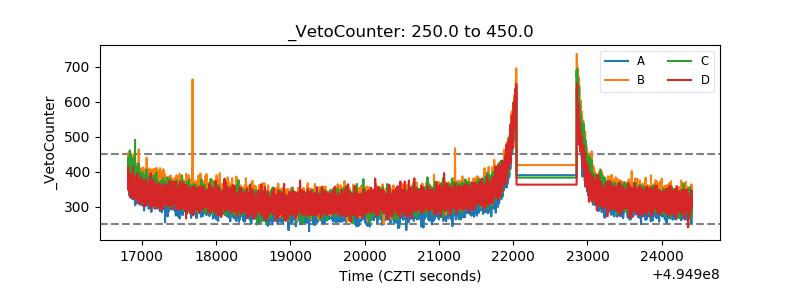 |