| Param | Original file | Final file |
|---|---|---|
| Filename | modeM0/AS1A14_022T04_9000006506_53793cztM0_level2.fits | modeM0/AS1A14_022T04_9000006506_53793cztM0_level2_quad_clean.evt |
| Size (bytes) | 1,053,527,040 | 78,508,800 |
| Size | 1004.7 MB | 74.9 MB |
| Events in quadrant A | 17,248,550 | 112,561 |
| Events in quadrant B | 3,992,930 | 724,444 |
| Events in quadrant C | 7,808,047 | 549,555 |
| Events in quadrant D | 9,376,763 | 475,749 |
| Mode M0 | |||
|---|---|---|---|
| Quadrant | BADHDUFLAG | Total packets | Discarded packets |
| A | 0 | 56324 | 1 |
| B | 0 | 17040 | 1 |
| C | 0 | 28442 | 1 |
| D | 0 | 33020 | 1 |
| Mode SS | |||
|---|---|---|---|
| Quadrant | BADHDUFLAG | Total packets | Discarded packets |
| A | 0 | 152 | 0 |
| B | 0 | 152 | 0 |
| C | 0 | 152 | 0 |
| D | 0 | 152 | 0 |
| Mode M9 | |||
|---|---|---|---|
| Quadrant | BADHDUFLAG | Total packets | Discarded packets |
| A | 0 | 3 | 0 |
| B | 0 | 3 | 0 |
| C | 0 | 3 | 0 |
| D | 0 | 3 | 0 |
| Quadrant | Total seconds | Saturated seconds | Saturation percentage |
|---|---|---|---|
| A | 7394 | 6344 | 85.799297% |
| B | 7394 | 267 | 3.611036% |
| C | 7395 | 1413 | 19.107505% |
| D | 7395 | 1996 | 26.991210% |
Noise dominated data is calculated using 1-second bins in cleaned event files. If a bin has >2000 counts, and if more than 50% of those come from <1% of pixels, then it is considered to be noise-dominated and hence unusable.
| Quadrant | # 1 sec bins | Bins with >0 counts | Bins with >2000 counts | High rate bins dominated by noise | Noise dominated (total time) | Noise dominated (detector-on time) | Marked lightcurve |
|---|---|---|---|---|---|---|---|
| A | 7704 | 7395 | 5935 | 5935 | 77.04% | 80.26% | 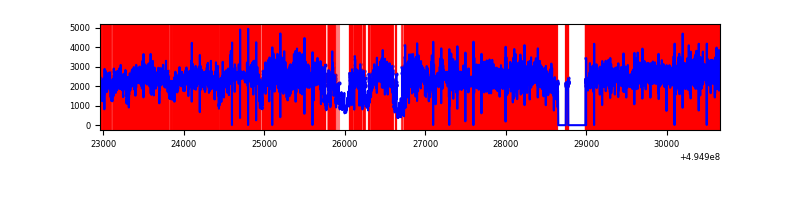 |
| B | 7704 | 7396 | 78 | 78 | 1.01% | 1.05% | 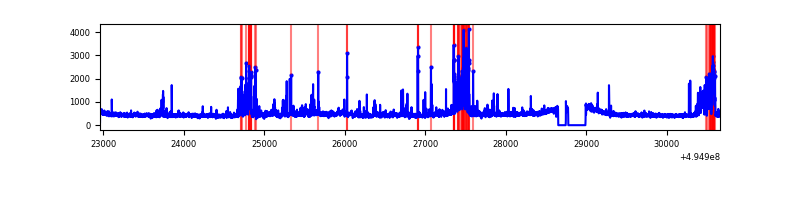 |
| C | 7705 | 7397 | 1107 | 1107 | 14.37% | 14.97% | 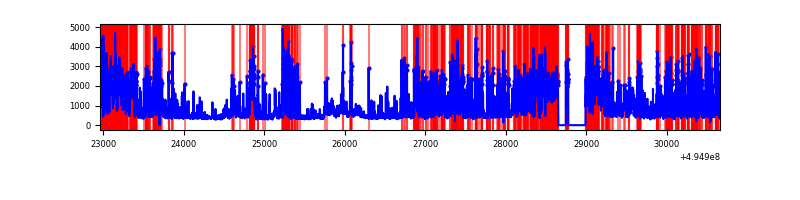 |
| D | 7705 | 7396 | 1639 | 1639 | 21.27% | 22.16% | 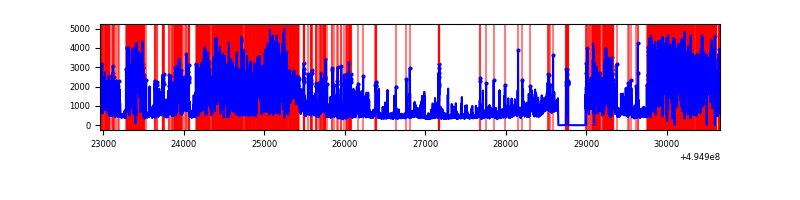 |
Top three noisy pixels from each quadrant. If the there are fewer than three noisy pixels in the level2.evt file, extra rows are filled as -1
| Pixel properties | Quadrant properties | ||||||
|---|---|---|---|---|---|---|---|
| Quadrant | DetID | PixID | Counts | Sigma | Mean | Median | Sigma |
| A | 3 | 63 | 15338020 | 160468.81 | 384 | 374 | 95.6 |
| A | 4 | 249 | 118440 | 1235.26 | 384 | 374 | 95.6 |
| A | 8 | 249 | 117186 | 1222.14 | 384 | 374 | 95.6 |
| B | 8 | 234 | 441379 | 2625.82 | 775 | 745 | 167.8 |
| B | 7 | 0 | 180000 | 1068.22 | 775 | 745 | 167.8 |
| B | 0 | 213 | 76811 | 453.29 | 775 | 745 | 167.8 |
| C | 15 | 224 | 2871751 | 14982.23 | 691 | 685 | 191.6 |
| C | 1 | 241 | 1765892 | 9211.47 | 691 | 685 | 191.6 |
| C | 15 | 158 | 176737 | 918.7 | 691 | 685 | 191.6 |
| D | 8 | 176 | 5123600 | 27451.66 | 655 | 626 | 186.6 |
| D | 1 | 241 | 774436 | 4146.49 | 655 | 626 | 186.6 |
| D | 3 | 12 | 231184 | 1235.45 | 655 | 626 | 186.6 |
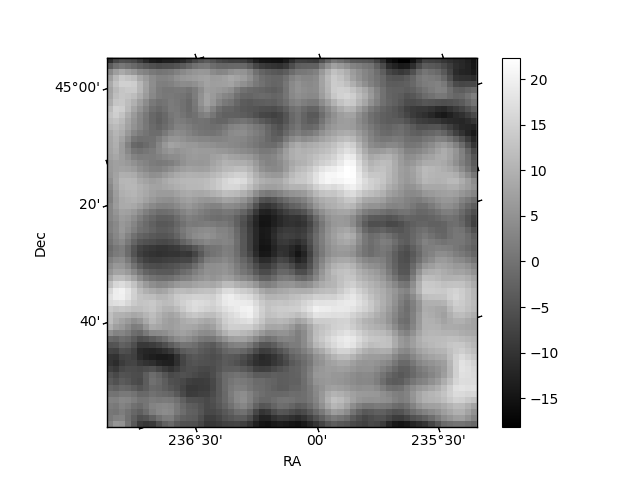
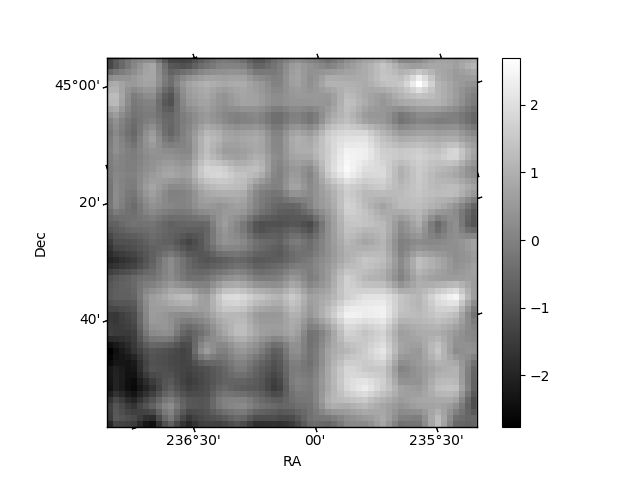
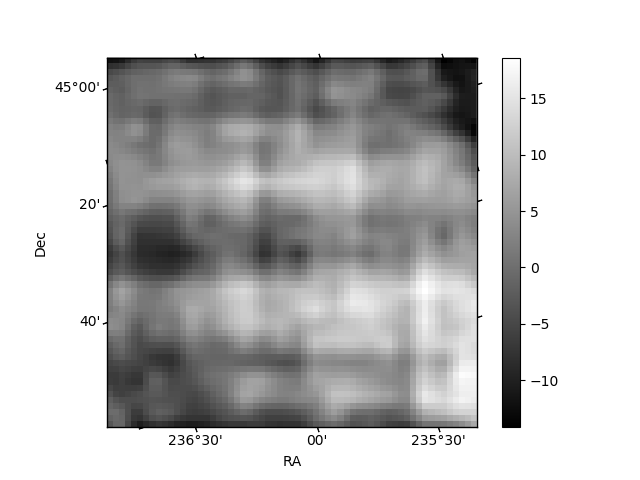
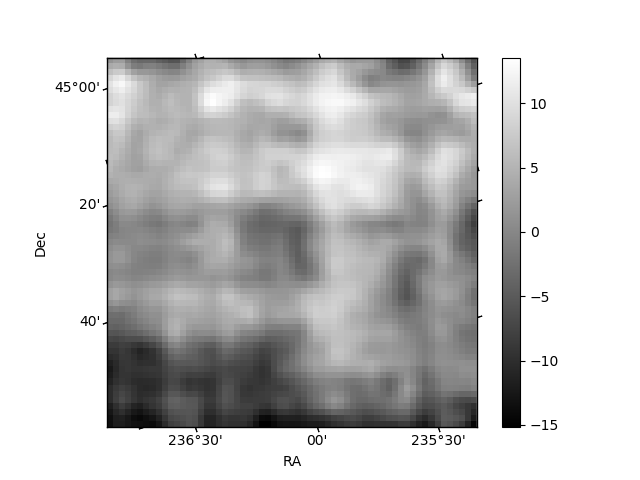
Histogram calculated using DETX and DETY for each event in the final _common_clean file
| Quadrant A | 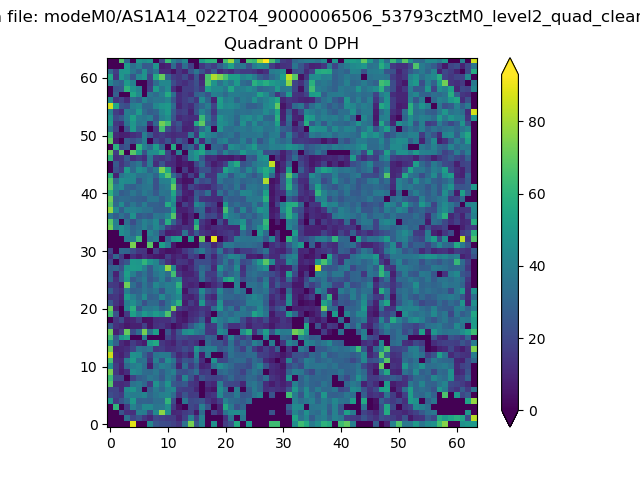 |
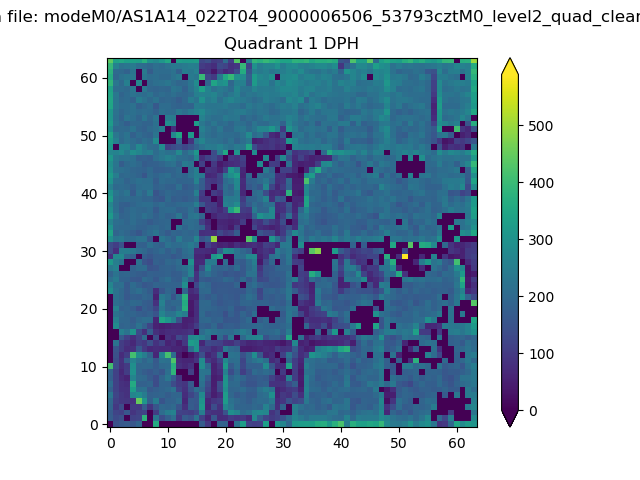 |
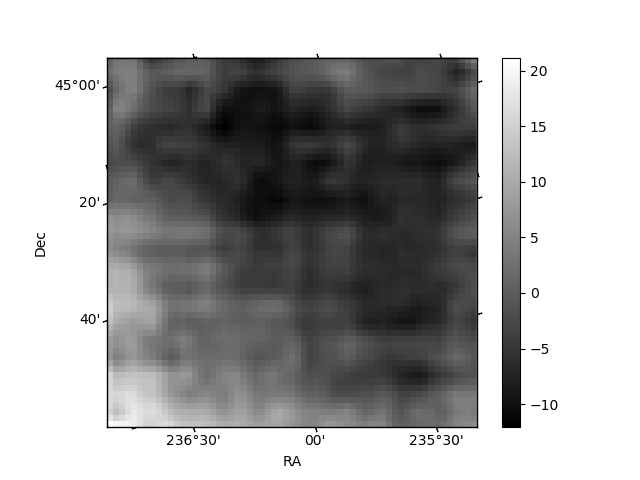
Quadrant B |
|---|---|---|---|
| Quadrant D | 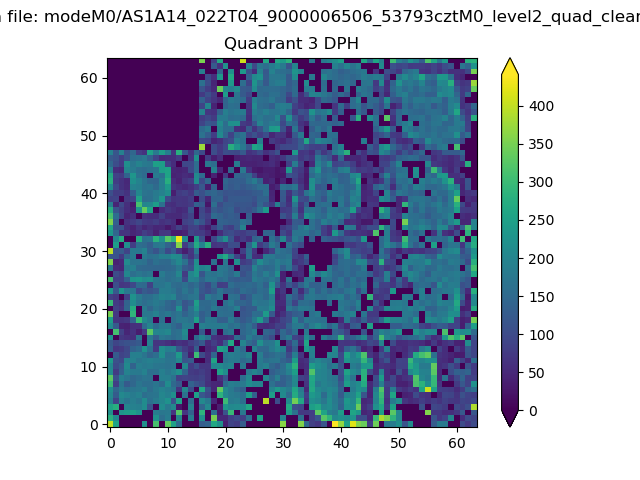 |
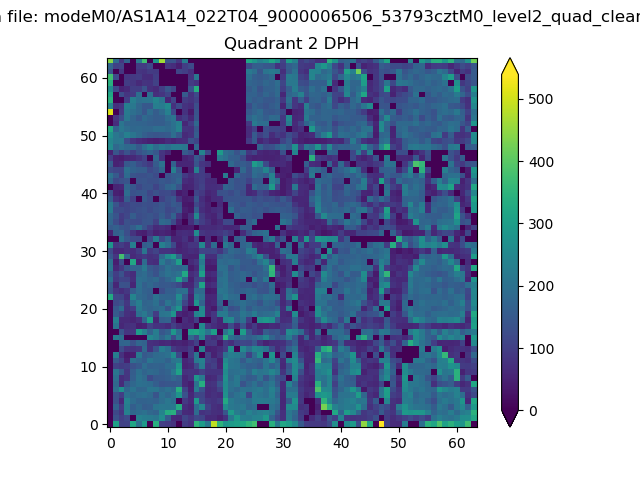 |
Quadrant C |
| Plot type | Count rate plots | Images |
|---|---|---|
| Comparison with Poisson distribution Blue bars denote a histogram of data divided into 1 sec bins. Red curve is a Poisson curve with rate = median count rate of data. |
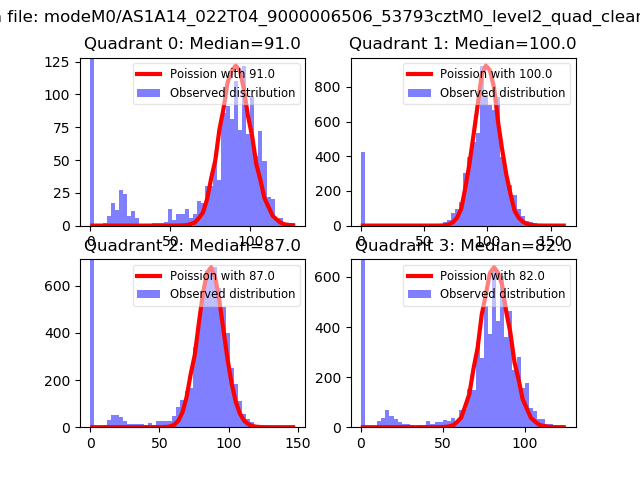 |
 |
| Quadrant-wise count rates Data is divided into 100 sec bins |
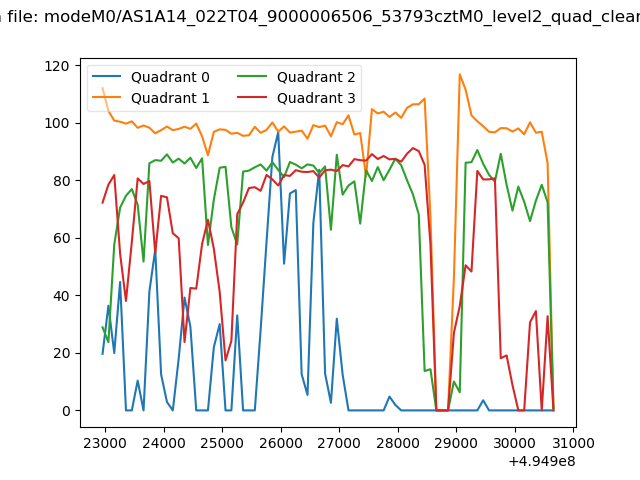 |
|
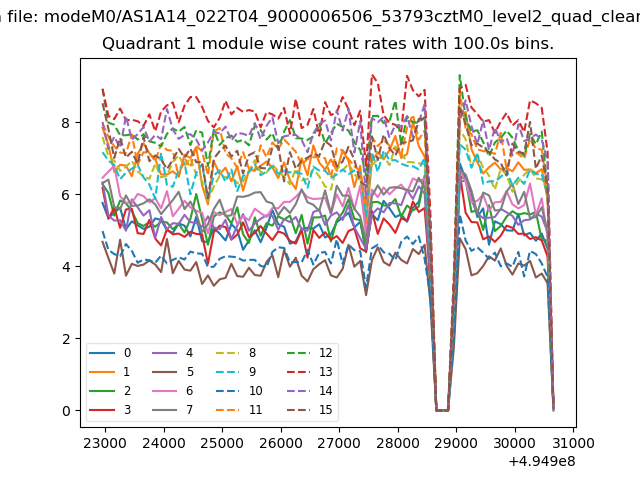
| Module-wise count rates for Quadrant A Data is divided into 100 sec bins |
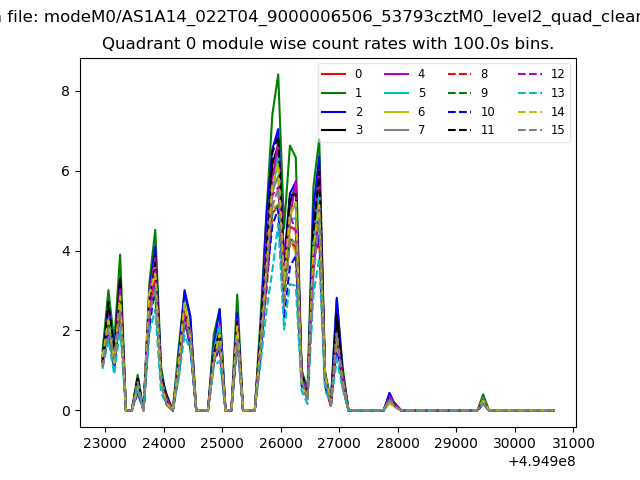 |
 |
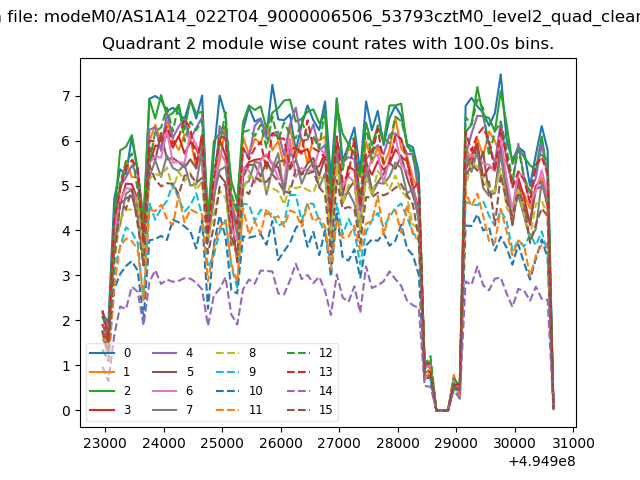
| Module-wise count rates for Quadrant B Data is divided into 100 sec bins |
 |
 |
| Module-wise count rates for Quadrant C Data is divided into 100 sec bins |
 |
 |
| Module-wise count rates for Quadrant D Data is divided into 100 sec bins |
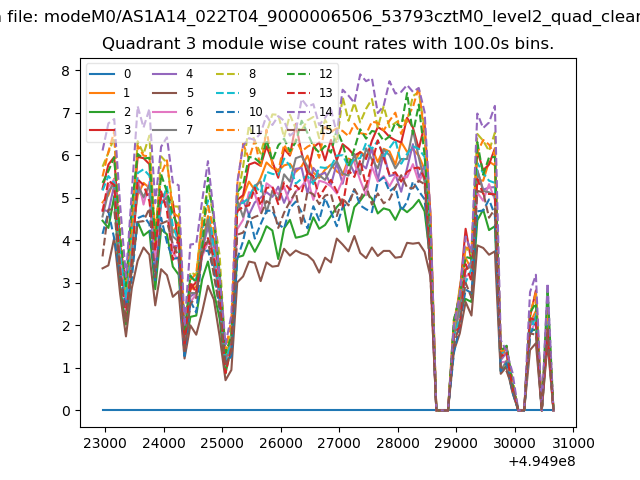 |
 |
| Parameter | Plot |
|---|---|
| CZT HV Monitor | 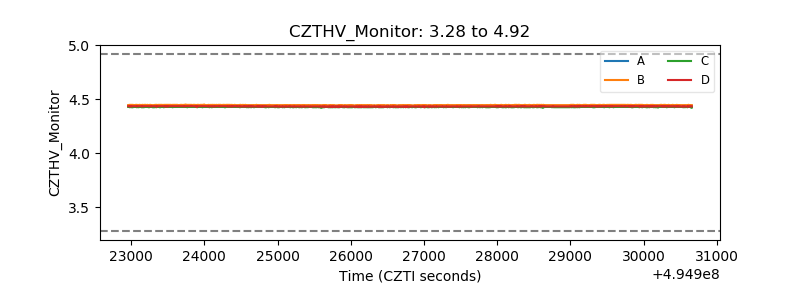 |
| D_VDD | 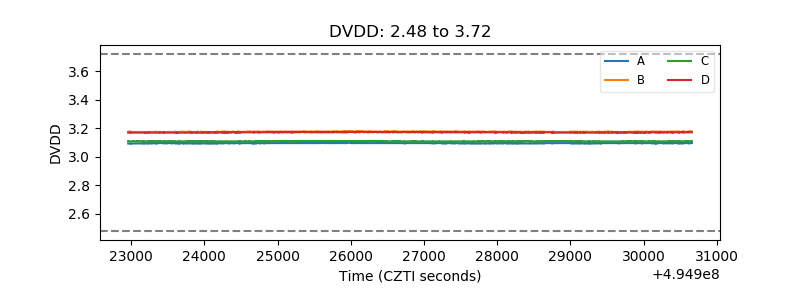 |
| Temperature 1 | 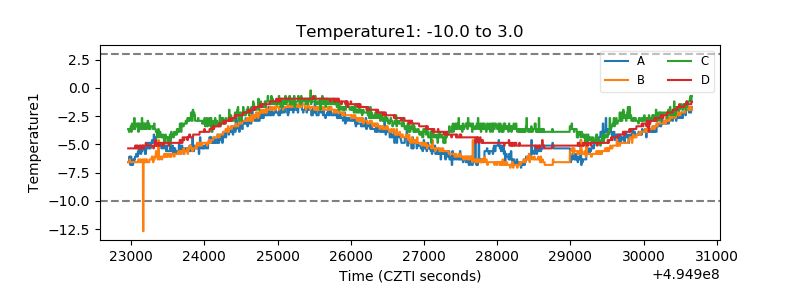 |
| Veto HV Monitor | 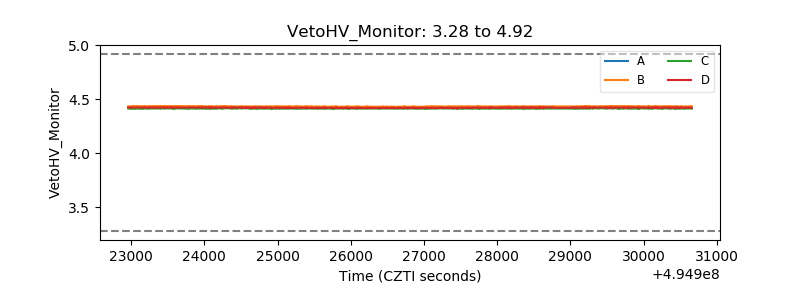 |
| Veto LLD | 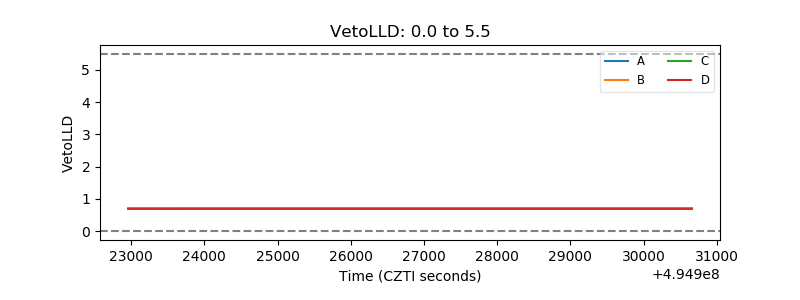 |
| Alpha Counter | 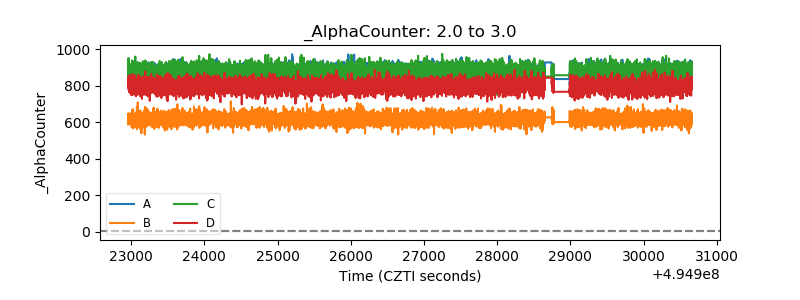 |
| _CPM_Rate | 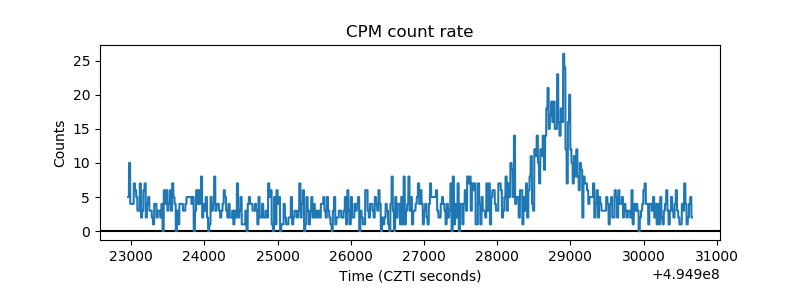 |
| CZT Counter | 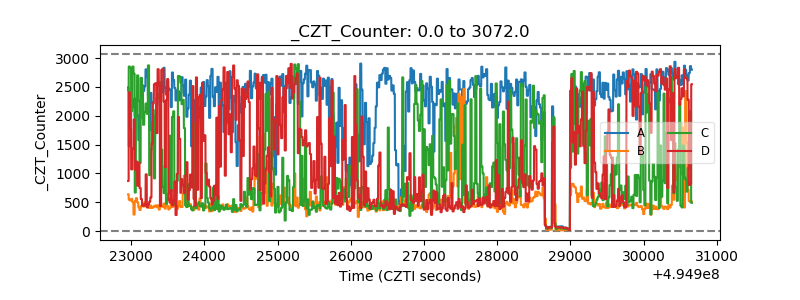 |
| +2.5 Volts monitor |  |
| +5 Volts monitor |  |
| _ROLL_ROT | 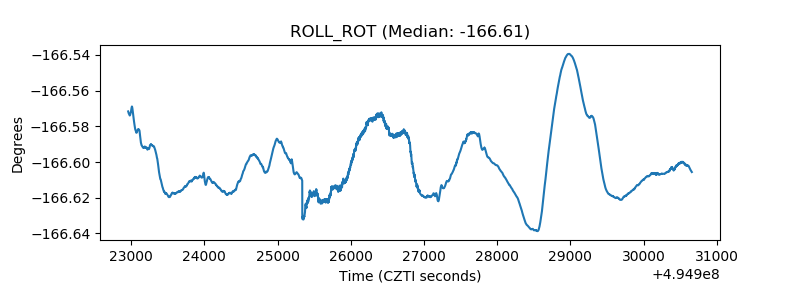 |
| _Roll_DEC | 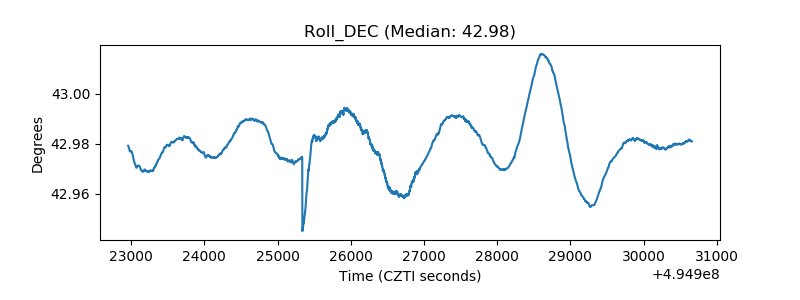 |
| _Roll_RA | 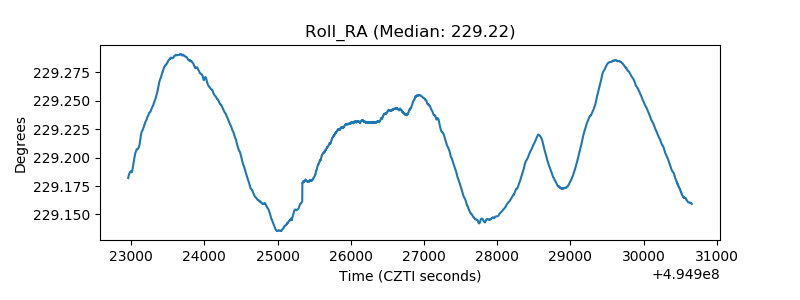 |
| Veto Counter | 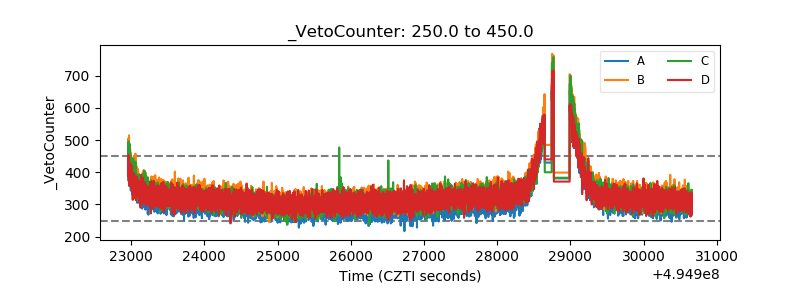 |