| Param | Original file | Final file |
|---|---|---|
| Filename | modeM0/AS1A14_022T04_9000006506_53794cztM0_level2.fits | modeM0/AS1A14_022T04_9000006506_53794cztM0_level2_quad_clean.evt |
| Size (bytes) | 985,343,040 | 73,402,560 |
| Size | 939.7 MB | 70.0 MB |
| Events in quadrant A | 17,597,781 | 30,631 |
| Events in quadrant B | 3,869,575 | 685,753 |
| Events in quadrant C | 5,766,743 | 579,054 |
| Events in quadrant D | 8,701,305 | 441,972 |
| Mode M0 | |||
|---|---|---|---|
| Quadrant | BADHDUFLAG | Total packets | Discarded packets |
| A | 0 | 57084 | 5 |
| B | 0 | 16427 | 0 |
| C | 0 | 22063 | 0 |
| D | 0 | 30696 | 0 |
| Mode SS | |||
|---|---|---|---|
| Quadrant | BADHDUFLAG | Total packets | Discarded packets |
| A | 0 | 140 | 0 |
| B | 0 | 140 | 0 |
| C | 0 | 140 | 0 |
| D | 0 | 140 | 0 |
| Quadrant | Total seconds | Saturated seconds | Saturation percentage |
|---|---|---|---|
| A | 6957 | 6674 | 95.932155% |
| B | 6958 | 149 | 2.141420% |
| C | 6958 | 594 | 8.536936% |
| D | 6958 | 1871 | 26.889911% |
Noise dominated data is calculated using 1-second bins in cleaned event files. If a bin has >2000 counts, and if more than 50% of those come from <1% of pixels, then it is considered to be noise-dominated and hence unusable.
| Quadrant | # 1 sec bins | Bins with >0 counts | Bins with >2000 counts | High rate bins dominated by noise | Noise dominated (total time) | Noise dominated (detector-on time) | Marked lightcurve |
|---|---|---|---|---|---|---|---|
| A | 6957 | 6957 | 6357 | 6357 | 91.38% | 91.38% |  |
| B | 6958 | 6958 | 96 | 96 | 1.38% | 1.38% | 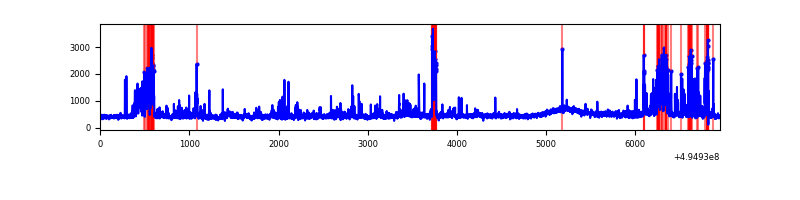 |
| C | 6958 | 6958 | 475 | 475 | 6.83% | 6.83% | 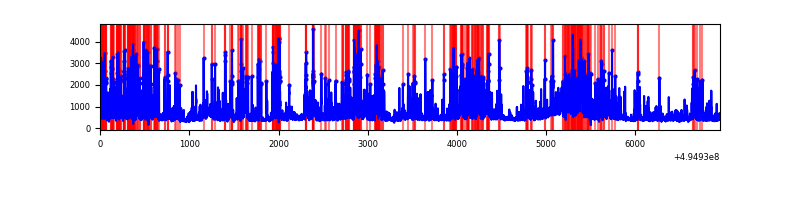 |
| D | 6958 | 6958 | 1584 | 1584 | 22.77% | 22.77% | 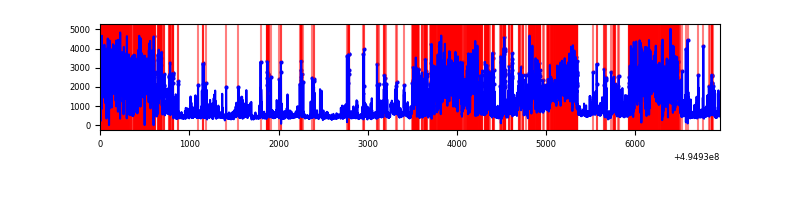 |
Top three noisy pixels from each quadrant. If the there are fewer than three noisy pixels in the level2.evt file, extra rows are filled as -1
| Pixel properties | Quadrant properties | ||||||
|---|---|---|---|---|---|---|---|
| Quadrant | DetID | PixID | Counts | Sigma | Mean | Median | Sigma |
| A | 3 | 63 | 16167107 | 239156.78 | 268 | 261 | 67.6 |
| A | 8 | 249 | 87668 | 1293.02 | 268 | 261 | 67.6 |
| A | 0 | 8 | 84213 | 1241.91 | 268 | 261 | 67.6 |
| B | 8 | 234 | 359112 | 2291.16 | 719 | 694 | 156.4 |
| B | 5 | 185 | 183796 | 1170.47 | 719 | 694 | 156.4 |
| B | 7 | 0 | 149820 | 953.28 | 719 | 694 | 156.4 |
| C | 15 | 224 | 2647761 | 14048.04 | 683 | 679 | 188.4 |
| C | 12 | 2 | 107934 | 569.2 | 683 | 679 | 188.4 |
| C | 15 | 158 | 90161 | 474.88 | 683 | 679 | 188.4 |
| D | 8 | 176 | 4307508 | 24866.34 | 603 | 577 | 173.2 |
| D | 1 | 241 | 1009848 | 5827.09 | 603 | 577 | 173.2 |
| D | 3 | 12 | 246857 | 1421.91 | 603 | 577 | 173.2 |
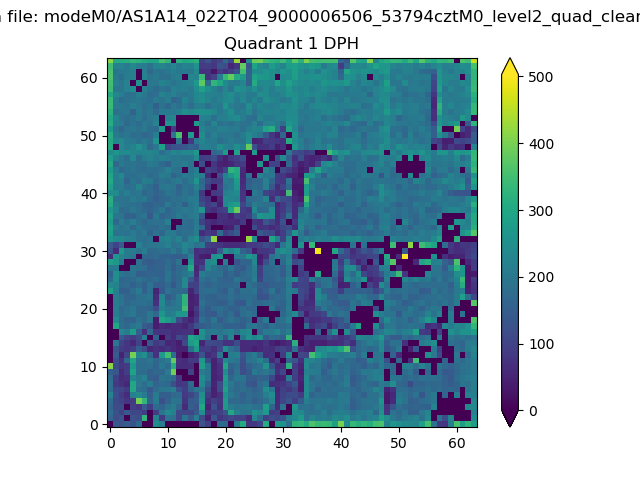
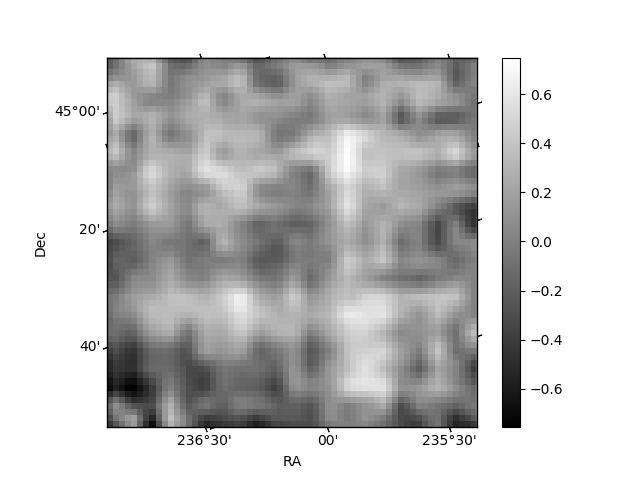
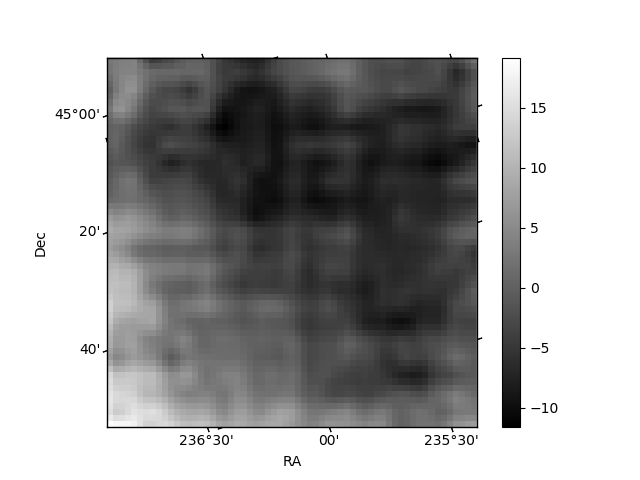
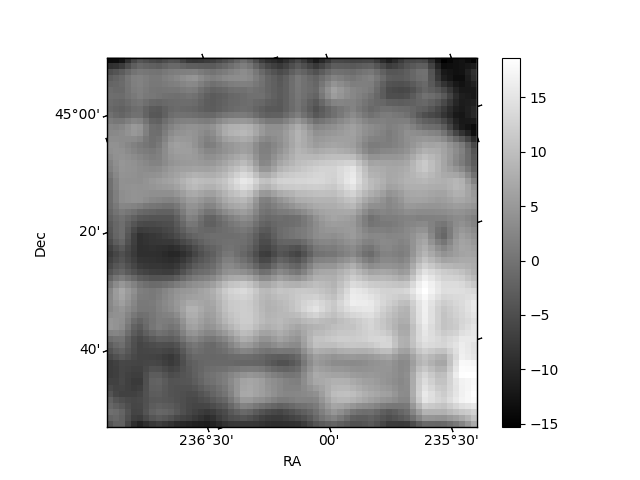
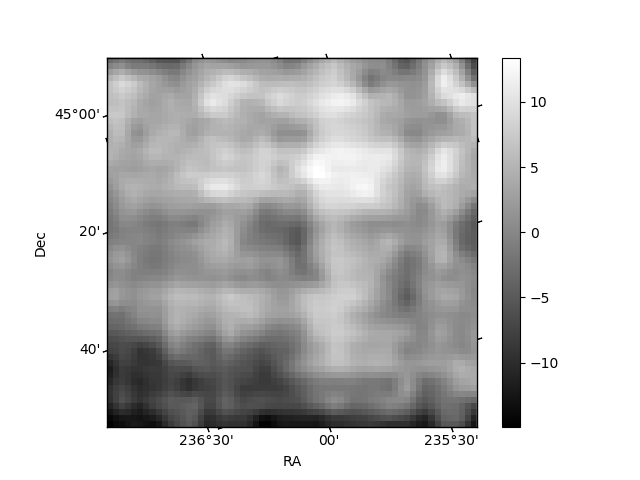
Histogram calculated using DETX and DETY for each event in the final _common_clean file
| Quadrant A | 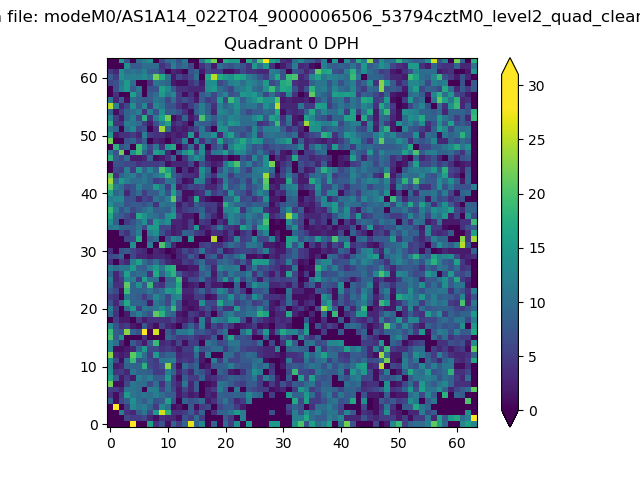 |
 |
Quadrant B |
|---|---|---|---|
| Quadrant D | 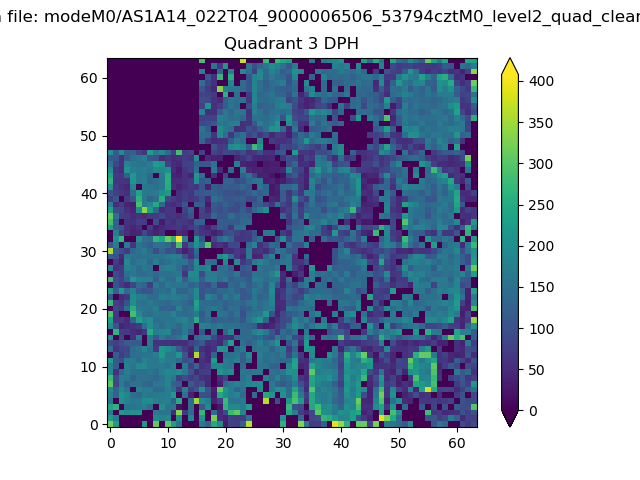 |
 |
Quadrant C |
| Plot type | Count rate plots | Images |
|---|---|---|
| Comparison with Poisson distribution Blue bars denote a histogram of data divided into 1 sec bins. Red curve is a Poisson curve with rate = median count rate of data. |
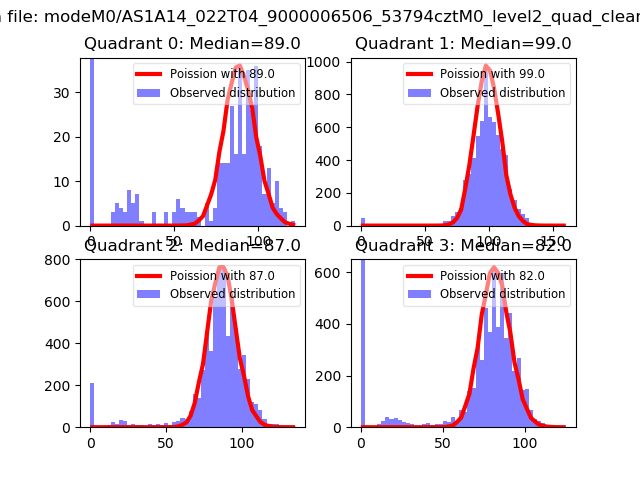 |
 |
| Quadrant-wise count rates Data is divided into 100 sec bins |
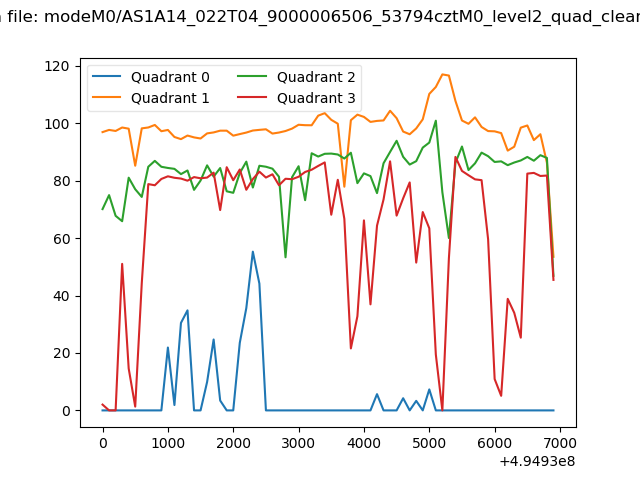 |
|
| Module-wise count rates for Quadrant A Data is divided into 100 sec bins |
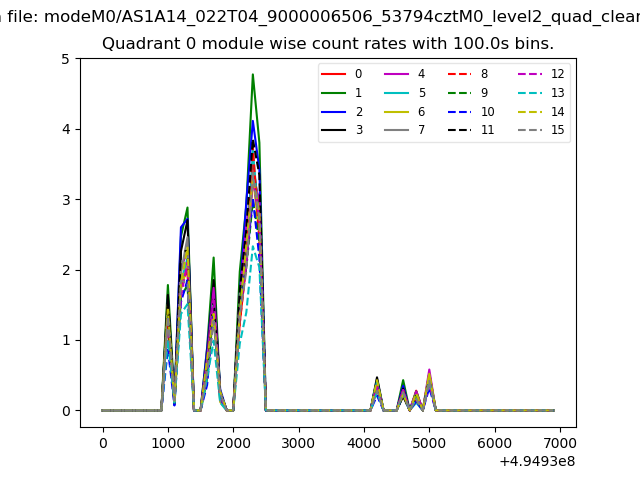 |
 |
| Module-wise count rates for Quadrant B Data is divided into 100 sec bins |
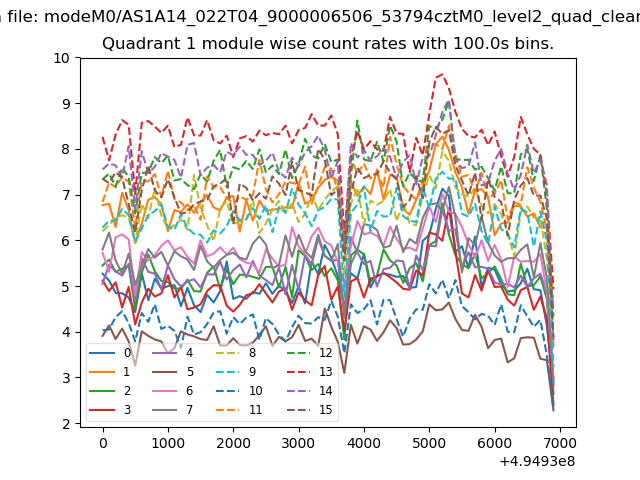 |
 |
| Module-wise count rates for Quadrant C Data is divided into 100 sec bins |
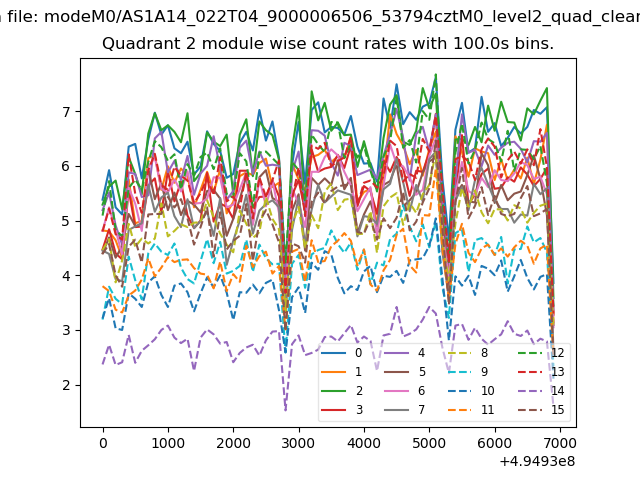 |
 |
| Module-wise count rates for Quadrant D Data is divided into 100 sec bins |
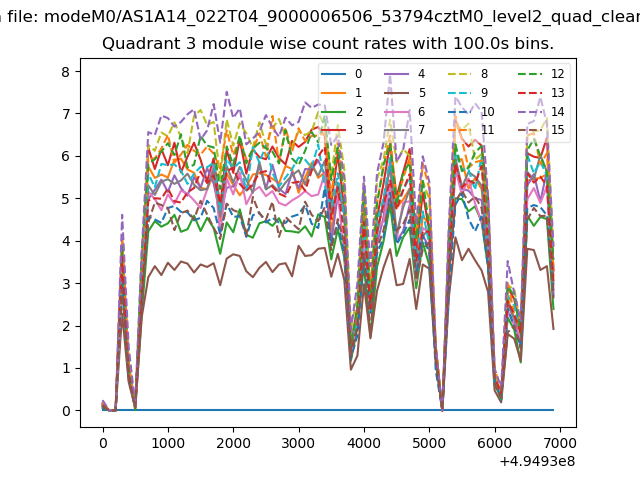 |
 |
| Parameter | Plot |
|---|---|
| CZT HV Monitor | 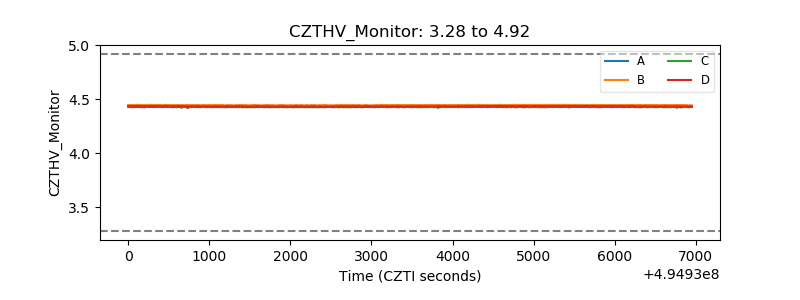 |
| D_VDD | 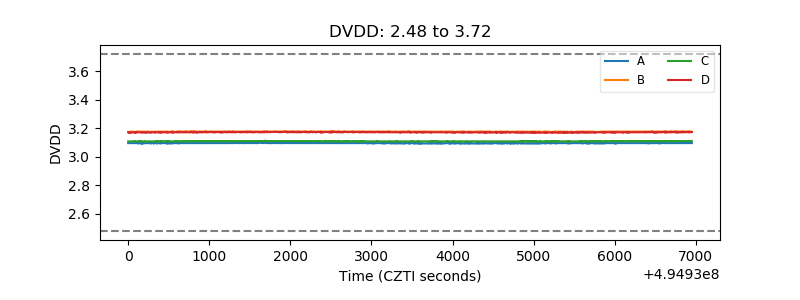 |
| Temperature 1 | 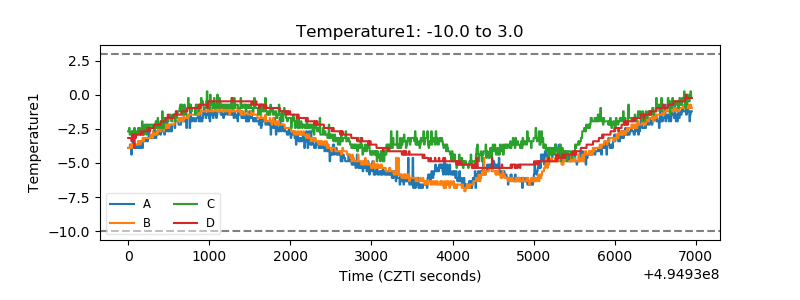 |
| Veto HV Monitor | 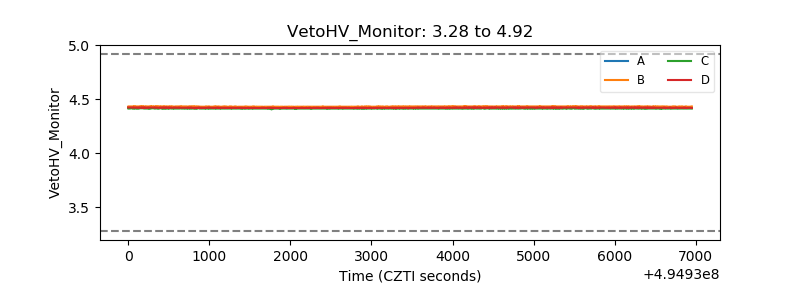 |
| Veto LLD | 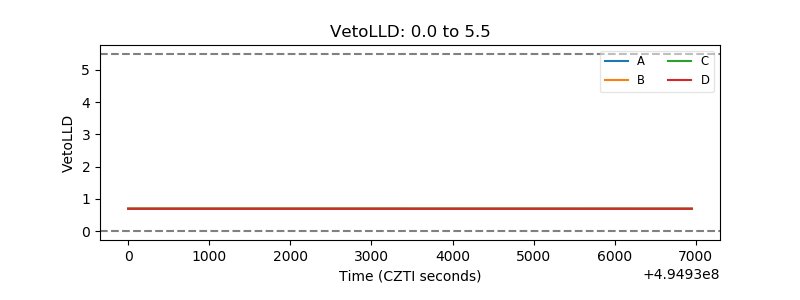 |
| Alpha Counter | 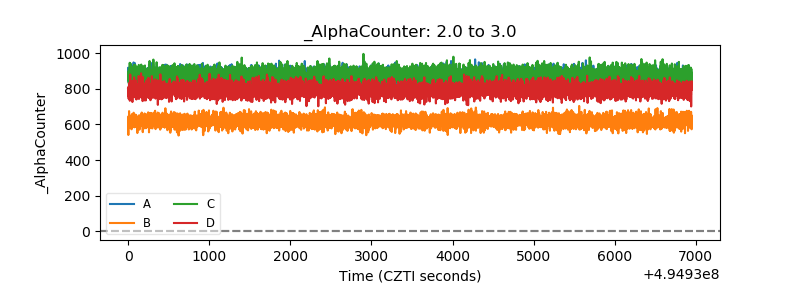 |
| _CPM_Rate | 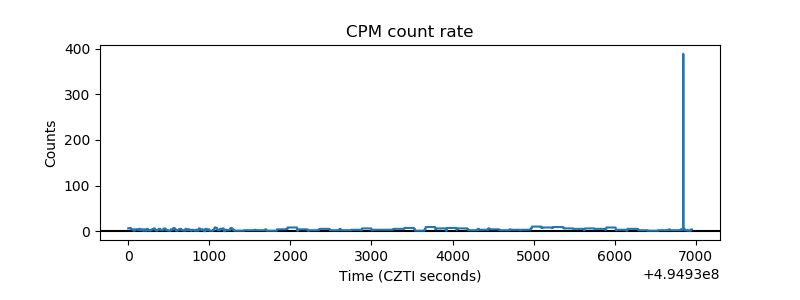 |
| CZT Counter | 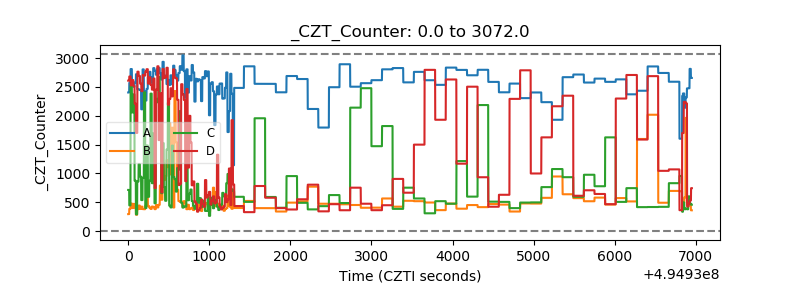 |
| +2.5 Volts monitor |  |
| +5 Volts monitor | 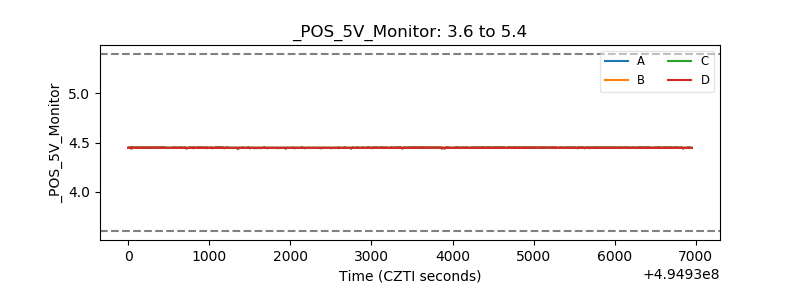 |
| _ROLL_ROT | 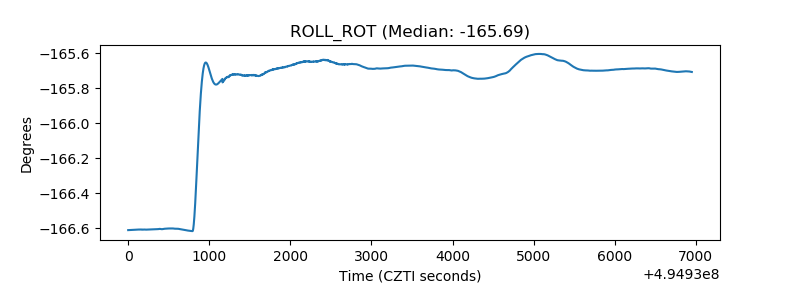 |
| _Roll_DEC | 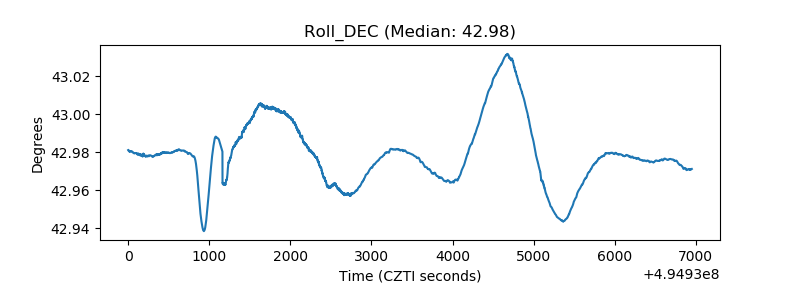 |
| _Roll_RA | 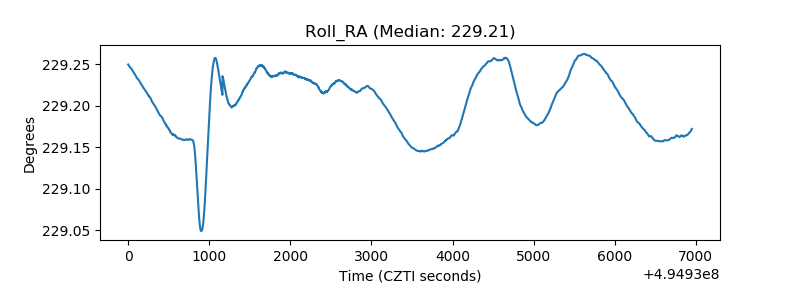 |
| Veto Counter | 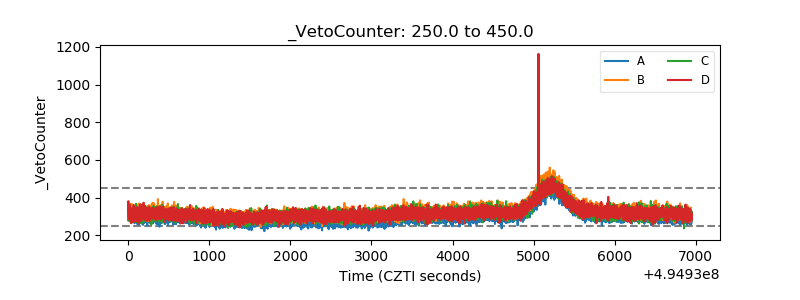 |