| Param | Original file | Final file |
|---|---|---|
| Filename | modeM0/AS1A14_022T04_9000006506_53795cztM0_level2.fits | modeM0/AS1A14_022T04_9000006506_53795cztM0_level2_quad_clean.evt |
| Size (bytes) | 1,098,169,920 | 74,963,520 |
| Size | 1.0 GB | 71.5 MB |
| Events in quadrant A | 17,174,920 | 91,352 |
| Events in quadrant B | 3,977,255 | 714,650 |
| Events in quadrant C | 8,000,070 | 520,622 |
| Events in quadrant D | 10,938,346 | 437,429 |
| Mode M0 | |||
|---|---|---|---|
| Quadrant | BADHDUFLAG | Total packets | Discarded packets |
| A | 0 | 56031 | 12 |
| B | 0 | 16970 | 0 |
| C | 0 | 28850 | 0 |
| D | 0 | 37517 | 0 |
| Mode SS | |||
|---|---|---|---|
| Quadrant | BADHDUFLAG | Total packets | Discarded packets |
| A | 0 | 146 | 0 |
| B | 0 | 146 | 0 |
| C | 0 | 146 | 0 |
| D | 0 | 146 | 0 |
| Quadrant | Total seconds | Saturated seconds | Saturation percentage |
|---|---|---|---|
| A | 7252 | 6397 | 88.210149% |
| B | 7253 | 114 | 1.571763% |
| C | 7254 | 1541 | 21.243452% |
| D | 7254 | 2365 | 32.602702% |
Noise dominated data is calculated using 1-second bins in cleaned event files. If a bin has >2000 counts, and if more than 50% of those come from <1% of pixels, then it is considered to be noise-dominated and hence unusable.
| Quadrant | # 1 sec bins | Bins with >0 counts | Bins with >2000 counts | High rate bins dominated by noise | Noise dominated (total time) | Noise dominated (detector-on time) | Marked lightcurve |
|---|---|---|---|---|---|---|---|
| A | 7252 | 7251 | 5879 | 5879 | 81.07% | 81.08% | 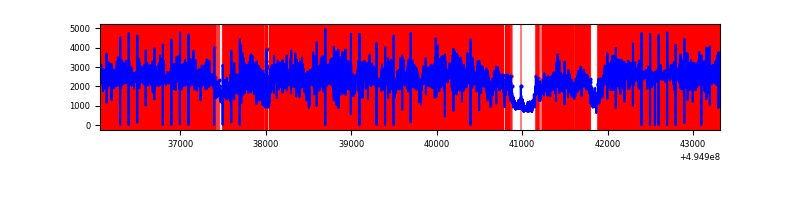 |
| B | 7253 | 7253 | 76 | 76 | 1.05% | 1.05% | 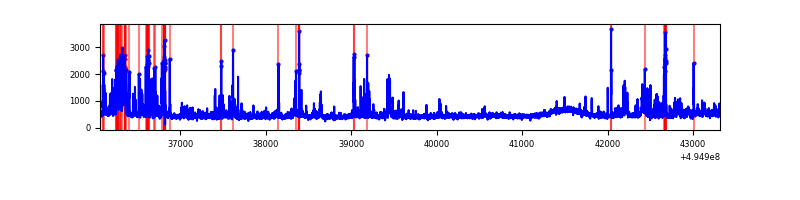 |
| C | 7254 | 7254 | 1040 | 1040 | 14.34% | 14.34% | 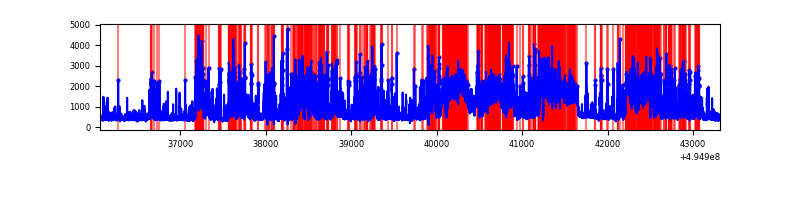 |
| D | 7254 | 7254 | 2044 | 2044 | 28.18% | 28.18% | 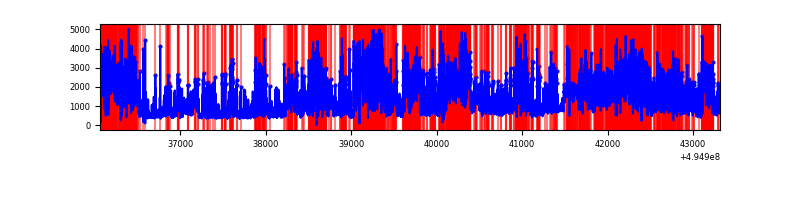 |
Top three noisy pixels from each quadrant. If the there are fewer than three noisy pixels in the level2.evt file, extra rows are filled as -1
| Pixel properties | Quadrant properties | ||||||
|---|---|---|---|---|---|---|---|
| Quadrant | DetID | PixID | Counts | Sigma | Mean | Median | Sigma |
| A | 3 | 63 | 15122895 | 168747.94 | 356 | 348 | 89.6 |
| A | 3 | 78 | 360869 | 4022.95 | 356 | 348 | 89.6 |
| A | 8 | 249 | 152705 | 1700.11 | 356 | 348 | 89.6 |
| B | 8 | 234 | 217764 | 1333.41 | 748 | 720 | 162.8 |
| B | 7 | 0 | 187359 | 1146.62 | 748 | 720 | 162.8 |
| B | 5 | 185 | 169827 | 1038.91 | 748 | 720 | 162.8 |
| C | 15 | 224 | 3037330 | 16163.92 | 679 | 674 | 187.9 |
| C | 15 | 158 | 1793624 | 9543.75 | 679 | 674 | 187.9 |
| C | 12 | 2 | 133241 | 705.65 | 679 | 674 | 187.9 |
| D | 8 | 176 | 2751949 | 15297.32 | 630 | 603 | 179.9 |
| D | 1 | 241 | 2262805 | 12577.71 | 630 | 603 | 179.9 |
| D | 2 | 172 | 1078453 | 5992.78 | 630 | 603 | 179.9 |
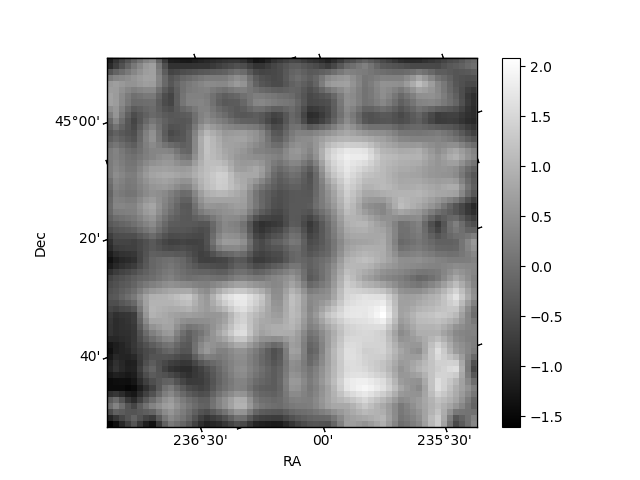
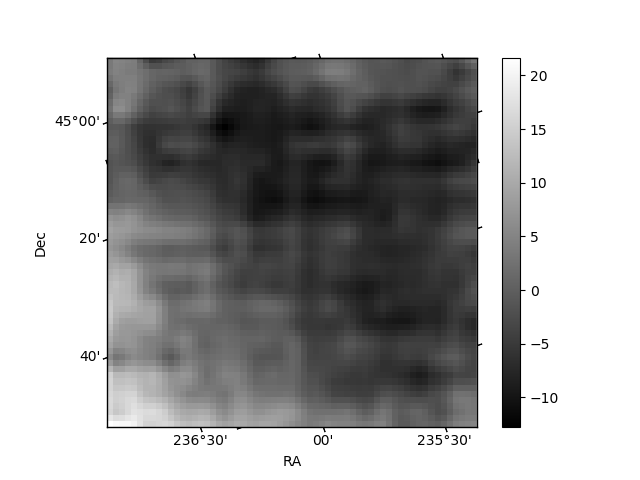
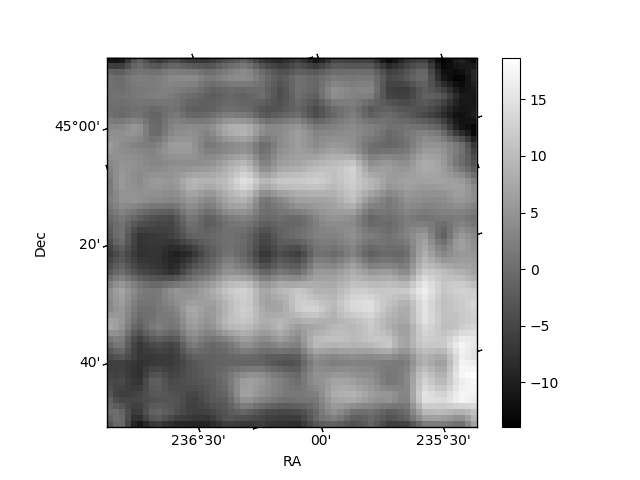
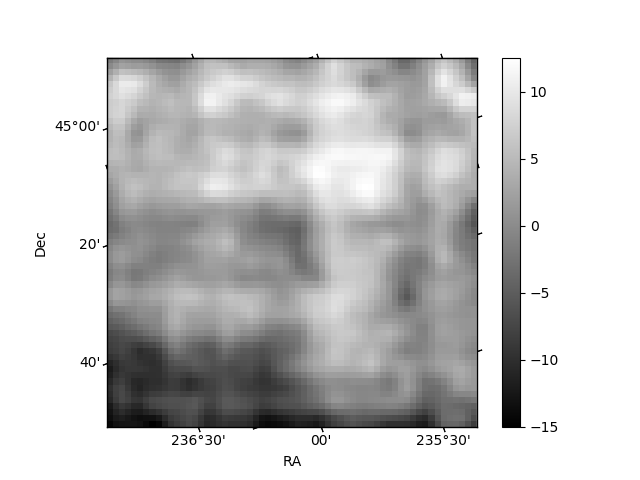
Histogram calculated using DETX and DETY for each event in the final _common_clean file
| Quadrant A | 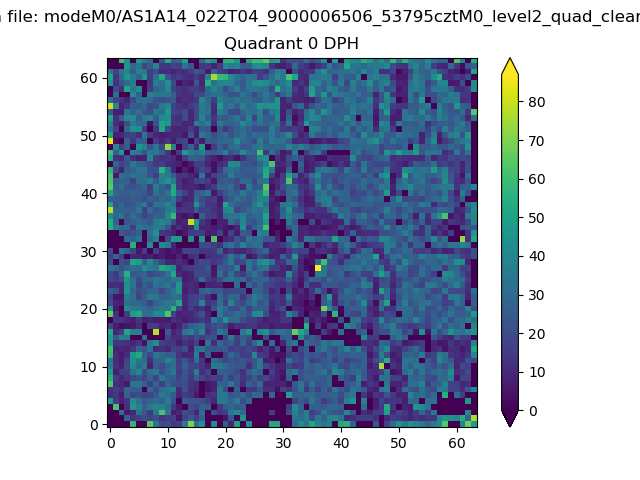 |
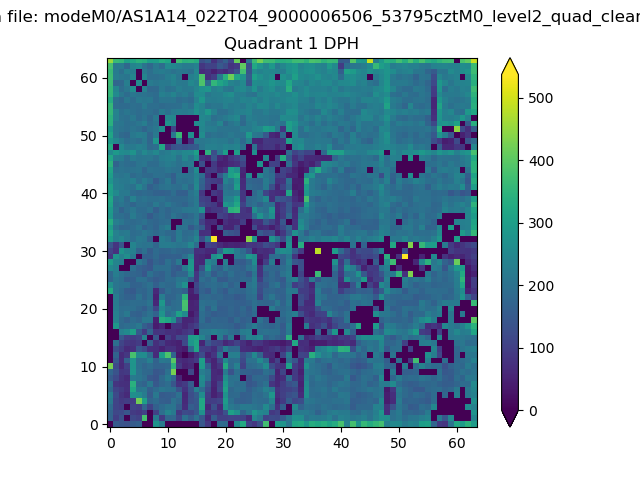 |
Quadrant B |
|---|---|---|---|
| Quadrant D | 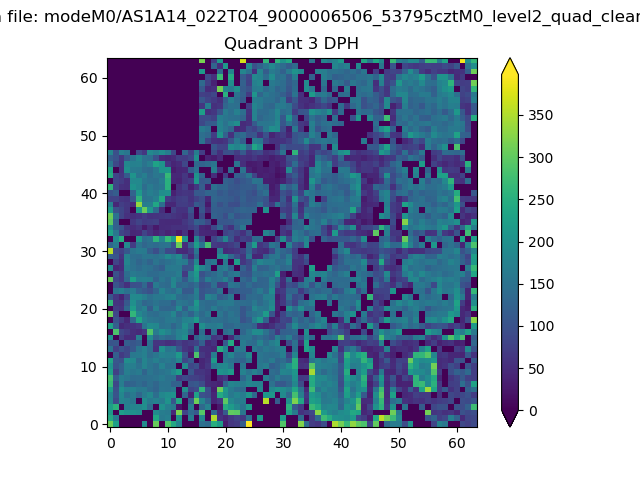 |
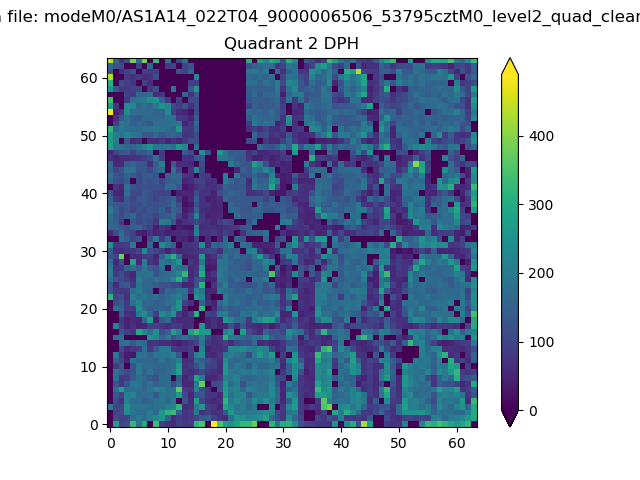 |
Quadrant C |
| Plot type | Count rate plots | Images |
|---|---|---|
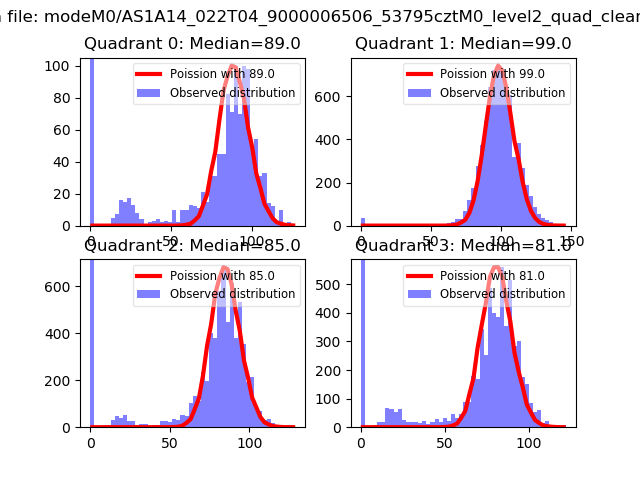
| Comparison with Poisson distribution Blue bars denote a histogram of data divided into 1 sec bins. Red curve is a Poisson curve with rate = median count rate of data. |
 |
 |
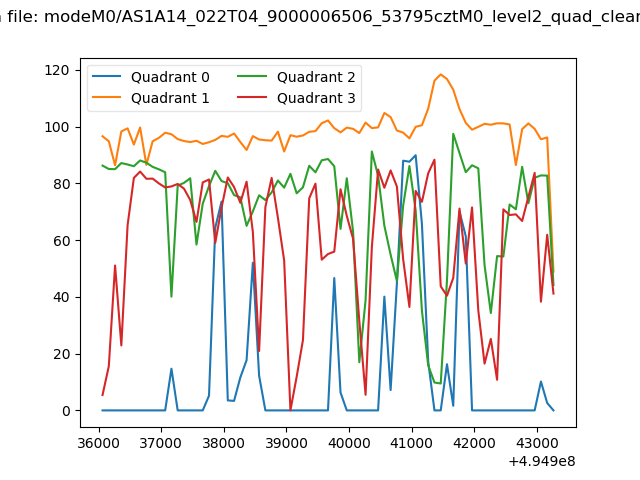
| Quadrant-wise count rates Data is divided into 100 sec bins |
 |
|
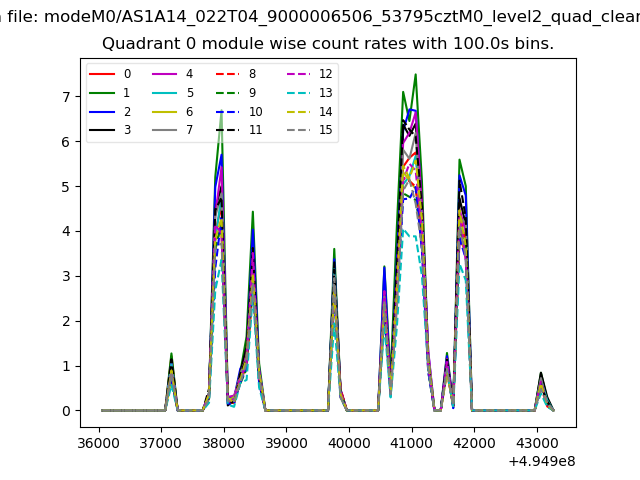
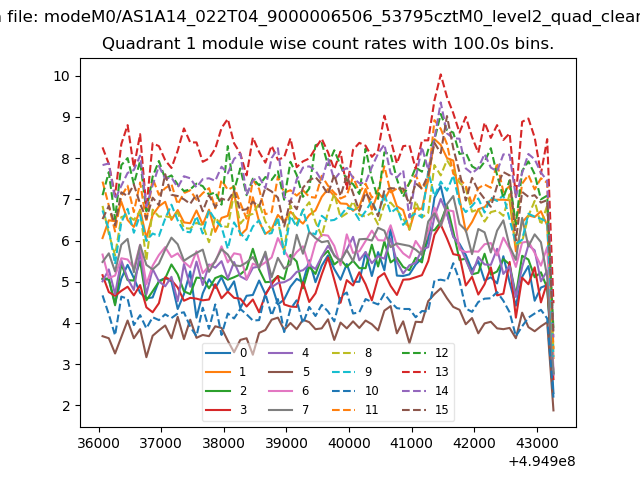
| Module-wise count rates for Quadrant A Data is divided into 100 sec bins |
 |
 |
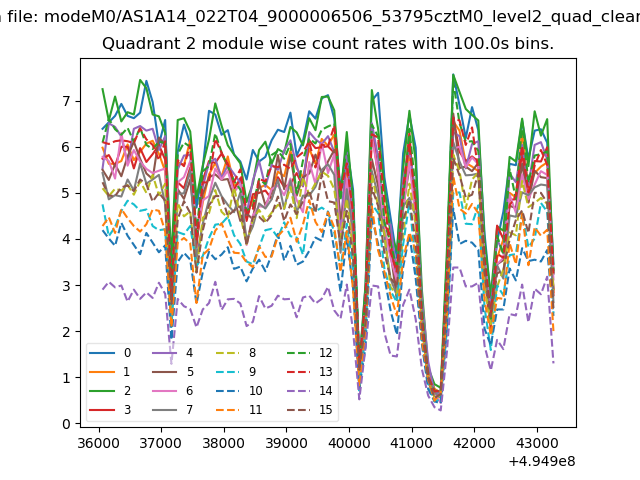
| Module-wise count rates for Quadrant B Data is divided into 100 sec bins |
 |
 |
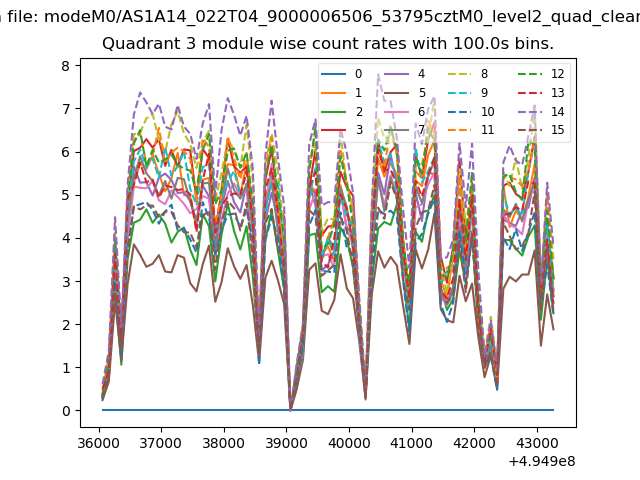
| Module-wise count rates for Quadrant C Data is divided into 100 sec bins |
 |
 |
| Module-wise count rates for Quadrant D Data is divided into 100 sec bins |
 |
 |
| Parameter | Plot |
|---|---|
| CZT HV Monitor | 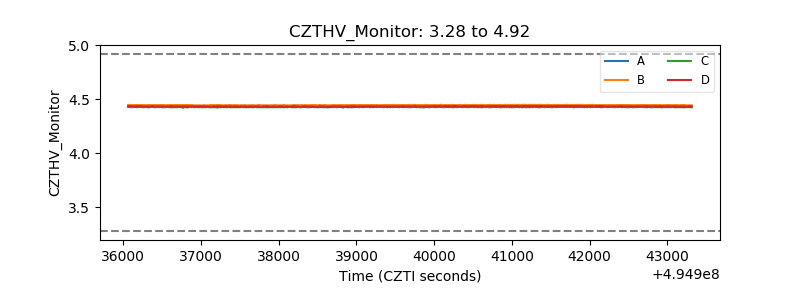 |
| D_VDD | 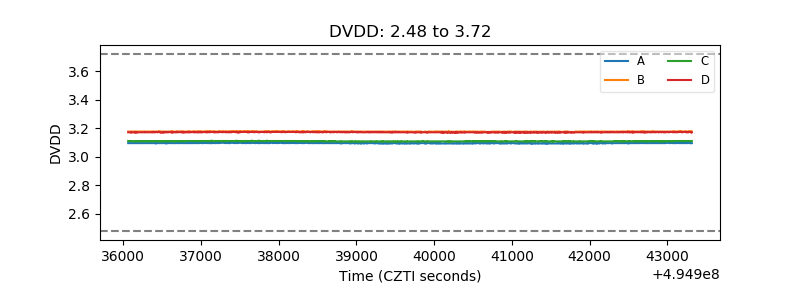 |
| Temperature 1 | 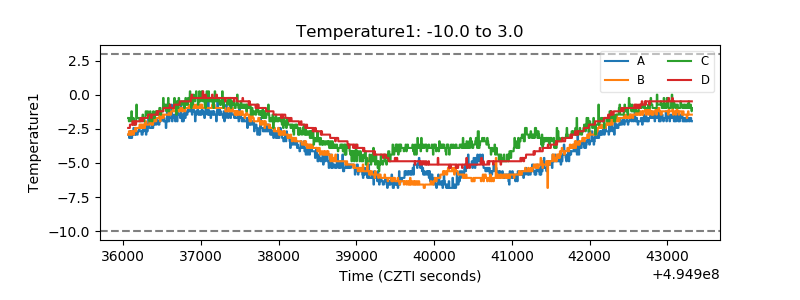 |
| Veto HV Monitor | 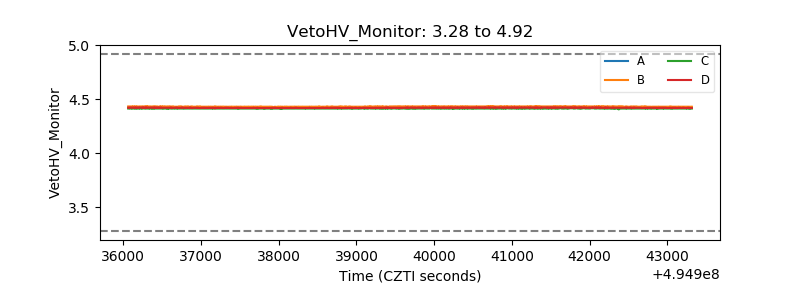 |
| Veto LLD | 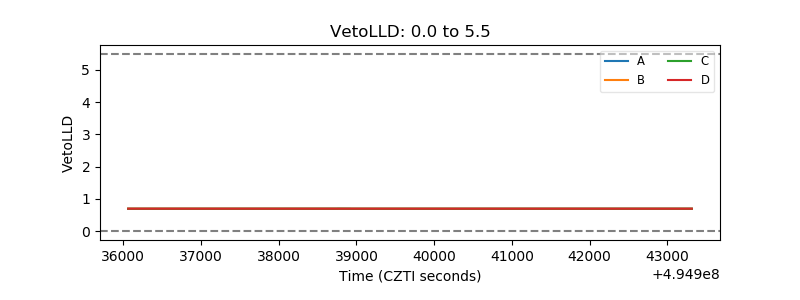 |
| Alpha Counter | 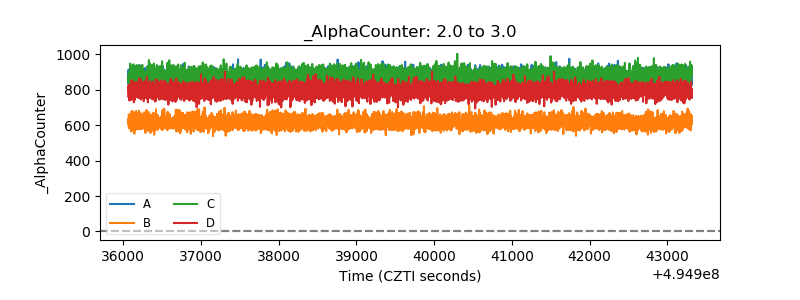 |
| _CPM_Rate | 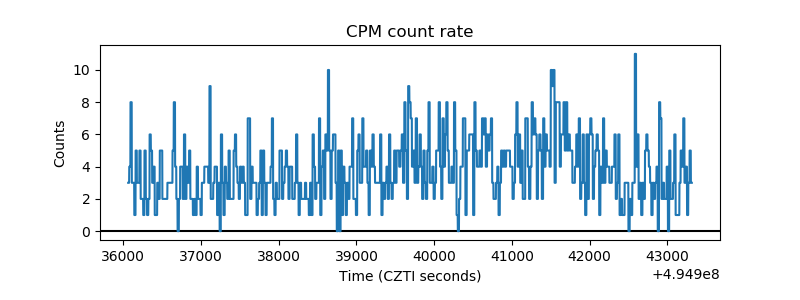 |
| CZT Counter | 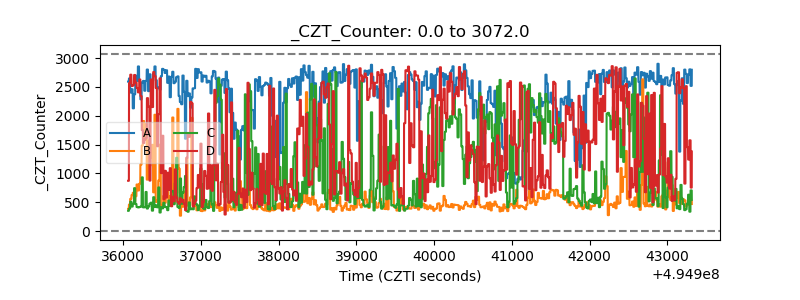 |
| +2.5 Volts monitor | 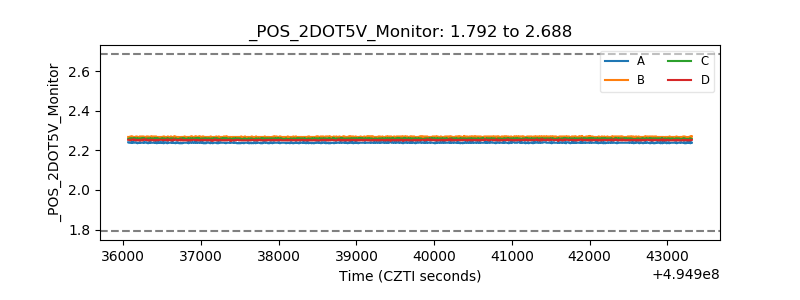 |
| +5 Volts monitor | 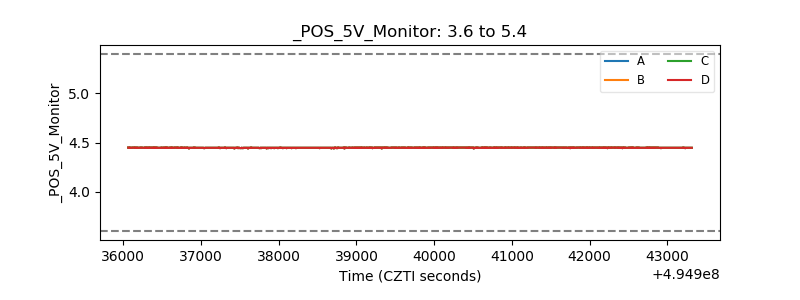 |
| _ROLL_ROT | 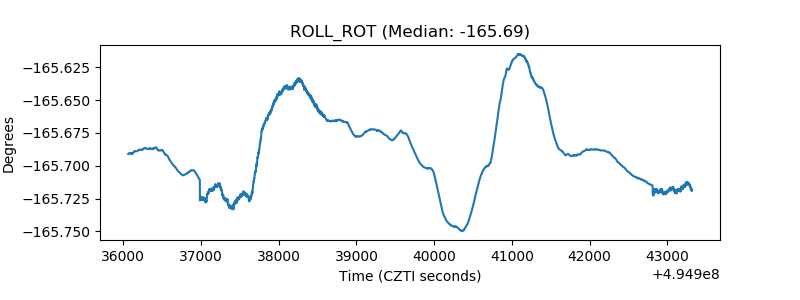 |
| _Roll_DEC | 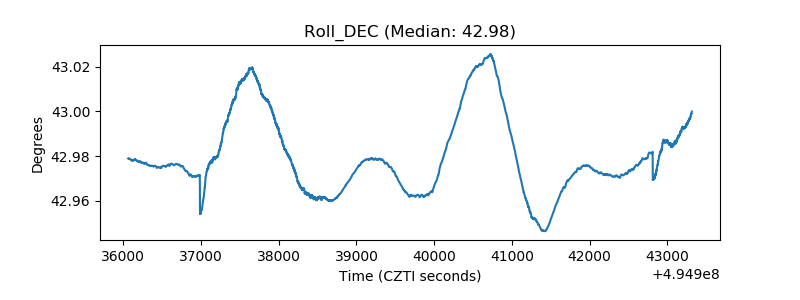 |
| _Roll_RA | 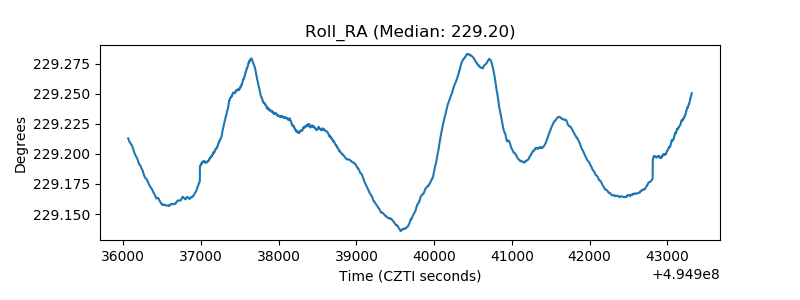 |
| Veto Counter | 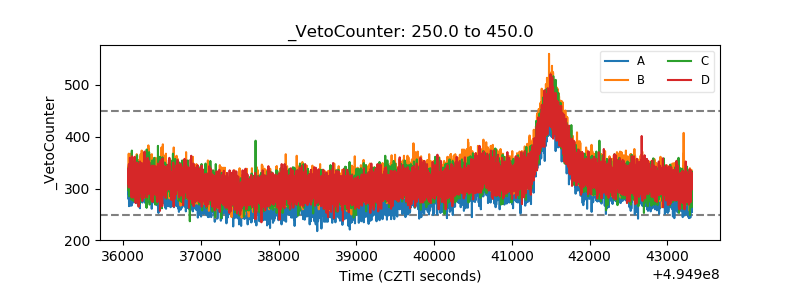 |