| Param | Original file | Final file |
|---|---|---|
| Filename | modeM0/AS1A14_022T04_9000006506_53798cztM0_level2.fits | modeM0/AS1A14_022T04_9000006506_53798cztM0_level2_quad_clean.evt |
| Size (bytes) | 685,903,680 | 53,133,120 |
| Size | 654.1 MB | 50.7 MB |
| Events in quadrant A | 12,150,015 | 39,927 |
| Events in quadrant B | 2,535,209 | 474,117 |
| Events in quadrant C | 4,750,290 | 379,809 |
| Events in quadrant D | 5,577,642 | 373,629 |
| Mode M0 | |||
|---|---|---|---|
| Quadrant | BADHDUFLAG | Total packets | Discarded packets |
| A | 0 | 39490 | 0 |
| B | 0 | 10777 | 0 |
| C | 0 | 17514 | 2 |
| D | 0 | 20005 | 0 |
| Mode SS | |||
|---|---|---|---|
| Quadrant | BADHDUFLAG | Total packets | Discarded packets |
| A | 0 | 98 | 0 |
| B | 0 | 98 | 0 |
| C | 0 | 98 | 0 |
| D | 0 | 98 | 0 |
| Quadrant | Total seconds | Saturated seconds | Saturation percentage |
|---|---|---|---|
| A | 4858 | 4506 | 92.754220% |
| B | 4858 | 19 | 0.391107% |
| C | 4858 | 642 | 13.215315% |
| D | 4858 | 535 | 11.012762% |
Noise dominated data is calculated using 1-second bins in cleaned event files. If a bin has >2000 counts, and if more than 50% of those come from <1% of pixels, then it is considered to be noise-dominated and hence unusable.
| Quadrant | # 1 sec bins | Bins with >0 counts | Bins with >2000 counts | High rate bins dominated by noise | Noise dominated (total time) | Noise dominated (detector-on time) | Marked lightcurve |
|---|---|---|---|---|---|---|---|
| A | 4858 | 4858 | 4252 | 4252 | 87.53% | 87.53% | 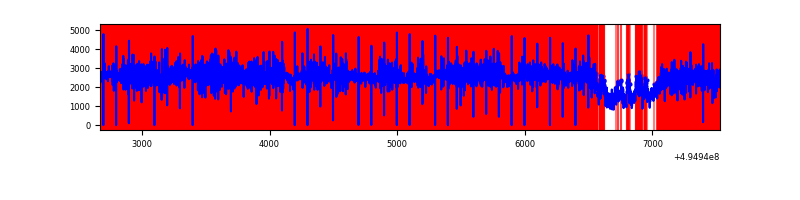 |
| B | 4858 | 4858 | 10 | 10 | 0.21% | 0.21% | 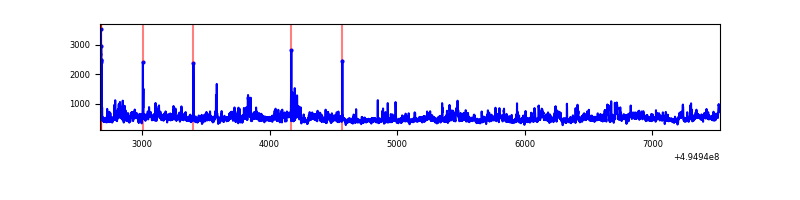 |
| C | 4857 | 4857 | 545 | 545 | 11.22% | 11.22% | 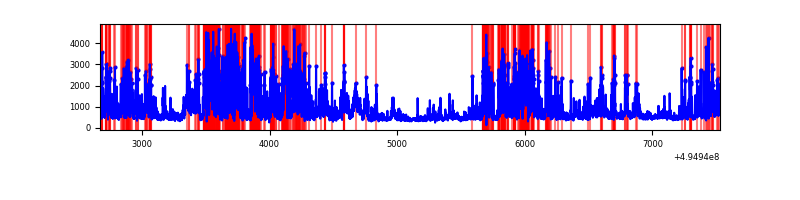 |
| D | 4858 | 4858 | 564 | 564 | 11.61% | 11.61% | 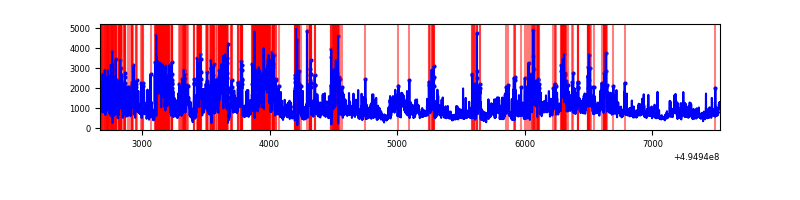 |
Top three noisy pixels from each quadrant. If the there are fewer than three noisy pixels in the level2.evt file, extra rows are filled as -1
| Pixel properties | Quadrant properties | ||||||
|---|---|---|---|---|---|---|---|
| Quadrant | DetID | PixID | Counts | Sigma | Mean | Median | Sigma |
| A | 3 | 63 | 10949462 | 225605.7 | 187 | 182 | 48.5 |
| A | 3 | 78 | 211220 | 4348.36 | 187 | 182 | 48.5 |
| A | 0 | 8 | 145099 | 2985.96 | 187 | 182 | 48.5 |
| B | 7 | 0 | 439295 | 4151.58 | 484 | 468 | 105.7 |
| B | 0 | 213 | 45536 | 426.37 | 484 | 468 | 105.7 |
| B | 5 | 172 | 42271 | 395.48 | 484 | 468 | 105.7 |
| C | 15 | 224 | 2440118 | 19408.78 | 450 | 446 | 125.7 |
| C | 15 | 158 | 147806 | 1172.32 | 450 | 446 | 125.7 |
| C | 1 | 241 | 119406 | 946.39 | 450 | 446 | 125.7 |
| D | 1 | 241 | 900088 | 6806.64 | 458 | 437 | 132.2 |
| D | 10 | 172 | 859127 | 6496.74 | 458 | 437 | 132.2 |
| D | 11 | 245 | 582686 | 4405.22 | 458 | 437 | 132.2 |
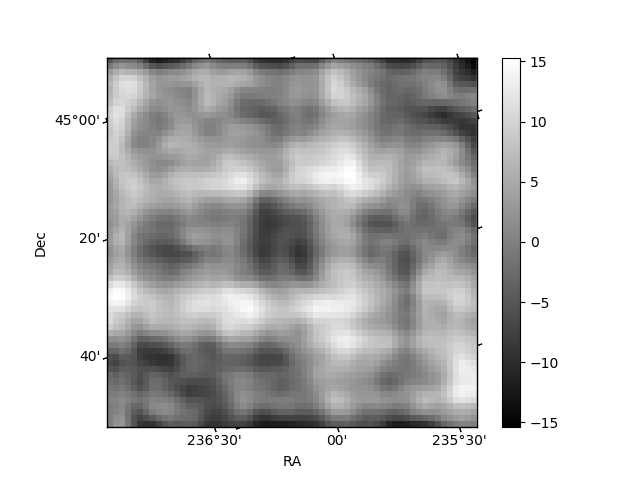
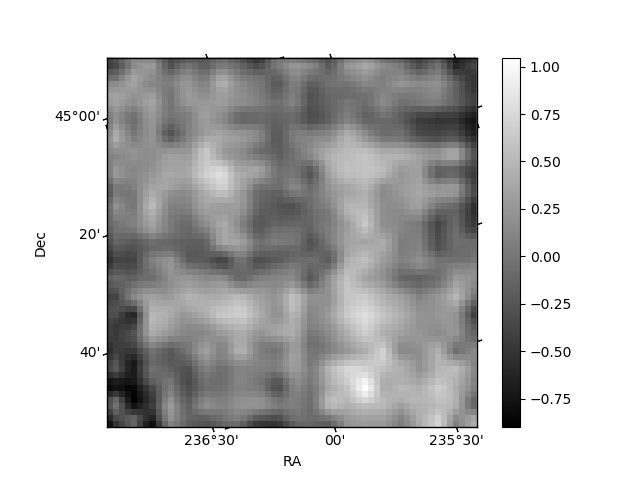
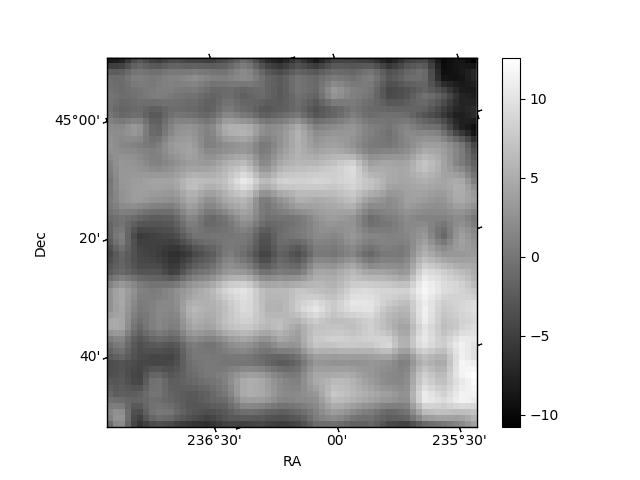
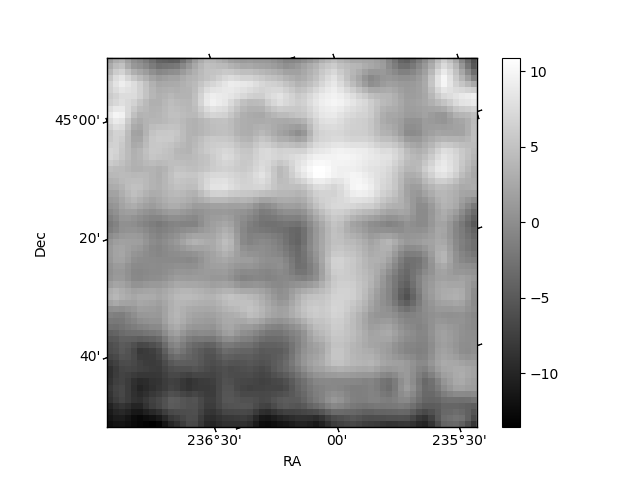
Histogram calculated using DETX and DETY for each event in the final _common_clean file
| Quadrant A | 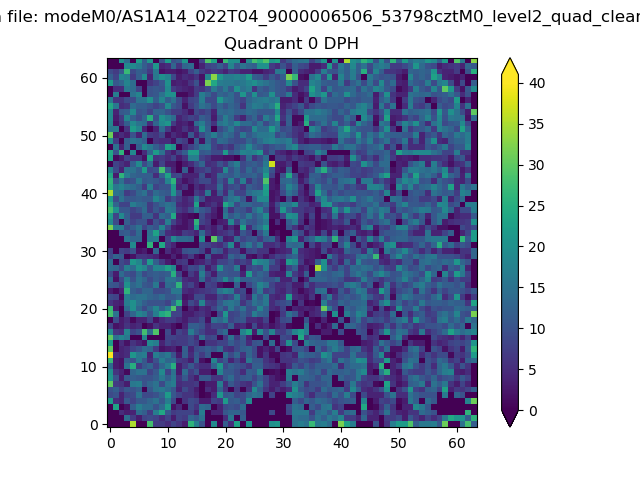 |
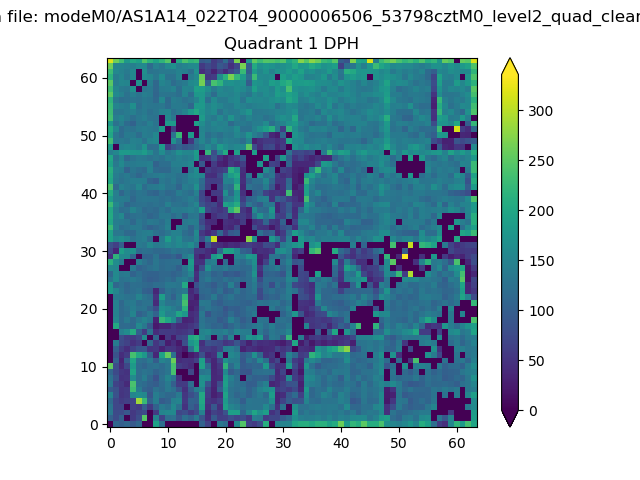 |
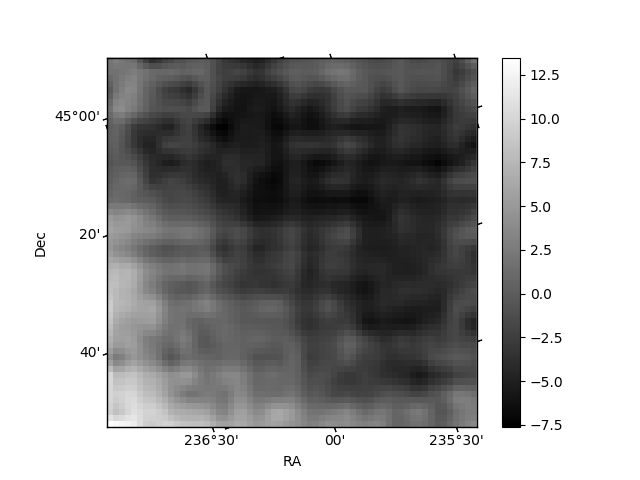
Quadrant B |
|---|---|---|---|
| Quadrant D | 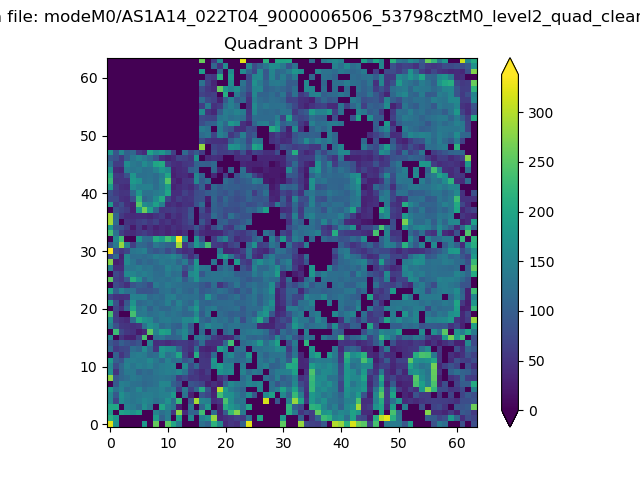 |
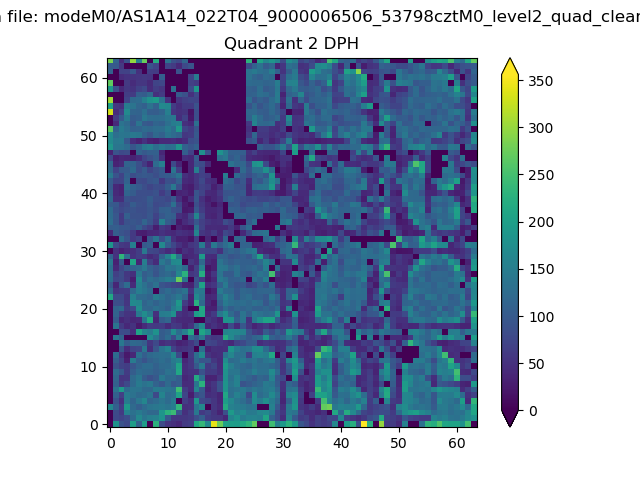 |
Quadrant C |
| Plot type | Count rate plots | Images |
|---|---|---|
| Comparison with Poisson distribution Blue bars denote a histogram of data divided into 1 sec bins. Red curve is a Poisson curve with rate = median count rate of data. |
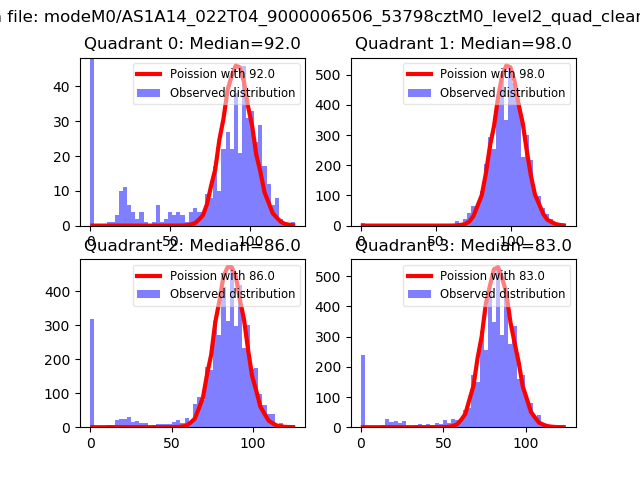 |
 |
| Quadrant-wise count rates Data is divided into 100 sec bins |
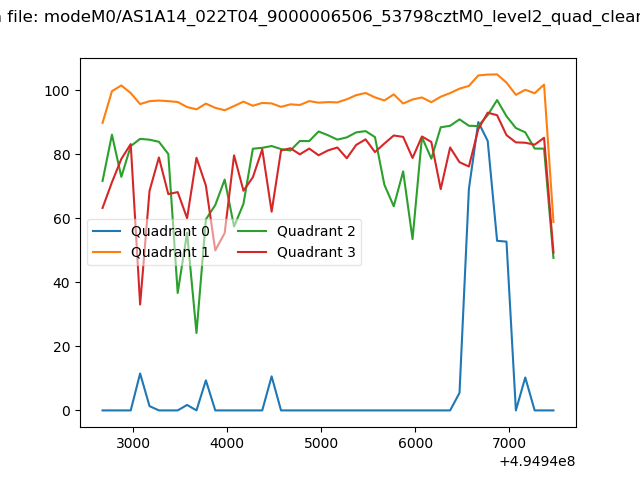 |
|
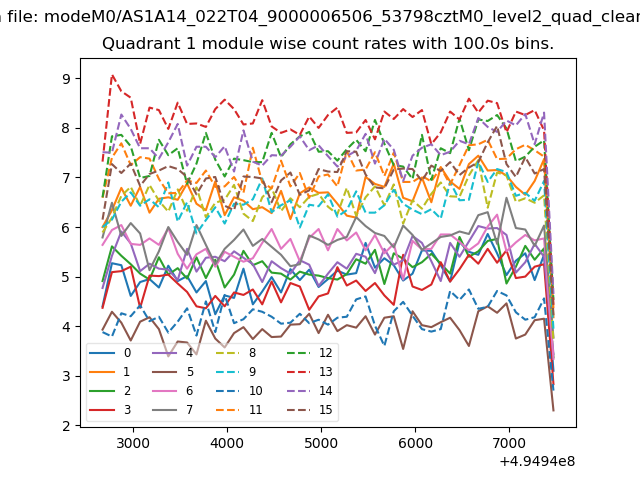
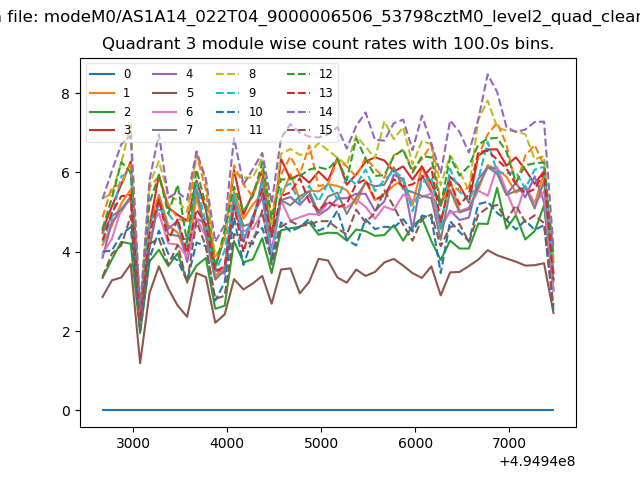
| Module-wise count rates for Quadrant A Data is divided into 100 sec bins |
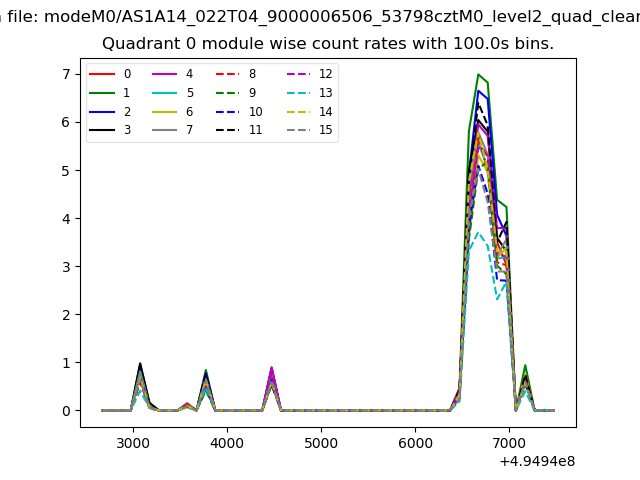 |
 |
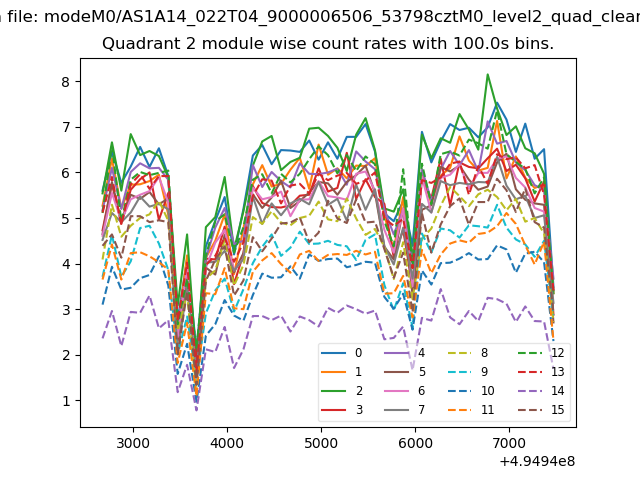
| Module-wise count rates for Quadrant B Data is divided into 100 sec bins |
 |
 |
| Module-wise count rates for Quadrant C Data is divided into 100 sec bins |
 |
 |
| Module-wise count rates for Quadrant D Data is divided into 100 sec bins |
 |
 |
| Parameter | Plot |
|---|---|
| CZT HV Monitor | 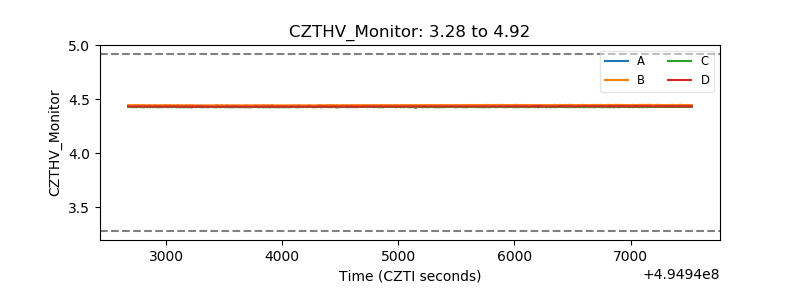 |
| D_VDD | 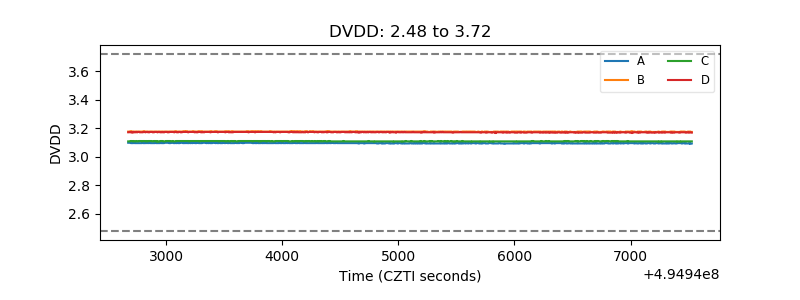 |
| Temperature 1 | 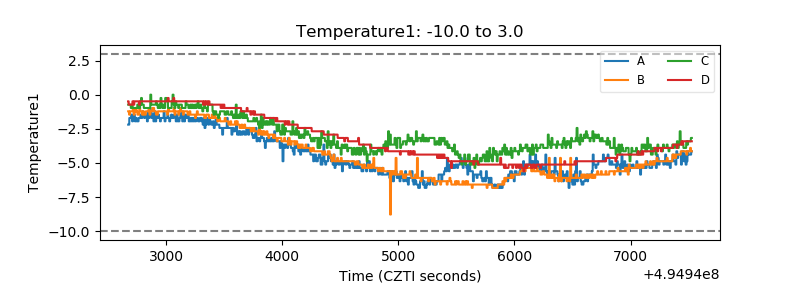 |
| Veto HV Monitor | 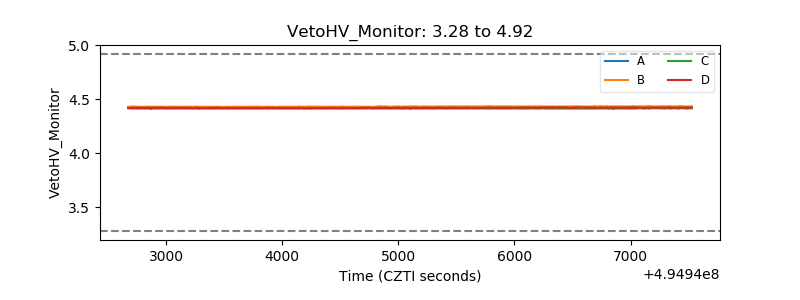 |
| Veto LLD | 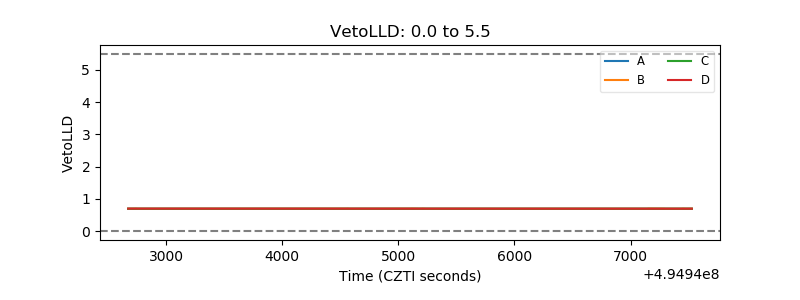 |
| Alpha Counter | 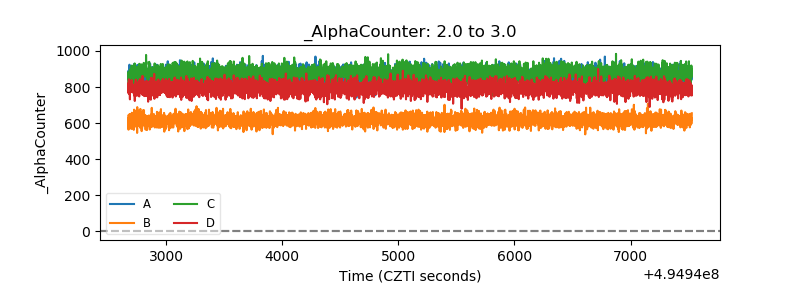 |
| _CPM_Rate | 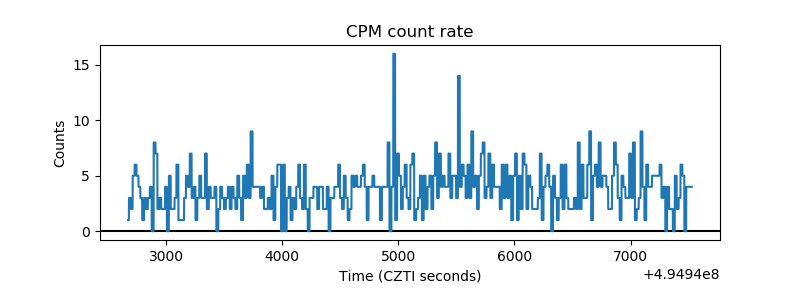 |
| CZT Counter | 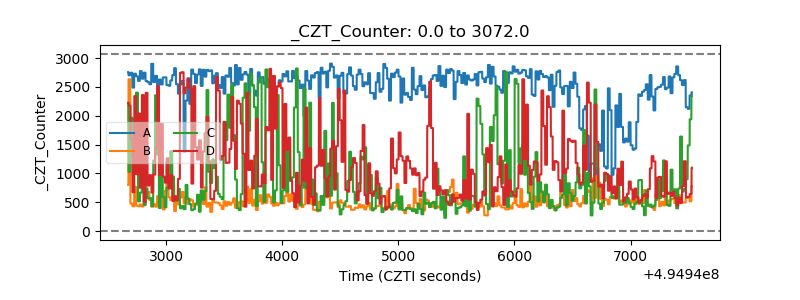 |
| +2.5 Volts monitor | 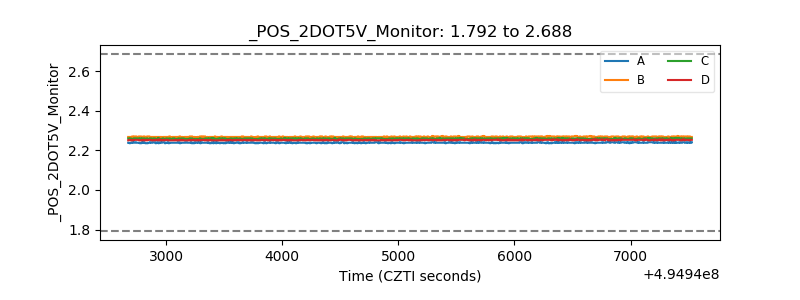 |
| +5 Volts monitor | 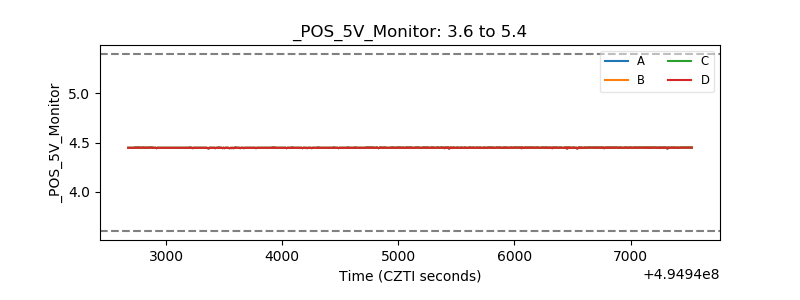 |
| _ROLL_ROT | 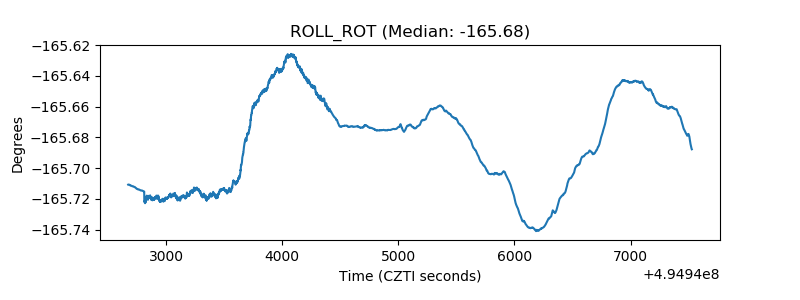 |
| _Roll_DEC | 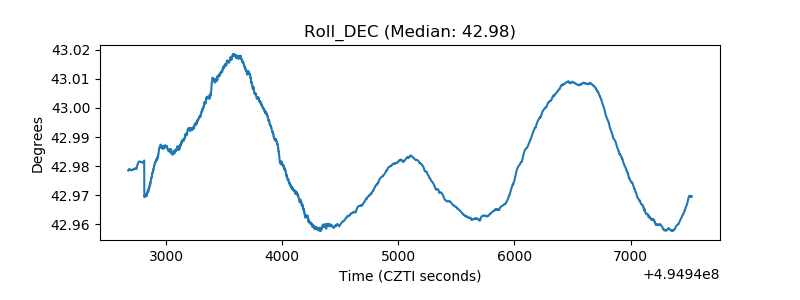 |
| _Roll_RA | 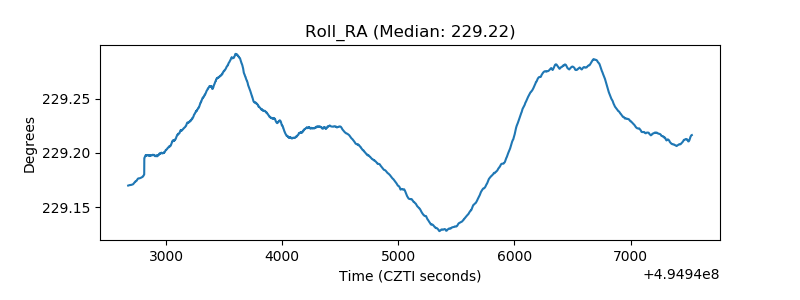 |
| Veto Counter | 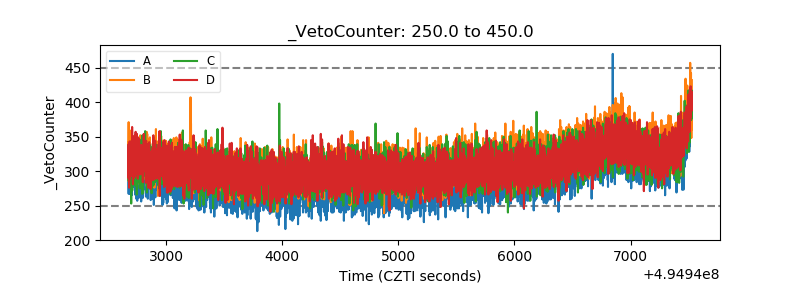 |