| Param | Original file | Final file |
|---|---|---|
| Filename | modeM0/AS1A14_022T04_9000006506_53799cztM0_level2.fits | modeM0/AS1A14_022T04_9000006506_53799cztM0_level2_quad_clean.evt |
| Size (bytes) | 3,041,366,400 | 180,322,560 |
| Size | 2.8 GB | 172.0 MB |
| Events in quadrant A | 47,293,203 | 88,854 |
| Events in quadrant B | 11,124,478 | 1,791,943 |
| Events in quadrant C | 20,997,887 | 1,329,355 |
| Events in quadrant D | 31,700,852 | 935,408 |
| Mode M0 | |||
|---|---|---|---|
| Quadrant | BADHDUFLAG | Total packets | Discarded packets |
| A | 0 | 153688 | 4 |
| B | 0 | 46494 | 4 |
| C | 0 | 75734 | 4 |
| D | 0 | 107493 | 5 |
| Mode SS | |||
|---|---|---|---|
| Quadrant | BADHDUFLAG | Total packets | Discarded packets |
| A | 0 | 386 | 0 |
| B | 0 | 386 | 0 |
| C | 0 | 386 | 0 |
| D | 0 | 386 | 0 |
| Mode M9 | |||
|---|---|---|---|
| Quadrant | BADHDUFLAG | Total packets | Discarded packets |
| A | 0 | 18 | 0 |
| B | 0 | 18 | 0 |
| C | 0 | 18 | 0 |
| D | 0 | 18 | 0 |
| Quadrant | Total seconds | Saturated seconds | Saturation percentage |
|---|---|---|---|
| A | 19054 | 18251 | 95.785662% |
| B | 19055 | 801 | 4.203621% |
| C | 19055 | 3849 | 20.199423% |
| D | 19054 | 8205 | 43.061824% |
Noise dominated data is calculated using 1-second bins in cleaned event files. If a bin has >2000 counts, and if more than 50% of those come from <1% of pixels, then it is considered to be noise-dominated and hence unusable.
| Quadrant | # 1 sec bins | Bins with >0 counts | Bins with >2000 counts | High rate bins dominated by noise | Noise dominated (total time) | Noise dominated (detector-on time) | Marked lightcurve |
|---|---|---|---|---|---|---|---|
| A | 20798 | 19055 | 16692 | 16692 | 80.26% | 87.60% | 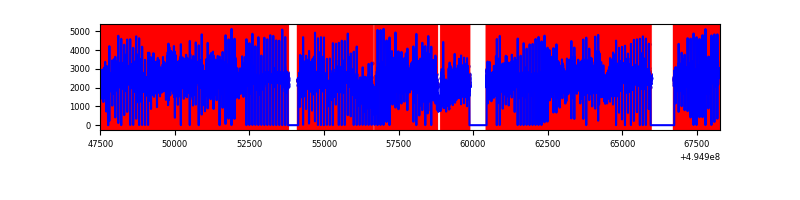 |
| B | 20800 | 19059 | 378 | 378 | 1.82% | 1.98% |  |
| C | 20800 | 19058 | 2898 | 2898 | 13.93% | 15.21% | 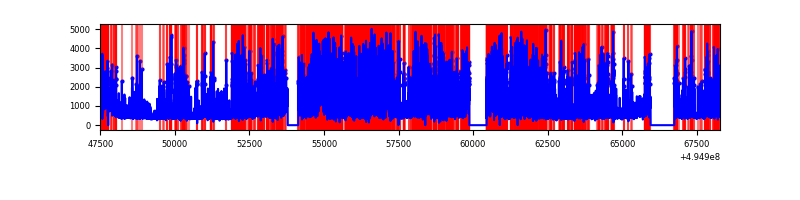 |
| D | 20799 | 19058 | 6938 | 6938 | 33.36% | 36.40% | 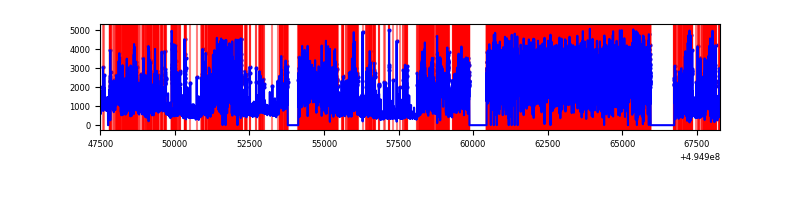 |
Top three noisy pixels from each quadrant. If the there are fewer than three noisy pixels in the level2.evt file, extra rows are filled as -1
| Pixel properties | Quadrant properties | ||||||
|---|---|---|---|---|---|---|---|
| Quadrant | DetID | PixID | Counts | Sigma | Mean | Median | Sigma |
| A | 3 | 63 | 42175982 | 244723.44 | 691 | 673 | 172.3 |
| A | 3 | 78 | 2089108 | 12118.2 | 691 | 673 | 172.3 |
| A | 0 | 8 | 203223 | 1175.3 | 691 | 673 | 172.3 |
| B | 8 | 234 | 1223936 | 2939.13 | 1977 | 1909 | 415.8 |
| B | 7 | 0 | 702489 | 1684.98 | 1977 | 1909 | 415.8 |
| B | 5 | 250 | 497809 | 1192.7 | 1977 | 1909 | 415.8 |
| C | 15 | 224 | 12030236 | 24518.98 | 1795 | 1778 | 490.6 |
| C | 4 | 5 | 367210 | 744.9 | 1795 | 1778 | 490.6 |
| C | 12 | 2 | 351494 | 712.87 | 1795 | 1778 | 490.6 |
| D | 11 | 245 | 13648805 | 30791.5 | 1541 | 1470 | 443.2 |
| D | 1 | 241 | 2811447 | 6339.95 | 1541 | 1470 | 443.2 |
| D | 10 | 172 | 2594813 | 5851.17 | 1541 | 1470 | 443.2 |
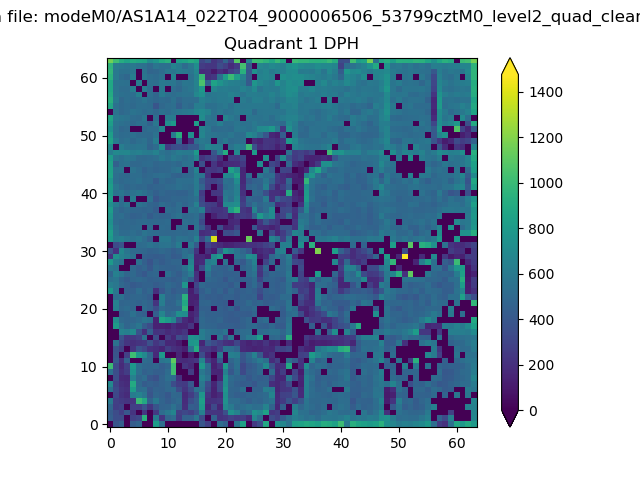
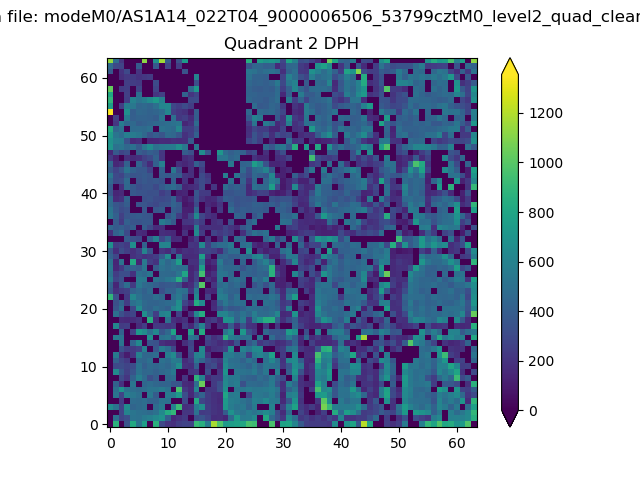
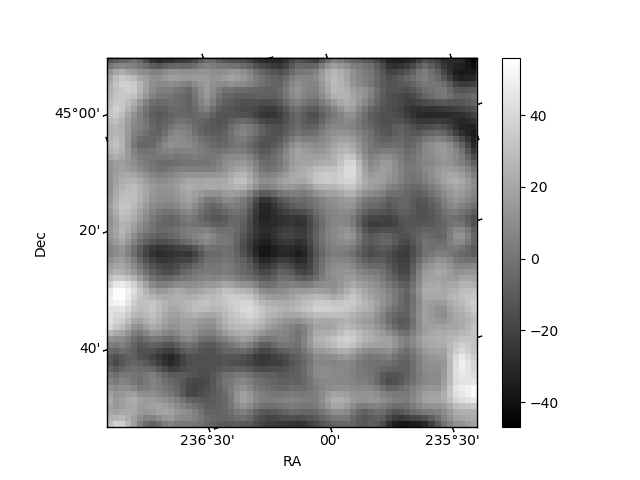
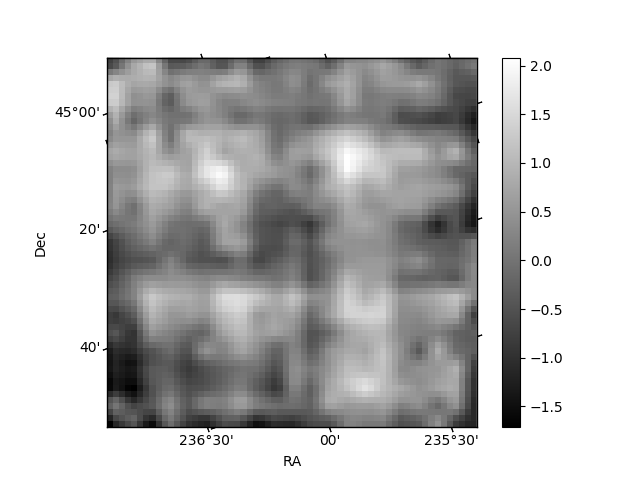
Histogram calculated using DETX and DETY for each event in the final _common_clean file
| Quadrant A | 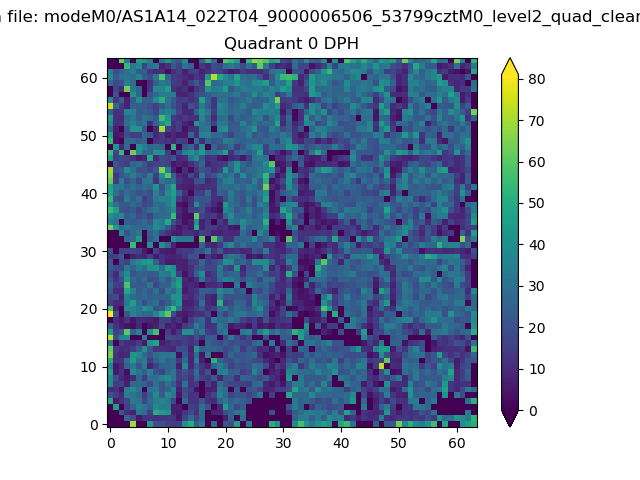 |
 |
Quadrant B |
|---|---|---|---|
| Quadrant D | 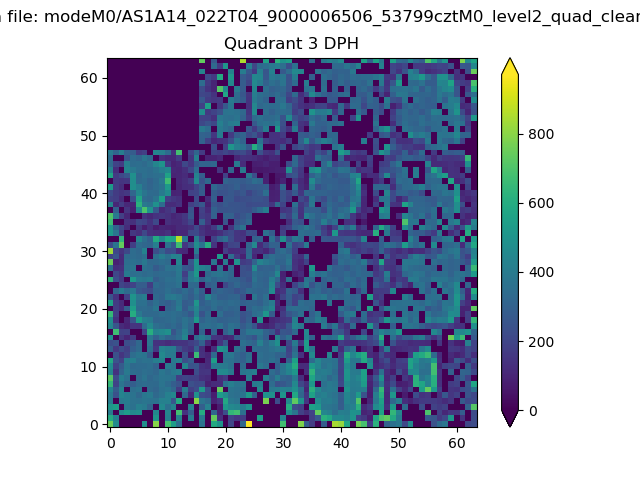 |
 |
Quadrant C |
| Plot type | Count rate plots | Images |
|---|---|---|
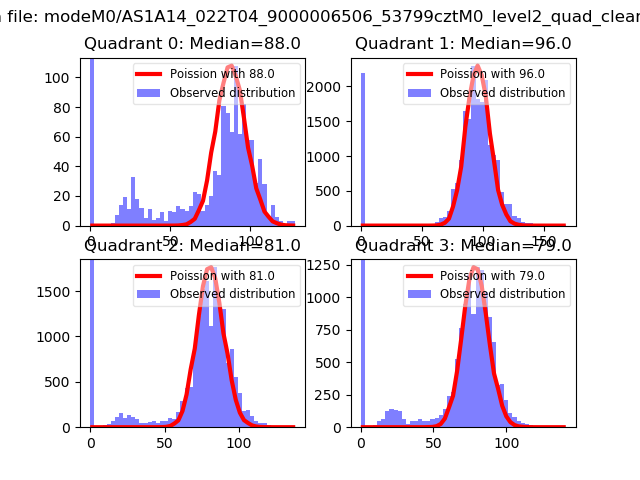
| Comparison with Poisson distribution Blue bars denote a histogram of data divided into 1 sec bins. Red curve is a Poisson curve with rate = median count rate of data. |
 |
 |
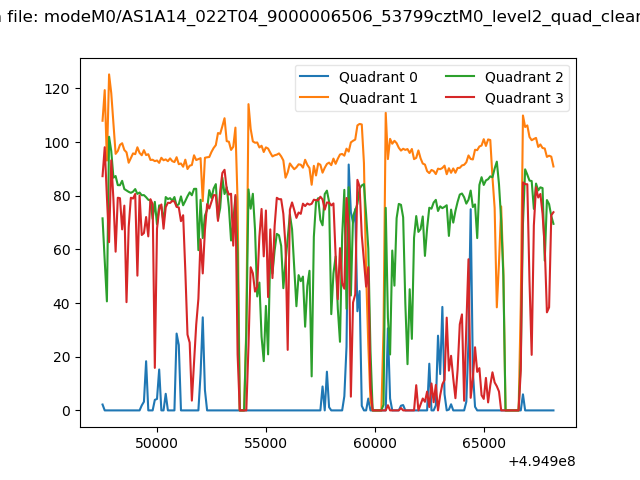
| Quadrant-wise count rates Data is divided into 100 sec bins |
 |
|
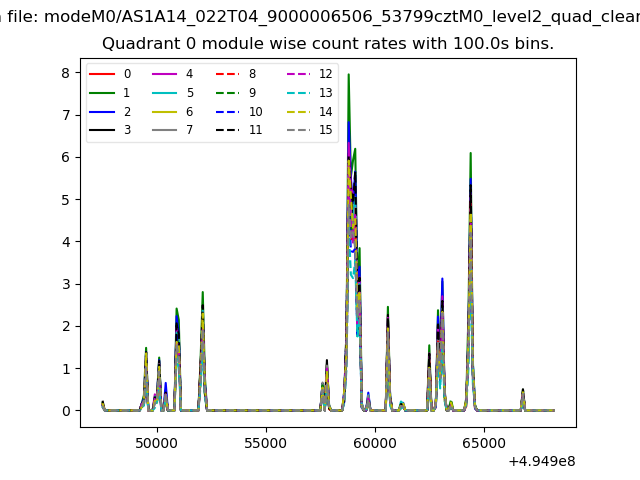
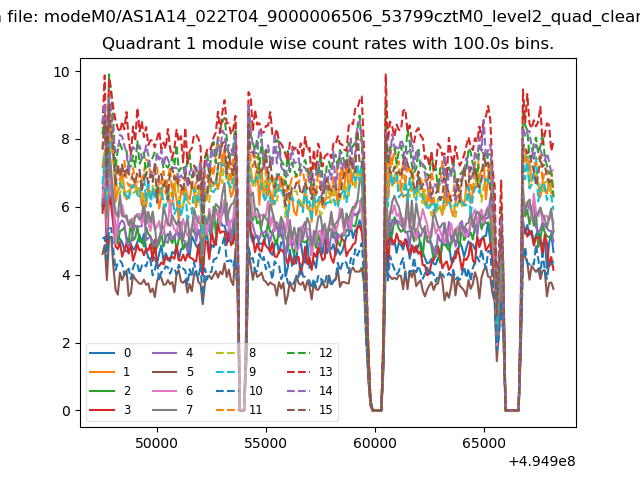
| Module-wise count rates for Quadrant A Data is divided into 100 sec bins |
 |
 |
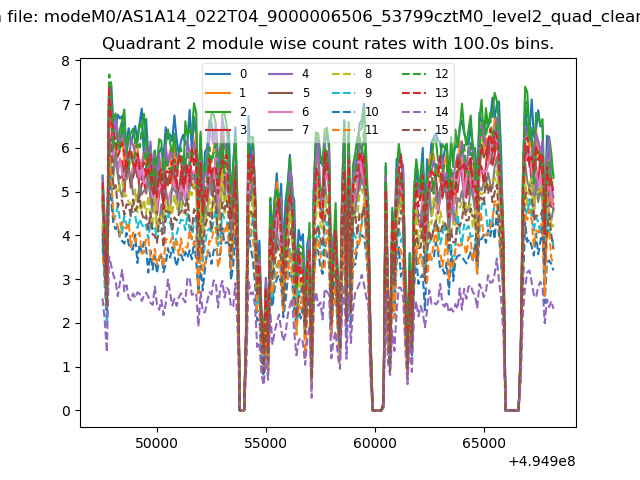
| Module-wise count rates for Quadrant B Data is divided into 100 sec bins |
 |
 |
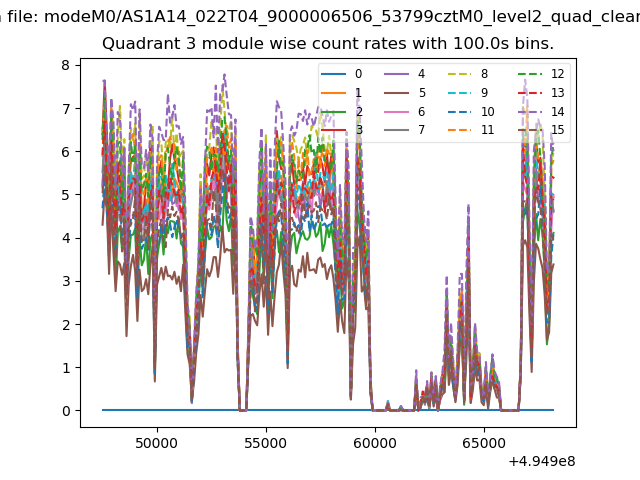
| Module-wise count rates for Quadrant C Data is divided into 100 sec bins |
 |
 |
| Module-wise count rates for Quadrant D Data is divided into 100 sec bins |
 |
 |
| Parameter | Plot |
|---|---|
| CZT HV Monitor | 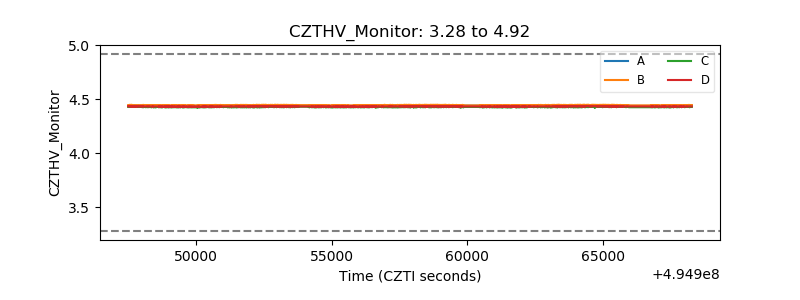 |
| D_VDD |  |
| Temperature 1 | 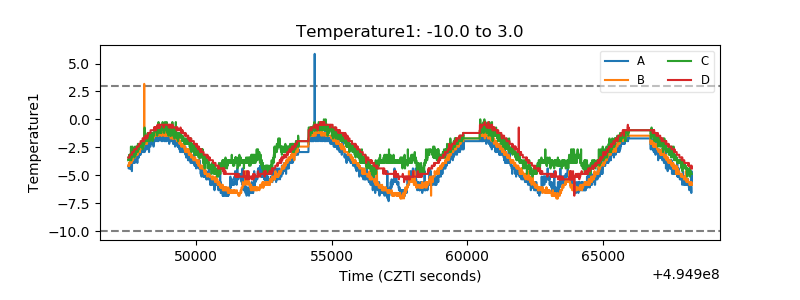 |
| Veto HV Monitor | 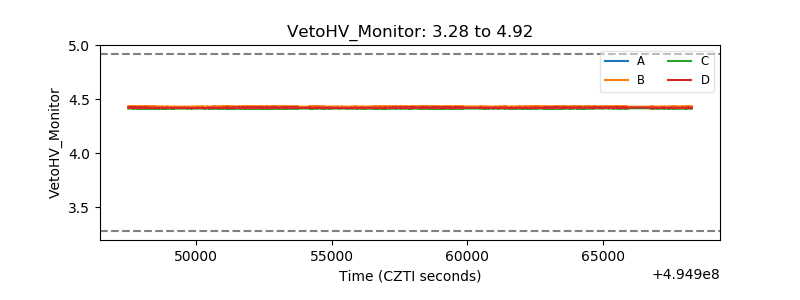 |
| Veto LLD | 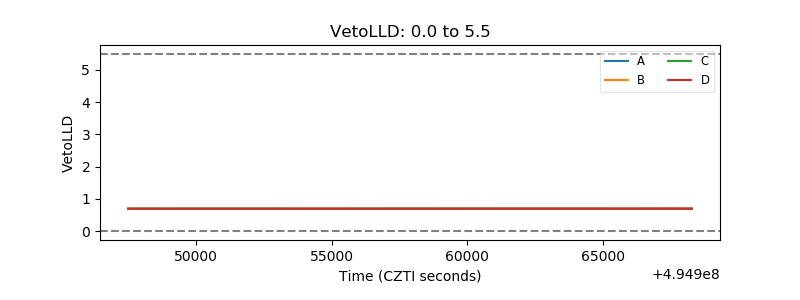 |
| Alpha Counter | 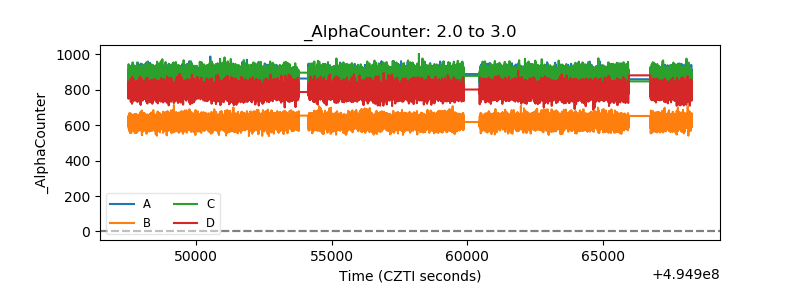 |
| _CPM_Rate | 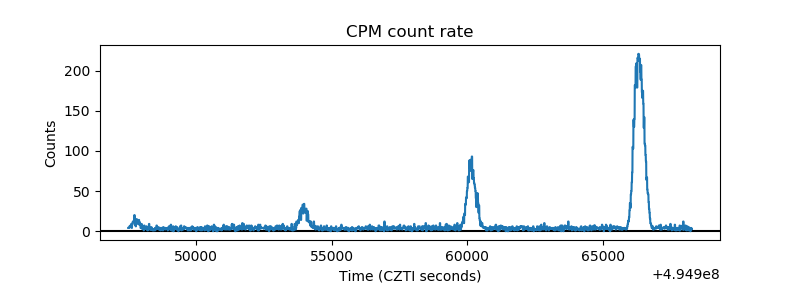 |
| CZT Counter | 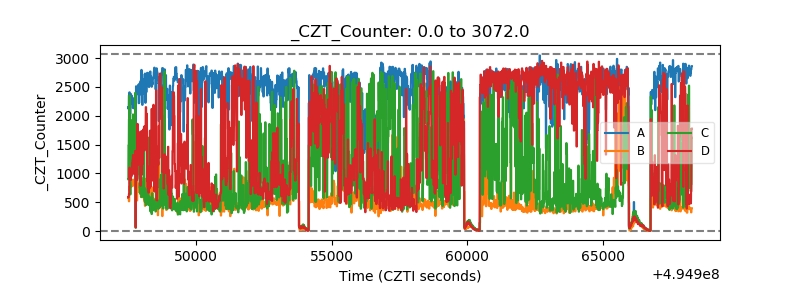 |
| +2.5 Volts monitor | 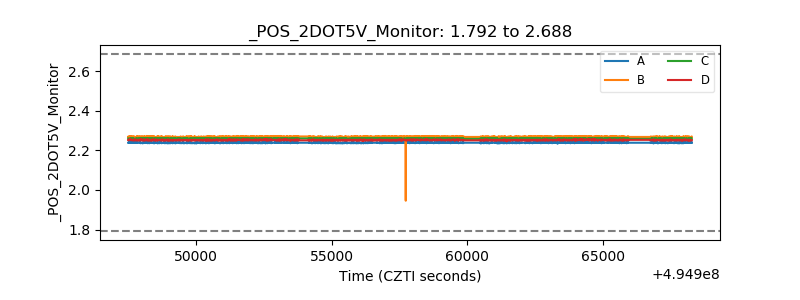 |
| +5 Volts monitor | 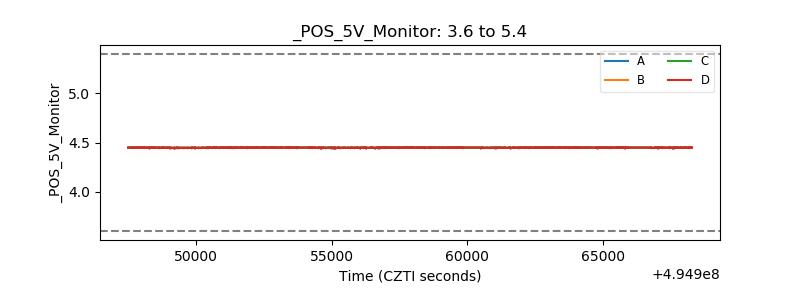 |
| _ROLL_ROT | 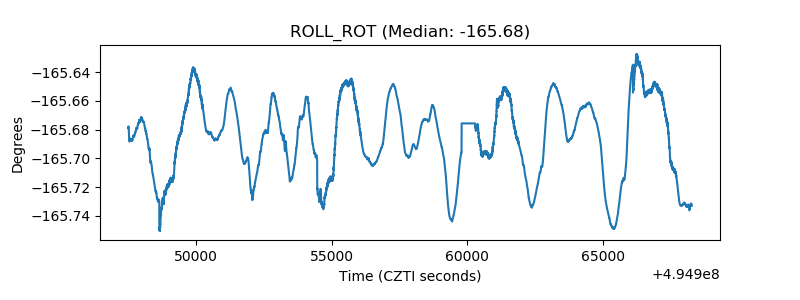 |
| _Roll_DEC | 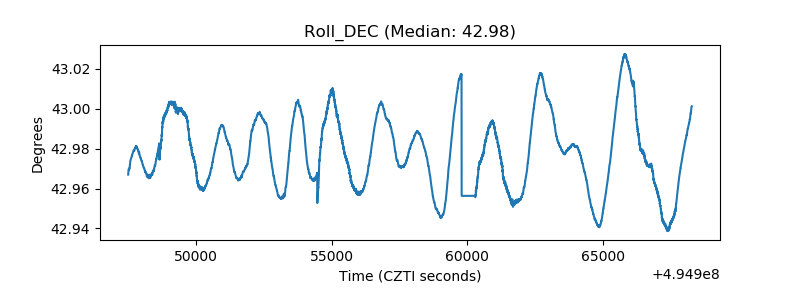 |
| _Roll_RA |  |
| Veto Counter | 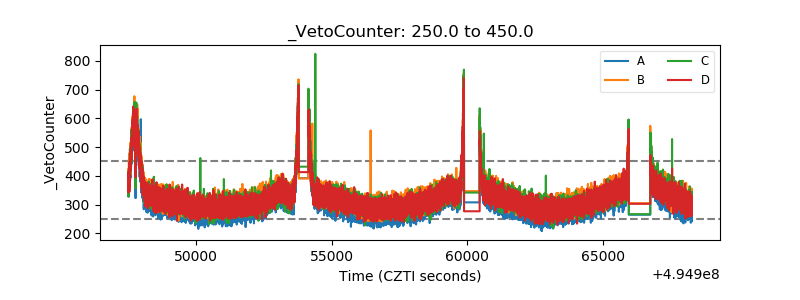 |