| Param | Original file | Final file |
|---|---|---|
| Filename | modeM0/AS1A14_022T04_9000006506_53800cztM0_level2.fits | modeM0/AS1A14_022T04_9000006506_53800cztM0_level2_quad_clean.evt |
| Size (bytes) | 911,666,880 | 65,992,320 |
| Size | 869.4 MB | 62.9 MB |
| Events in quadrant A | 15,779,694 | 48,525 |
| Events in quadrant B | 4,280,003 | 588,198 |
| Events in quadrant C | 6,459,288 | 503,350 |
| Events in quadrant D | 6,744,779 | 422,152 |
| Mode M0 | |||
|---|---|---|---|
| Quadrant | BADHDUFLAG | Total packets | Discarded packets |
| A | 0 | 51162 | 1 |
| B | 0 | 17300 | 1 |
| C | 0 | 23535 | 1 |
| D | 0 | 24407 | 11 |
| Mode SS | |||
|---|---|---|---|
| Quadrant | BADHDUFLAG | Total packets | Discarded packets |
| A | 0 | 126 | 0 |
| B | 0 | 126 | 0 |
| C | 0 | 126 | 0 |
| D | 0 | 126 | 0 |
| Mode M9 | |||
|---|---|---|---|
| Quadrant | BADHDUFLAG | Total packets | Discarded packets |
| A | 0 | 10 | 0 |
| B | 0 | 10 | 0 |
| C | 0 | 10 | 0 |
| D | 0 | 10 | 0 |
| Quadrant | Total seconds | Saturated seconds | Saturation percentage |
|---|---|---|---|
| A | 6244 | 5841 | 93.545804% |
| B | 6244 | 472 | 7.559257% |
| C | 6244 | 838 | 13.420884% |
| D | 6241 | 1327 | 21.262618% |
Noise dominated data is calculated using 1-second bins in cleaned event files. If a bin has >2000 counts, and if more than 50% of those come from <1% of pixels, then it is considered to be noise-dominated and hence unusable.
| Quadrant | # 1 sec bins | Bins with >0 counts | Bins with >2000 counts | High rate bins dominated by noise | Noise dominated (total time) | Noise dominated (detector-on time) | Marked lightcurve |
|---|---|---|---|---|---|---|---|
| A | 7194 | 6245 | 5670 | 5670 | 78.82% | 90.79% | 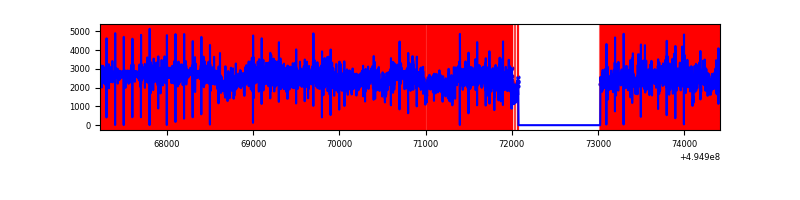 |
| B | 7194 | 6245 | 315 | 315 | 4.38% | 5.04% | 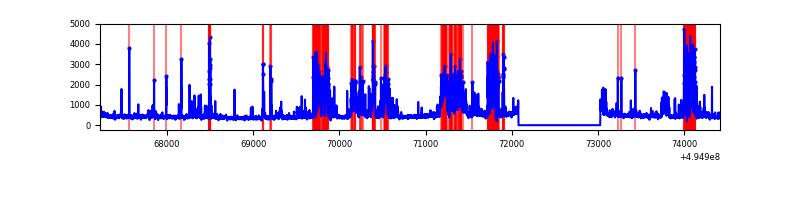 |
| C | 7194 | 6245 | 705 | 705 | 9.80% | 11.29% | 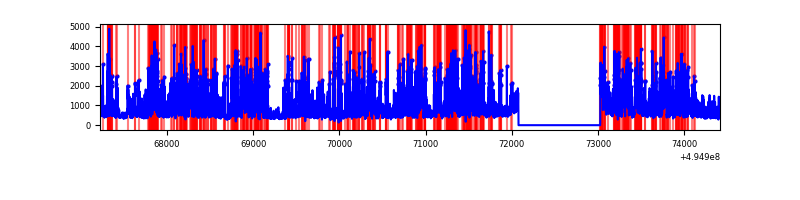 |
| D | 7192 | 6243 | 1133 | 1133 | 15.75% | 18.15% | 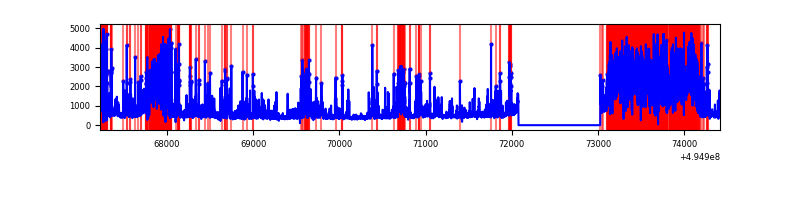 |
Top three noisy pixels from each quadrant. If the there are fewer than three noisy pixels in the level2.evt file, extra rows are filled as -1
| Pixel properties | Quadrant properties | ||||||
|---|---|---|---|---|---|---|---|
| Quadrant | DetID | PixID | Counts | Sigma | Mean | Median | Sigma |
| A | 3 | 63 | 13710526 | 166529.84 | 324 | 316 | 82.3 |
| A | 3 | 78 | 488065 | 5924.4 | 324 | 316 | 82.3 |
| A | 0 | 8 | 152526 | 1848.81 | 324 | 316 | 82.3 |
| B | 5 | 185 | 1226805 | 9145.96 | 625 | 602 | 134.1 |
| B | 8 | 234 | 312939 | 2329.65 | 625 | 602 | 134.1 |
| B | 7 | 252 | 85515 | 633.35 | 625 | 602 | 134.1 |
| C | 15 | 224 | 3021533 | 17863.89 | 600 | 593 | 169.1 |
| C | 1 | 241 | 247074 | 1457.53 | 600 | 593 | 169.1 |
| C | 3 | 242 | 244554 | 1442.63 | 600 | 593 | 169.1 |
| D | 11 | 245 | 2399921 | 15130.46 | 555 | 531 | 158.6 |
| D | 1 | 241 | 845953 | 5331.2 | 555 | 531 | 158.6 |
| D | 10 | 172 | 262376 | 1651.18 | 555 | 531 | 158.6 |
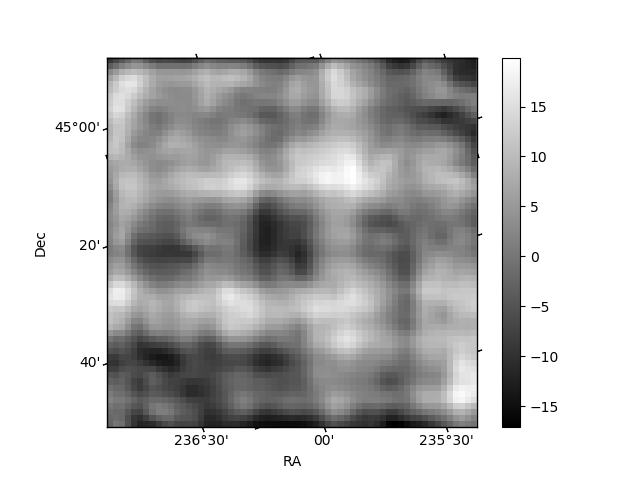
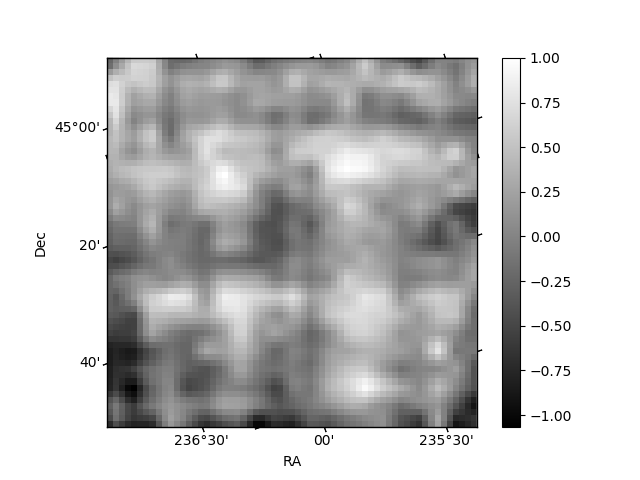
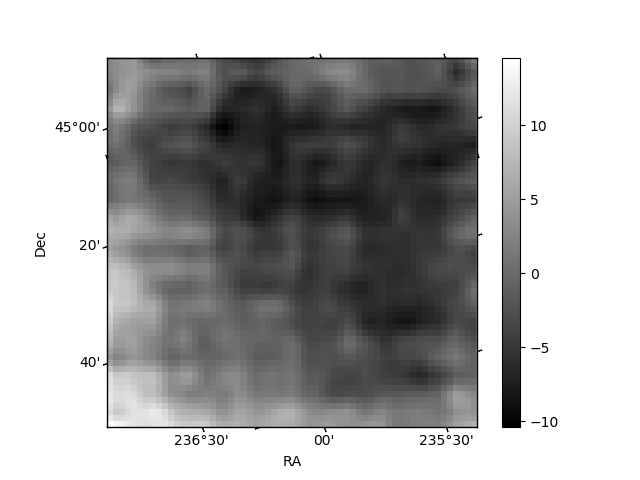
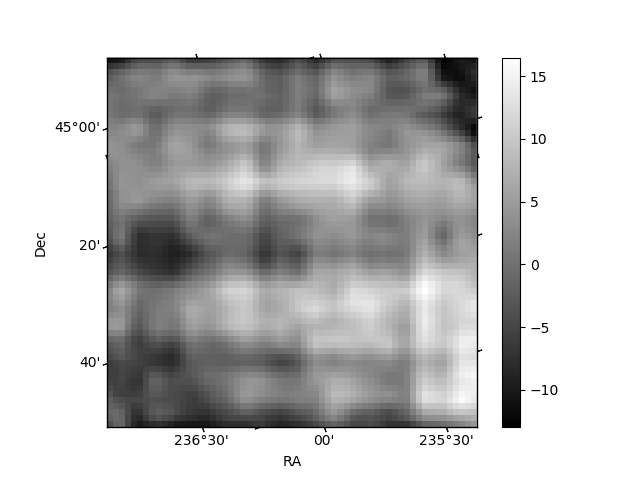
Histogram calculated using DETX and DETY for each event in the final _common_clean file
| Quadrant A | 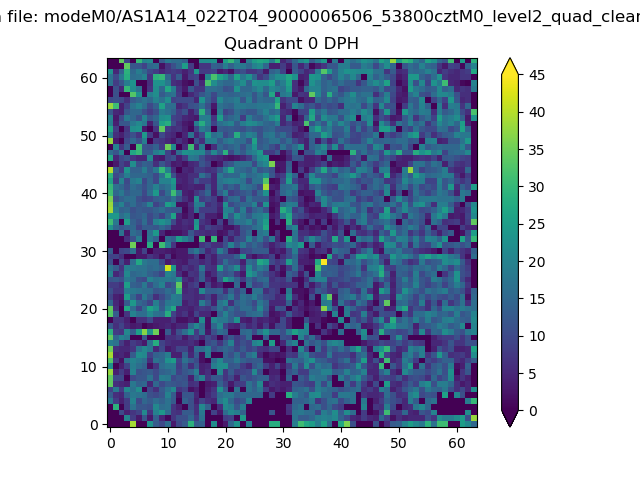 |
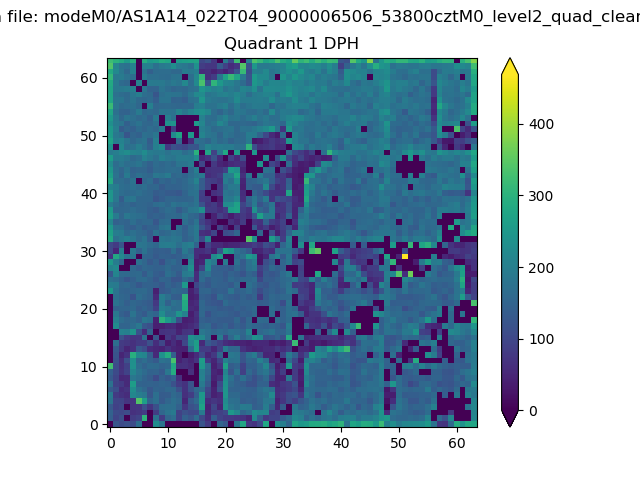 |
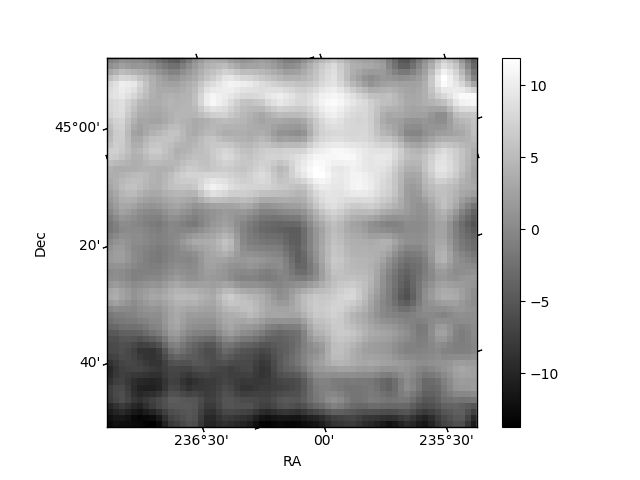
Quadrant B |
|---|---|---|---|
| Quadrant D | 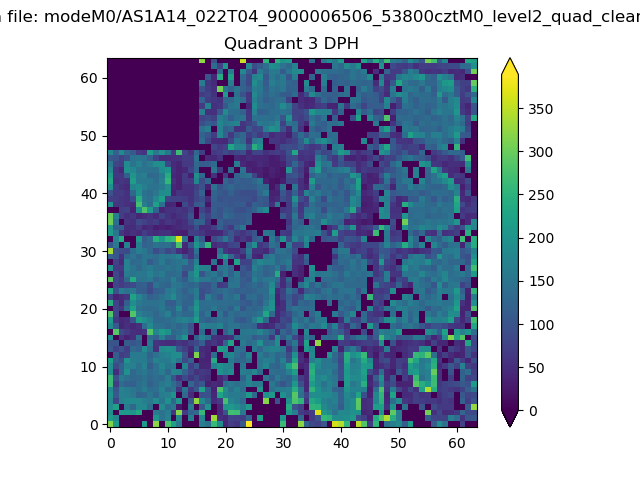 |
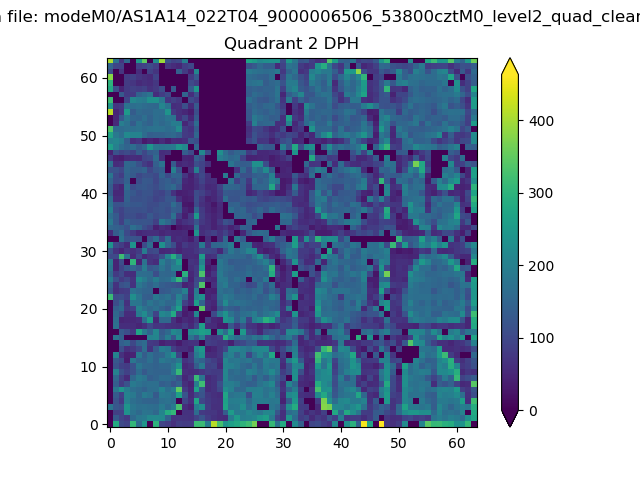 |
Quadrant C |
| Plot type | Count rate plots | Images |
|---|---|---|
| Comparison with Poisson distribution Blue bars denote a histogram of data divided into 1 sec bins. Red curve is a Poisson curve with rate = median count rate of data. |
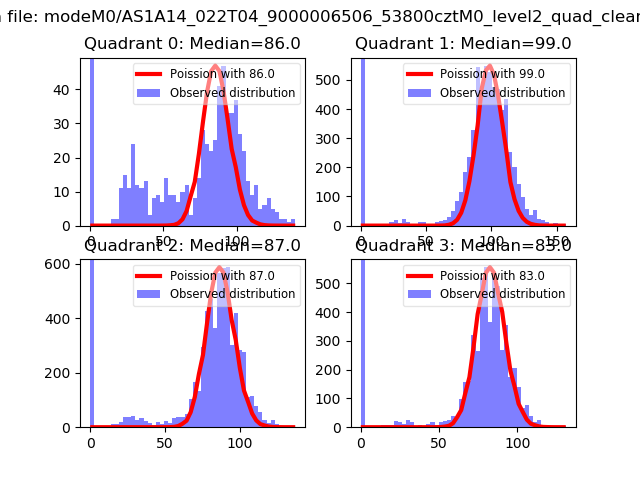 |
 |
| Quadrant-wise count rates Data is divided into 100 sec bins |
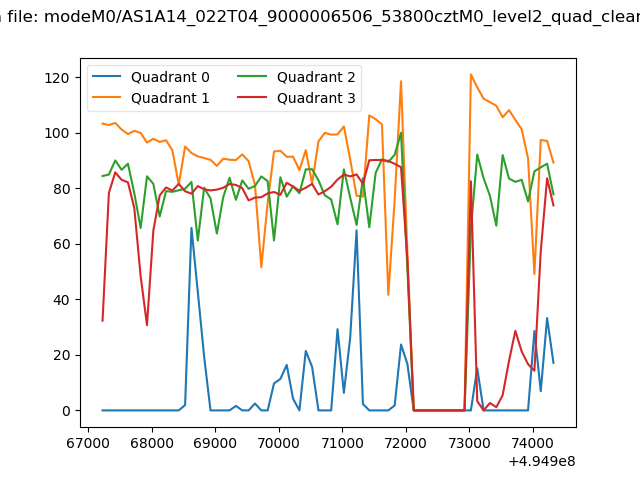 |
|
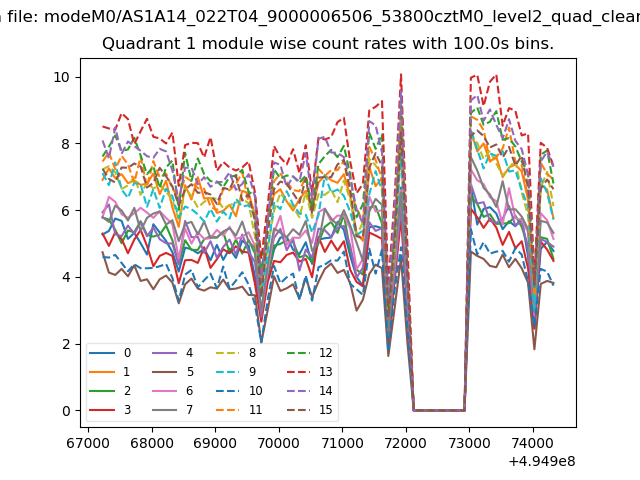
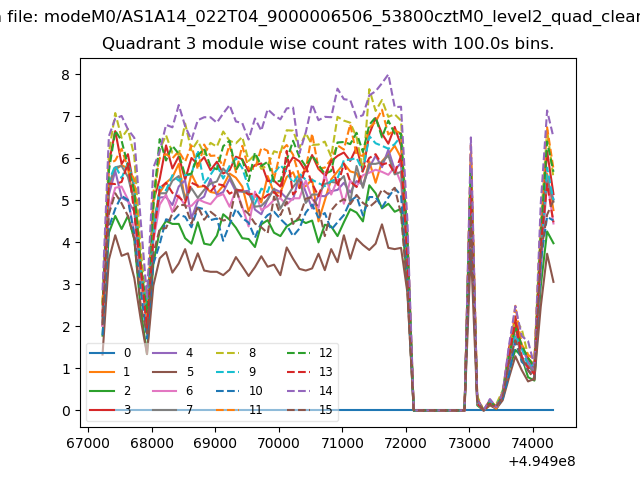
| Module-wise count rates for Quadrant A Data is divided into 100 sec bins |
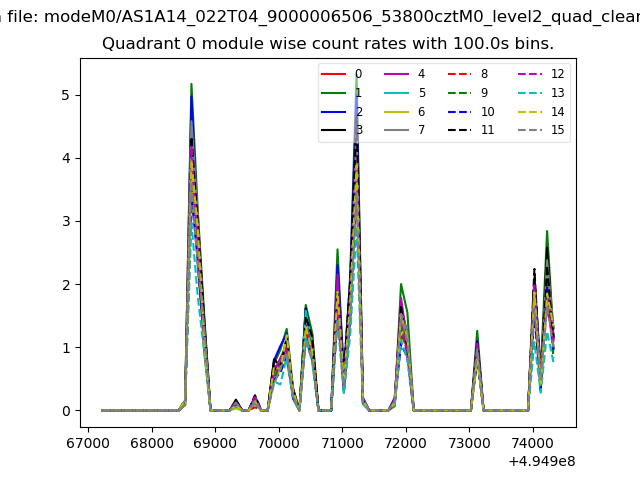 |
 |
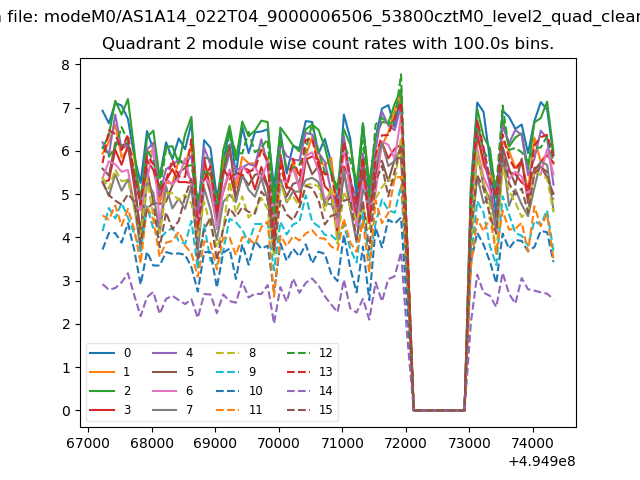
| Module-wise count rates for Quadrant B Data is divided into 100 sec bins |
 |
 |
| Module-wise count rates for Quadrant C Data is divided into 100 sec bins |
 |
 |
| Module-wise count rates for Quadrant D Data is divided into 100 sec bins |
 |
 |
| Parameter | Plot |
|---|---|
| CZT HV Monitor |  |
| D_VDD | 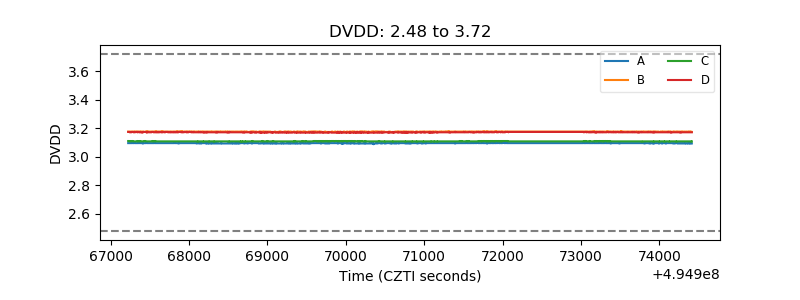 |
| Temperature 1 | 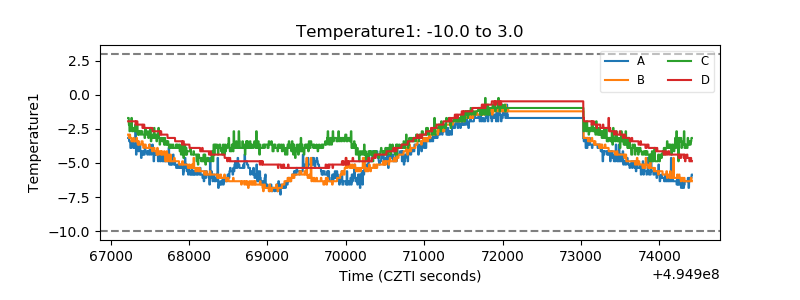 |
| Veto HV Monitor | 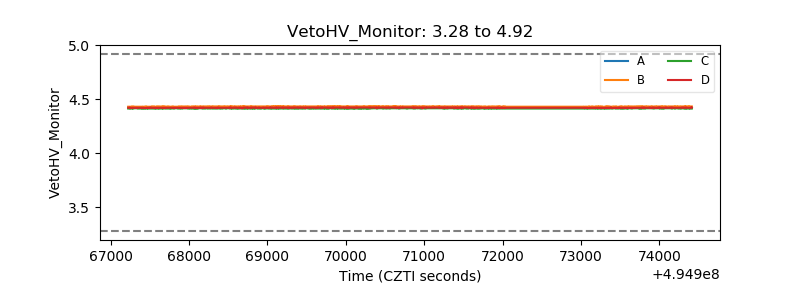 |
| Veto LLD | 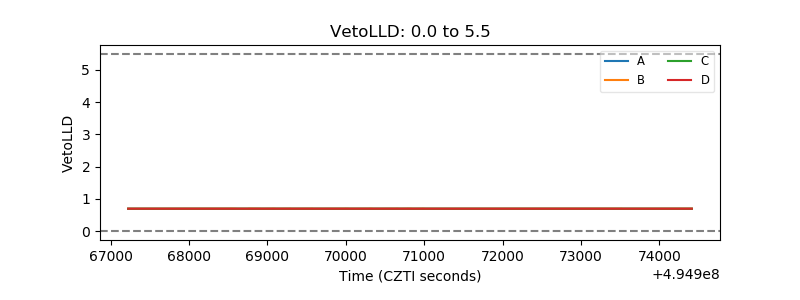 |
| Alpha Counter | 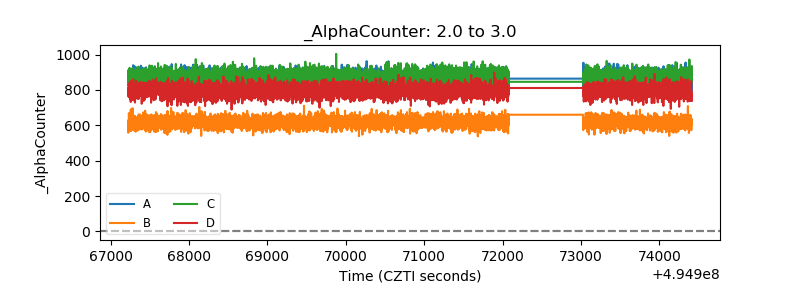 |
| _CPM_Rate | 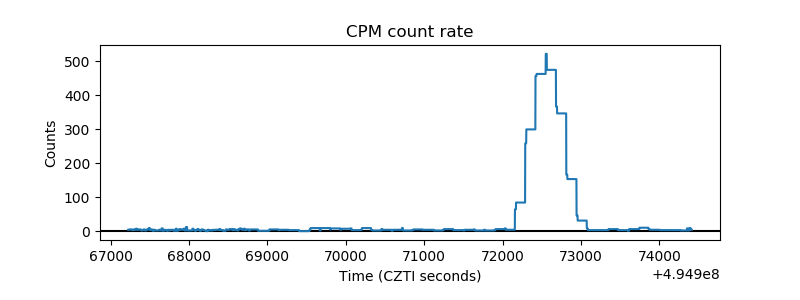 |
| CZT Counter | 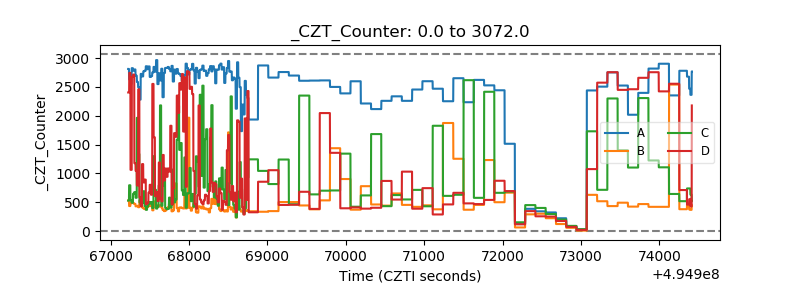 |
| +2.5 Volts monitor |  |
| +5 Volts monitor |  |
| _ROLL_ROT | 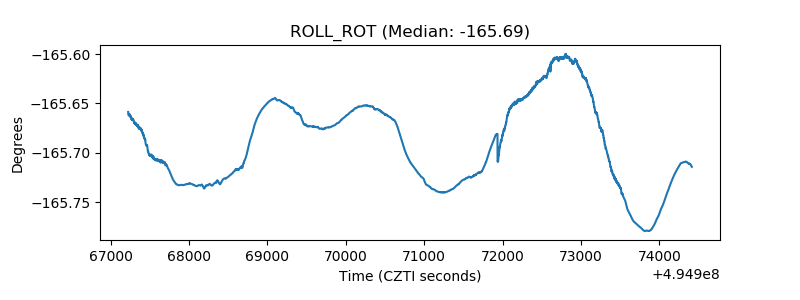 |
| _Roll_DEC | 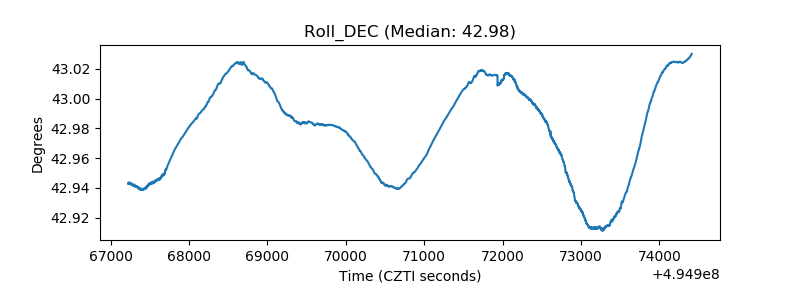 |
| _Roll_RA | 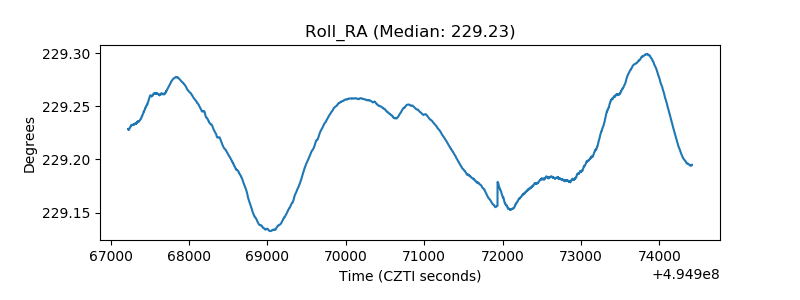 |
| Veto Counter | 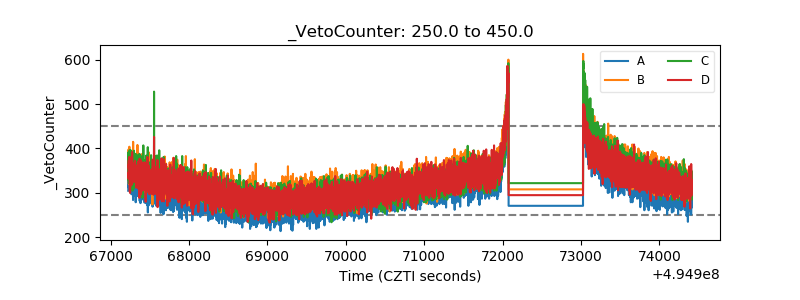 |