| Param | Original file | Final file |
|---|---|---|
| Filename | modeM0/AS1A14_022T04_9000006506_53802cztM0_level2.fits | modeM0/AS1A14_022T04_9000006506_53802cztM0_level2_quad_clean.evt |
| Size (bytes) | 885,522,240 | 71,000,640 |
| Size | 844.5 MB | 67.7 MB |
| Events in quadrant A | 15,170,729 | 100,951 |
| Events in quadrant B | 3,802,166 | 626,453 |
| Events in quadrant C | 6,334,274 | 527,356 |
| Events in quadrant D | 6,979,815 | 450,802 |
| Mode M0 | |||
|---|---|---|---|
| Quadrant | BADHDUFLAG | Total packets | Discarded packets |
| A | 0 | 49443 | 1 |
| B | 0 | 15954 | 1 |
| C | 0 | 23229 | 1 |
| D | 0 | 25158 | 1 |
| Mode SS | |||
|---|---|---|---|
| Quadrant | BADHDUFLAG | Total packets | Discarded packets |
| A | 0 | 130 | 0 |
| B | 0 | 130 | 0 |
| C | 0 | 130 | 0 |
| D | 0 | 130 | 0 |
| Mode M9 | |||
|---|---|---|---|
| Quadrant | BADHDUFLAG | Total packets | Discarded packets |
| A | 0 | 10 | 0 |
| B | 0 | 10 | 0 |
| C | 0 | 10 | 0 |
| D | 0 | 10 | 0 |
| Quadrant | Total seconds | Saturated seconds | Saturation percentage |
|---|---|---|---|
| A | 6360 | 5430 | 85.377358% |
| B | 6360 | 295 | 4.638365% |
| C | 6360 | 761 | 11.965409% |
| D | 6360 | 1227 | 19.292453% |
Noise dominated data is calculated using 1-second bins in cleaned event files. If a bin has >2000 counts, and if more than 50% of those come from <1% of pixels, then it is considered to be noise-dominated and hence unusable.
| Quadrant | # 1 sec bins | Bins with >0 counts | Bins with >2000 counts | High rate bins dominated by noise | Noise dominated (total time) | Noise dominated (detector-on time) | Marked lightcurve |
|---|---|---|---|---|---|---|---|
| A | 7415 | 6361 | 5218 | 5218 | 70.37% | 82.03% | 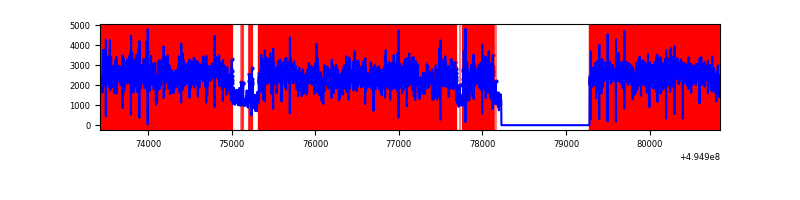 |
| B | 7415 | 6361 | 166 | 166 | 2.24% | 2.61% | 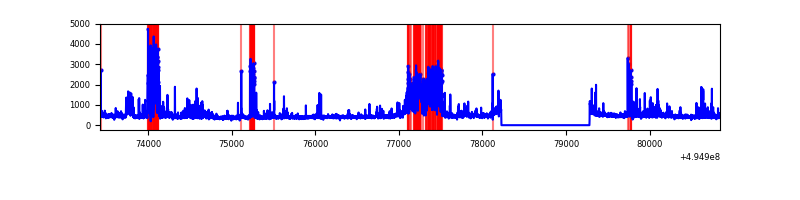 |
| C | 7415 | 6361 | 638 | 638 | 8.60% | 10.03% | 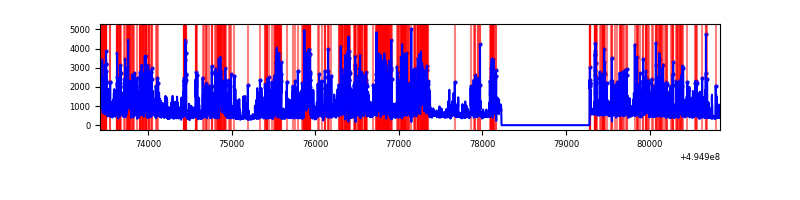 |
| D | 7415 | 6361 | 1002 | 1002 | 13.51% | 15.75% | 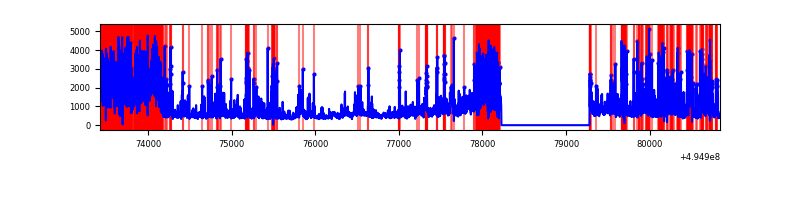 |
Top three noisy pixels from each quadrant. If the there are fewer than three noisy pixels in the level2.evt file, extra rows are filled as -1
| Pixel properties | Quadrant properties | ||||||
|---|---|---|---|---|---|---|---|
| Quadrant | DetID | PixID | Counts | Sigma | Mean | Median | Sigma |
| A | 3 | 63 | 12352302 | 120291.88 | 408 | 398 | 102.7 |
| A | 3 | 78 | 1026525 | 9993.18 | 408 | 398 | 102.7 |
| A | 5 | 241 | 80249 | 777.65 | 408 | 398 | 102.7 |
| B | 5 | 185 | 567518 | 4010.12 | 653 | 628 | 141.4 |
| B | 8 | 234 | 506861 | 3581.04 | 653 | 628 | 141.4 |
| B | 0 | 213 | 40993 | 285.54 | 653 | 628 | 141.4 |
| C | 15 | 224 | 3227773 | 18849.28 | 619 | 614 | 171.2 |
| C | 12 | 2 | 146457 | 851.84 | 619 | 614 | 171.2 |
| C | 1 | 241 | 102486 | 595.02 | 619 | 614 | 171.2 |
| D | 11 | 245 | 1456927 | 8743.57 | 578 | 554 | 166.6 |
| D | 1 | 241 | 986153 | 5917.2 | 578 | 554 | 166.6 |
| D | 0 | 5 | 460572 | 2761.79 | 578 | 554 | 166.6 |
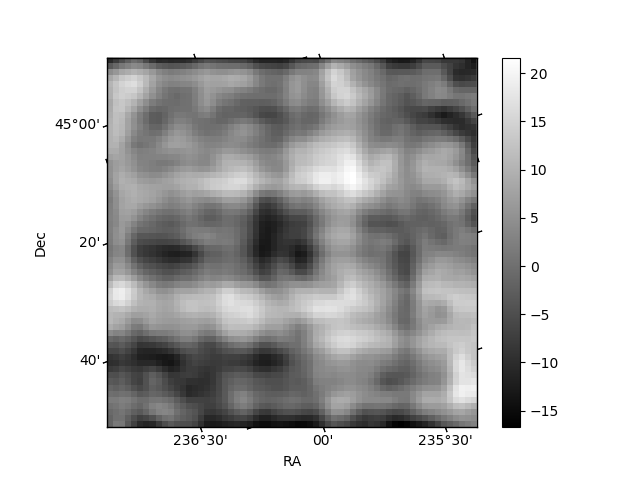
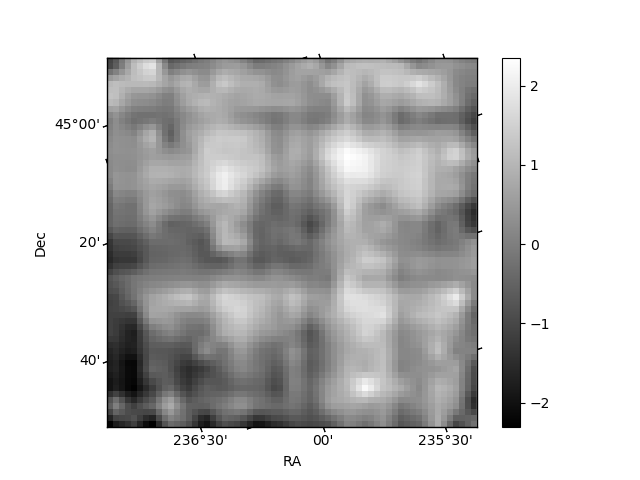
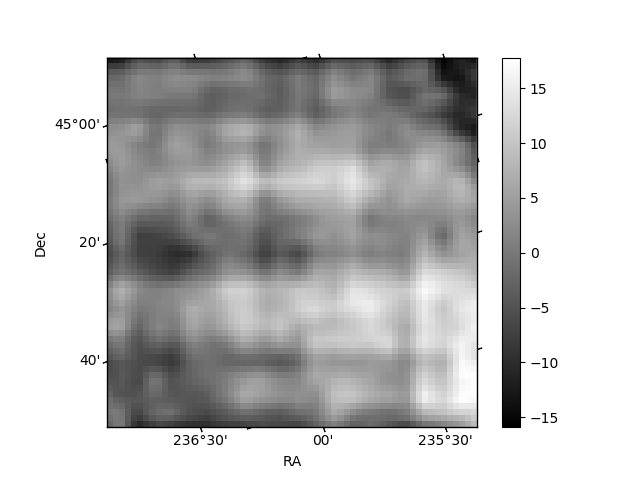
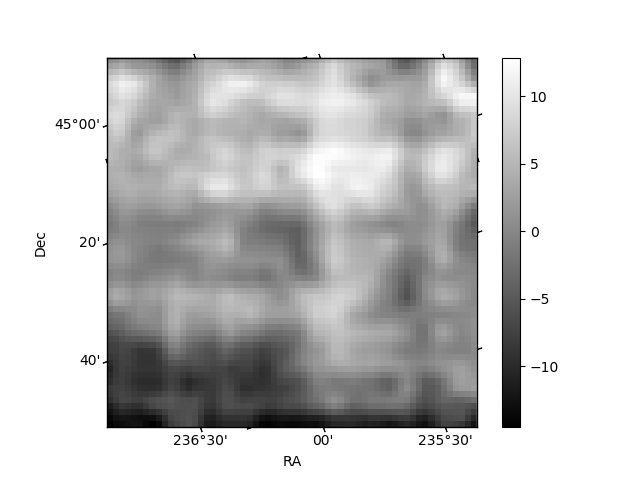
Histogram calculated using DETX and DETY for each event in the final _common_clean file
| Quadrant A | 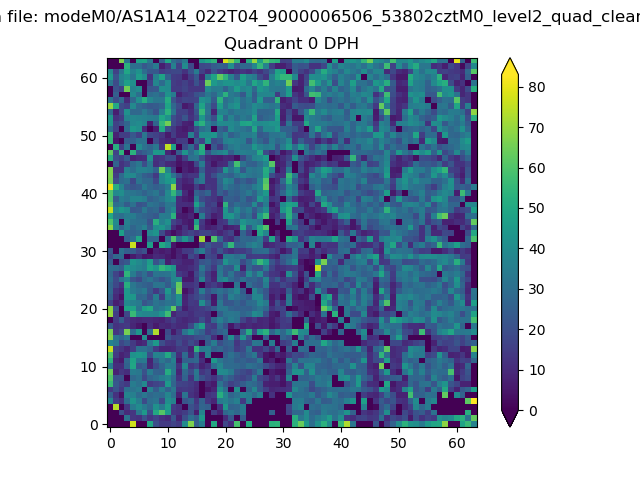 |
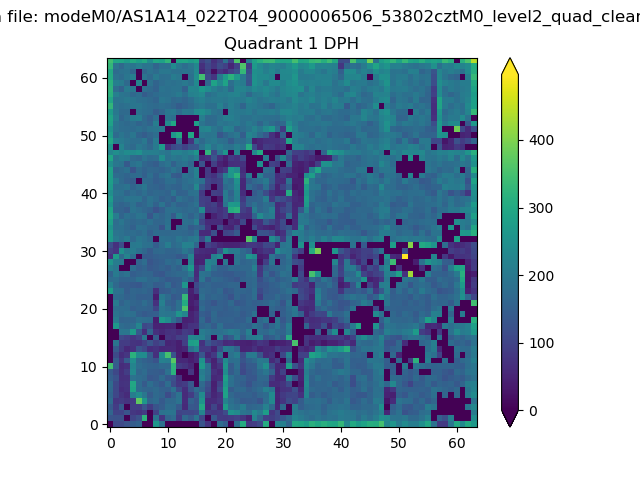 |
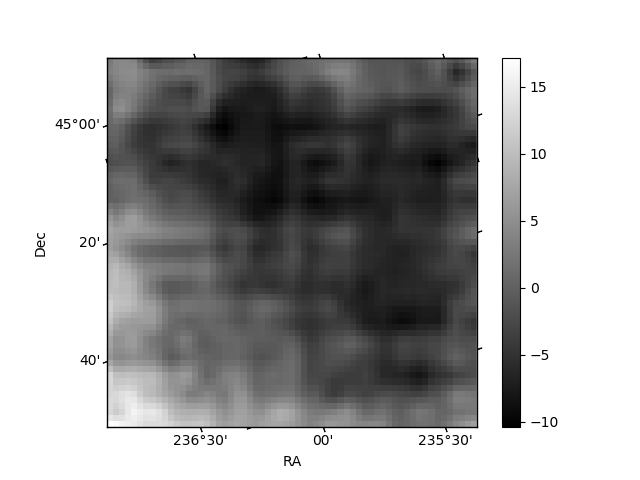
Quadrant B |
|---|---|---|---|
| Quadrant D | 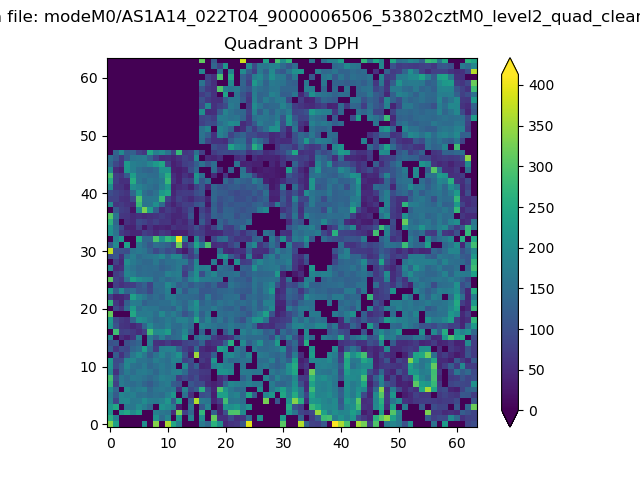 |
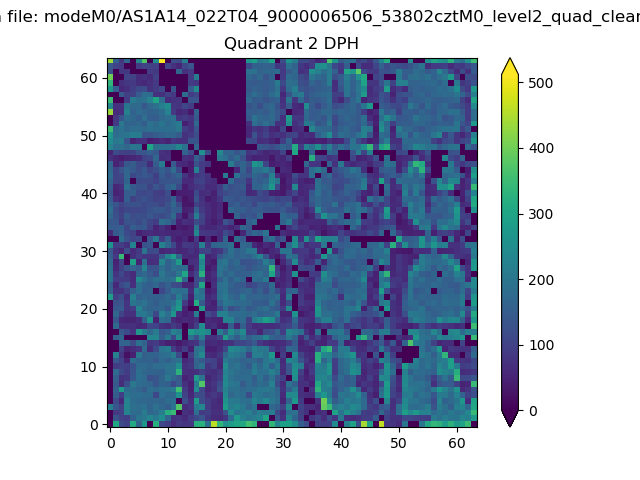 |
Quadrant C |
| Plot type | Count rate plots | Images |
|---|---|---|
| Comparison with Poisson distribution Blue bars denote a histogram of data divided into 1 sec bins. Red curve is a Poisson curve with rate = median count rate of data. |
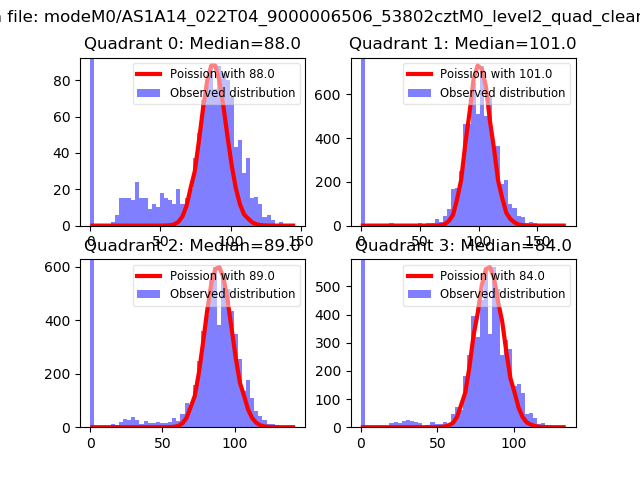 |
 |
| Quadrant-wise count rates Data is divided into 100 sec bins |
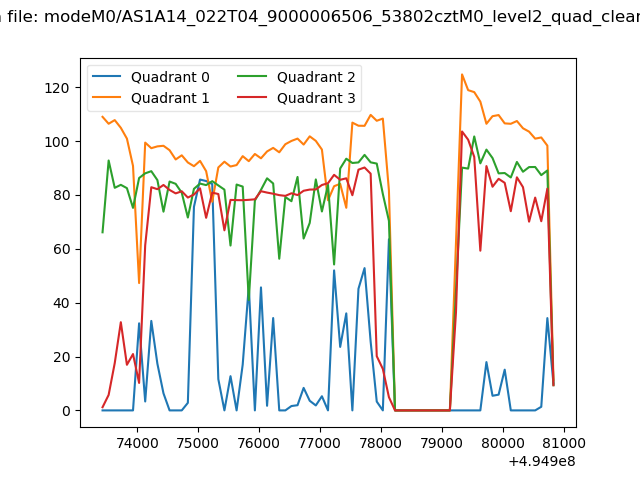 |
|
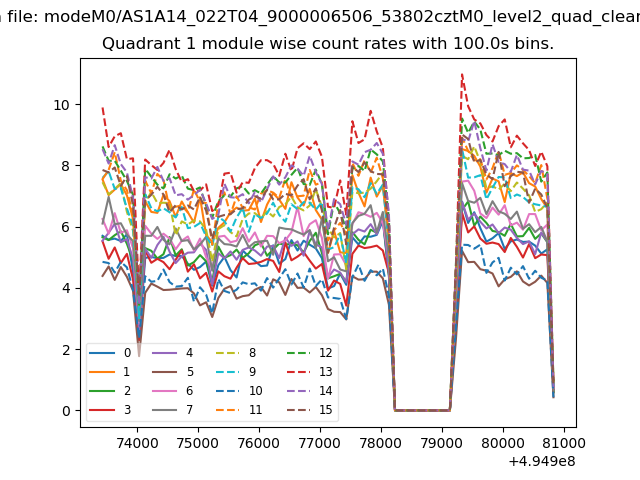
| Module-wise count rates for Quadrant A Data is divided into 100 sec bins |
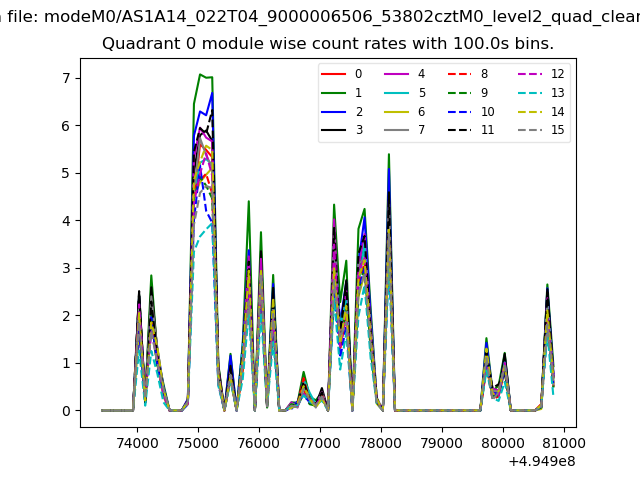 |
 |
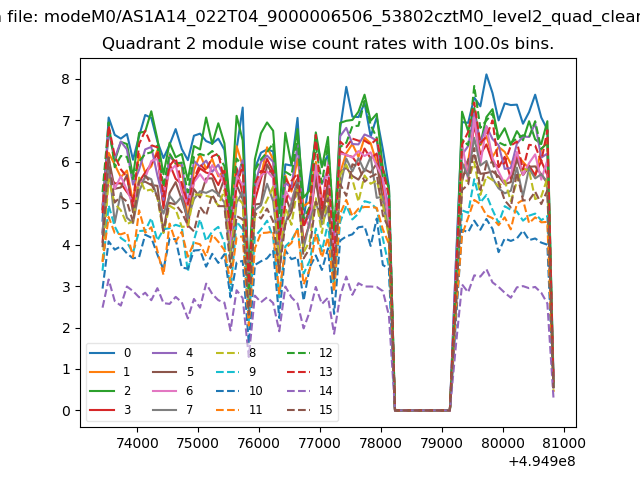
| Module-wise count rates for Quadrant B Data is divided into 100 sec bins |
 |
 |
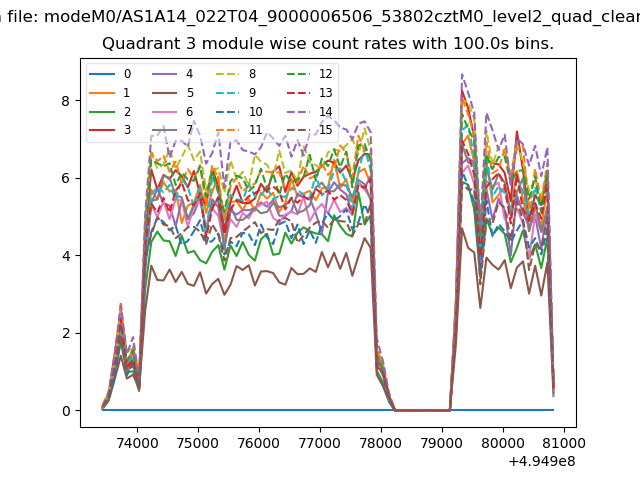
| Module-wise count rates for Quadrant C Data is divided into 100 sec bins |
 |
 |
| Module-wise count rates for Quadrant D Data is divided into 100 sec bins |
 |
 |
| Parameter | Plot |
|---|---|
| CZT HV Monitor |  |
| D_VDD | 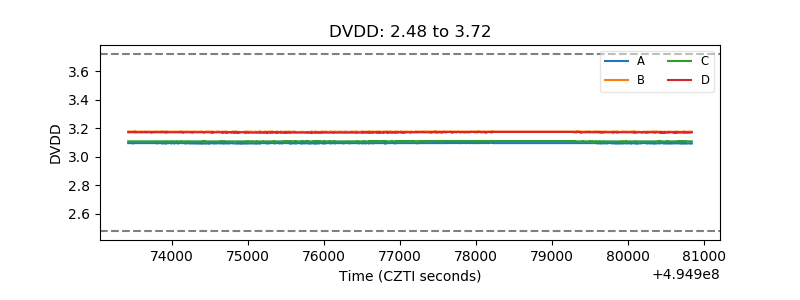 |
| Temperature 1 | 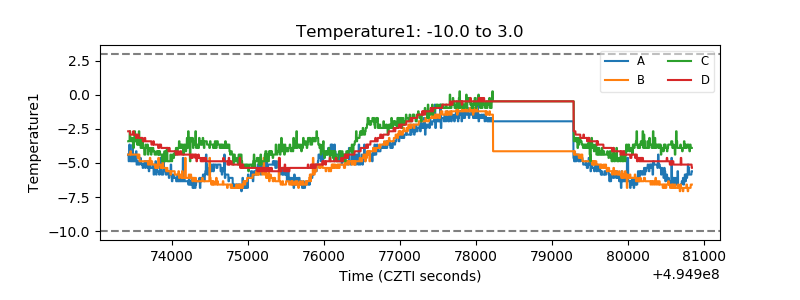 |
| Veto HV Monitor | 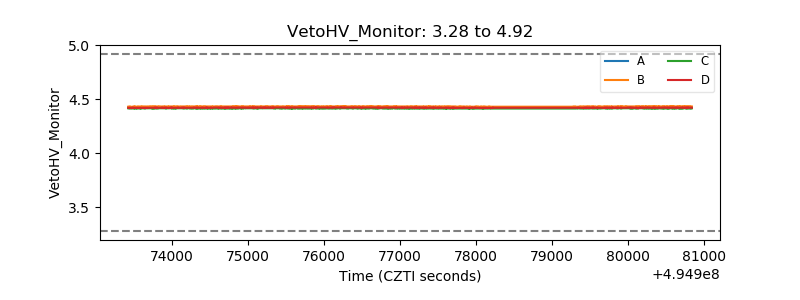 |
| Veto LLD | 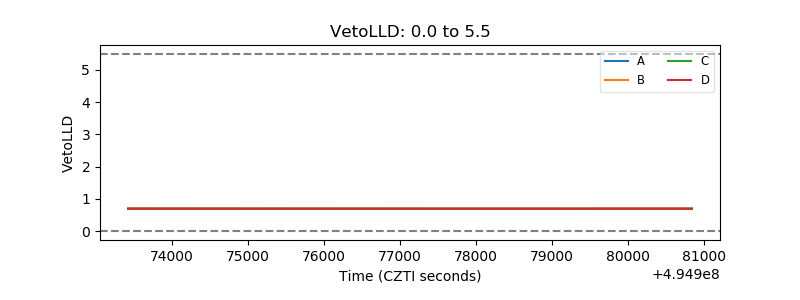 |
| Alpha Counter | 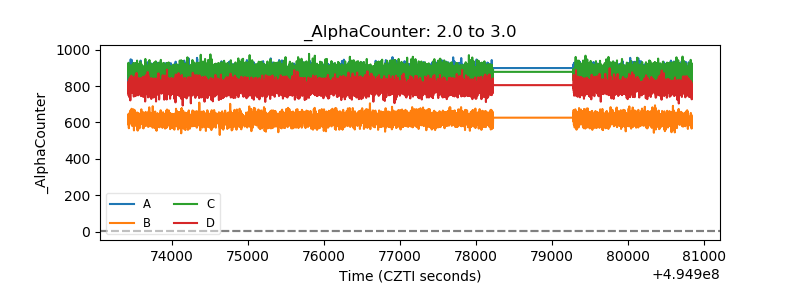 |
| _CPM_Rate | 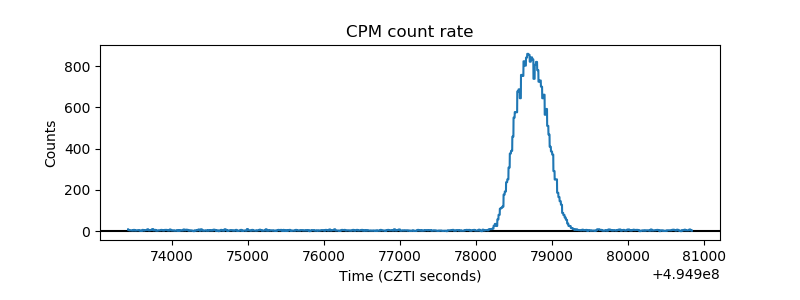 |
| CZT Counter | 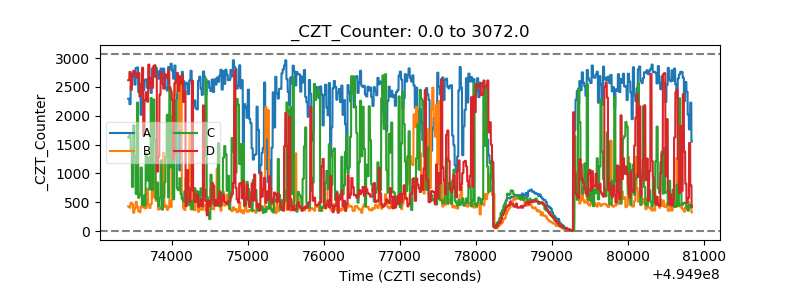 |
| +2.5 Volts monitor |  |
| +5 Volts monitor |  |
| _ROLL_ROT | 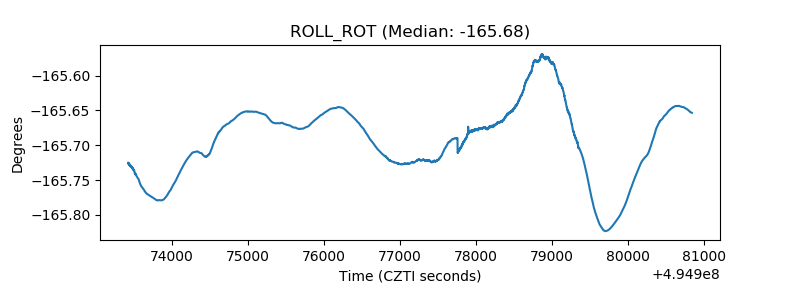 |
| _Roll_DEC | 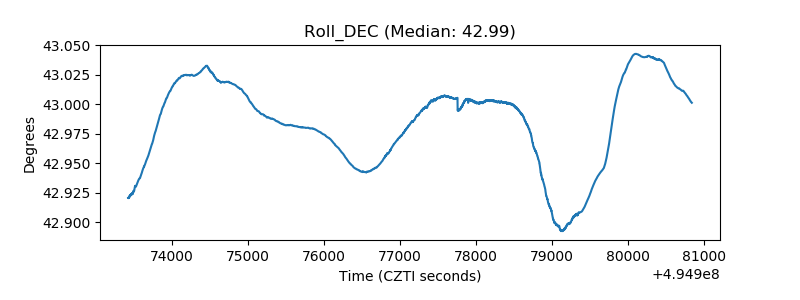 |
| _Roll_RA | 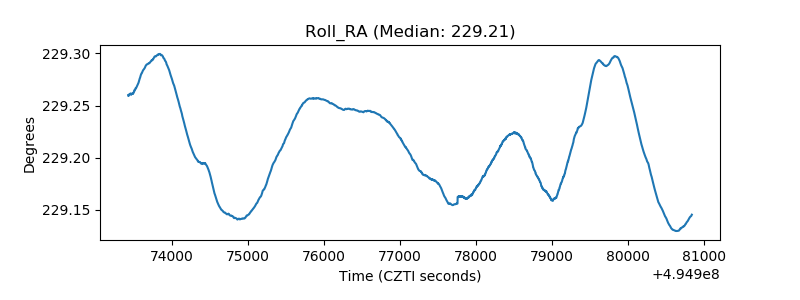 |
| Veto Counter | 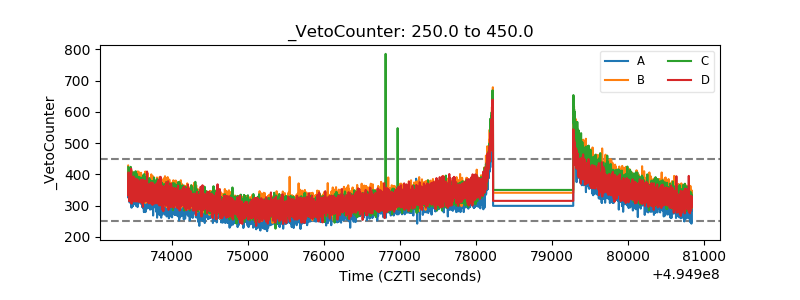 |