| Param | Original file | Final file |
|---|---|---|
| Filename | modeM0/AS1A14_022T04_9000006506_53803cztM0_level2.fits | modeM0/AS1A14_022T04_9000006506_53803cztM0_level2_quad_clean.evt |
| Size (bytes) | 917,087,040 | 76,625,280 |
| Size | 874.6 MB | 73.1 MB |
| Events in quadrant A | 16,612,439 | 68,252 |
| Events in quadrant B | 3,666,758 | 698,498 |
| Events in quadrant C | 5,976,942 | 585,521 |
| Events in quadrant D | 7,171,935 | 499,824 |
| Mode M0 | |||
|---|---|---|---|
| Quadrant | BADHDUFLAG | Total packets | Discarded packets |
| A | 0 | 54006 | 2 |
| B | 0 | 15802 | 2 |
| C | 0 | 22437 | 2 |
| D | 0 | 26039 | 2 |
| Mode SS | |||
|---|---|---|---|
| Quadrant | BADHDUFLAG | Total packets | Discarded packets |
| A | 0 | 136 | 0 |
| B | 0 | 136 | 0 |
| C | 0 | 136 | 0 |
| D | 0 | 136 | 0 |
| Mode M9 | |||
|---|---|---|---|
| Quadrant | BADHDUFLAG | Total packets | Discarded packets |
| A | 0 | 12 | 0 |
| B | 0 | 12 | 0 |
| C | 0 | 12 | 0 |
| D | 0 | 12 | 0 |
| Quadrant | Total seconds | Saturated seconds | Saturation percentage |
|---|---|---|---|
| A | 6710 | 6103 | 90.953800% |
| B | 6711 | 160 | 2.384145% |
| C | 6710 | 638 | 9.508197% |
| D | 6710 | 1271 | 18.941878% |
Noise dominated data is calculated using 1-second bins in cleaned event files. If a bin has >2000 counts, and if more than 50% of those come from <1% of pixels, then it is considered to be noise-dominated and hence unusable.
| Quadrant | # 1 sec bins | Bins with >0 counts | Bins with >2000 counts | High rate bins dominated by noise | Noise dominated (total time) | Noise dominated (detector-on time) | Marked lightcurve |
|---|---|---|---|---|---|---|---|
| A | 7855 | 6711 | 5955 | 5955 | 75.81% | 88.73% | 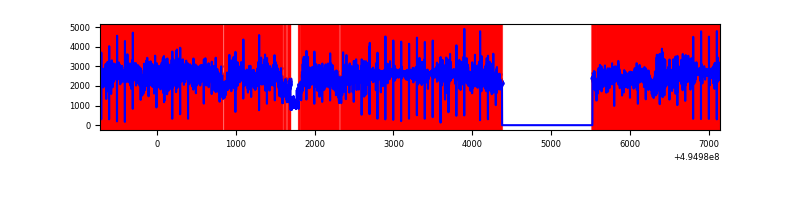 |
| B | 7856 | 6712 | 67 | 67 | 0.85% | 1.00% | 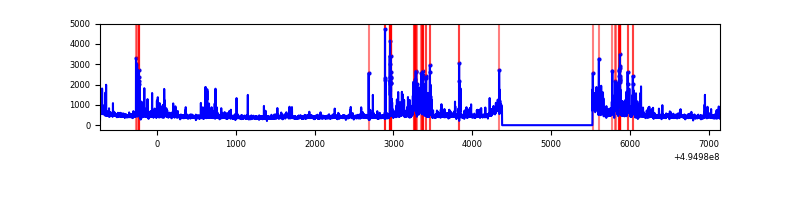 |
| C | 7855 | 6711 | 495 | 495 | 6.30% | 7.38% | 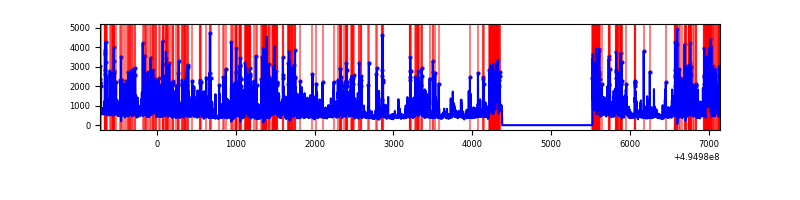 |
| D | 7855 | 6711 | 1030 | 1030 | 13.11% | 15.35% | 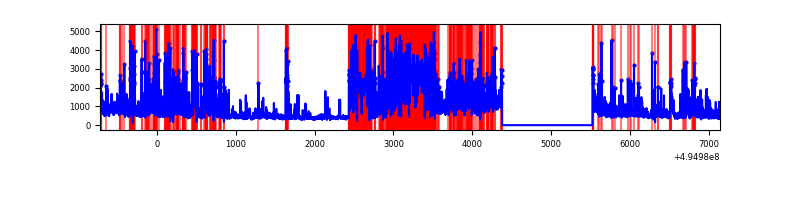 |
Top three noisy pixels from each quadrant. If the there are fewer than three noisy pixels in the level2.evt file, extra rows are filled as -1
| Pixel properties | Quadrant properties | ||||||
|---|---|---|---|---|---|---|---|
| Quadrant | DetID | PixID | Counts | Sigma | Mean | Median | Sigma |
| A | 3 | 63 | 14806289 | 154320.26 | 380 | 372 | 95.9 |
| A | 5 | 241 | 74215 | 769.66 | 380 | 372 | 95.9 |
| A | 8 | 249 | 59341 | 614.63 | 380 | 372 | 95.9 |
| B | 5 | 185 | 453507 | 2992.79 | 712 | 686 | 151.3 |
| B | 8 | 234 | 188429 | 1240.83 | 712 | 686 | 151.3 |
| B | 0 | 213 | 110378 | 724.98 | 712 | 686 | 151.3 |
| C | 15 | 224 | 2748559 | 14715.99 | 679 | 675 | 186.7 |
| C | 12 | 2 | 111162 | 591.7 | 679 | 675 | 186.7 |
| C | 12 | 249 | 102858 | 547.23 | 679 | 675 | 186.7 |
| D | 8 | 176 | 2063083 | 11651.87 | 622 | 595 | 177.0 |
| D | 1 | 241 | 990491 | 5592.34 | 622 | 595 | 177.0 |
| D | 7 | 70 | 343882 | 1939.37 | 622 | 595 | 177.0 |
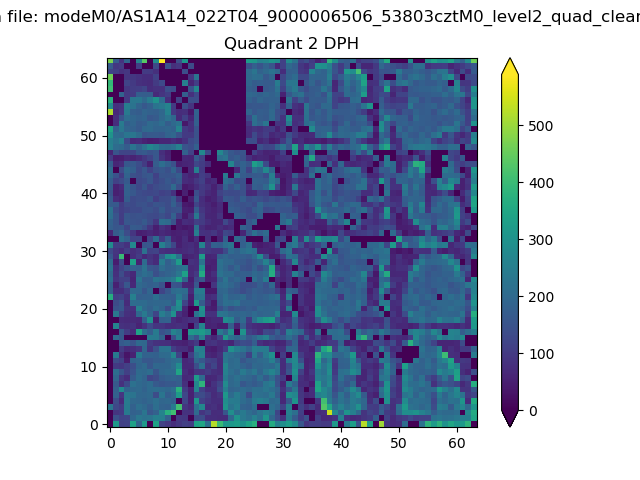
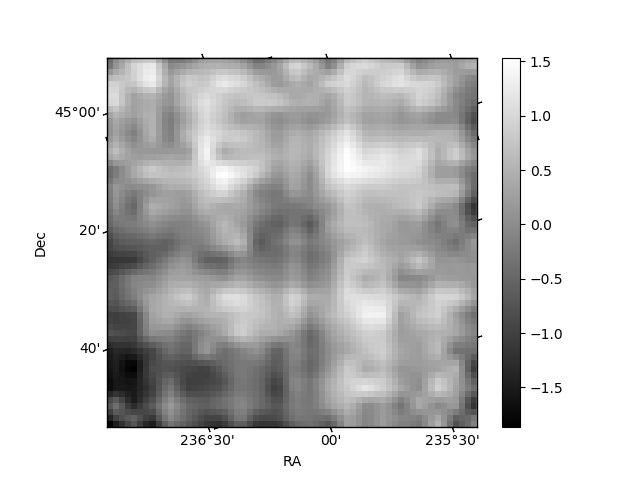
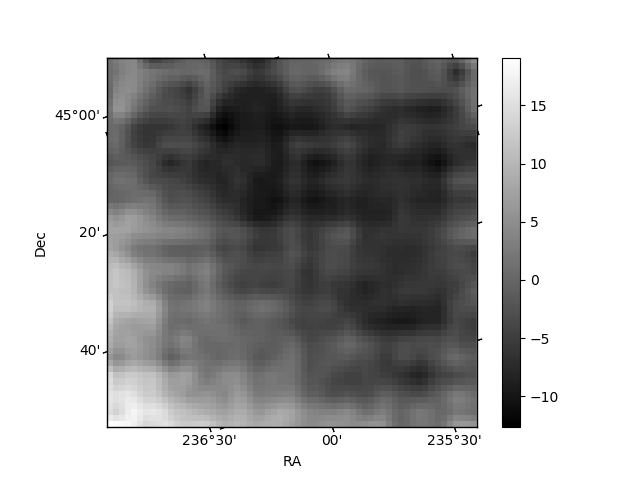
Histogram calculated using DETX and DETY for each event in the final _common_clean file
| Quadrant A | 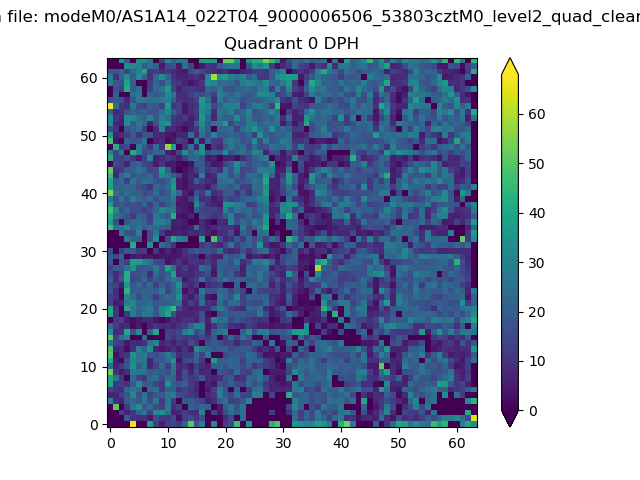 |
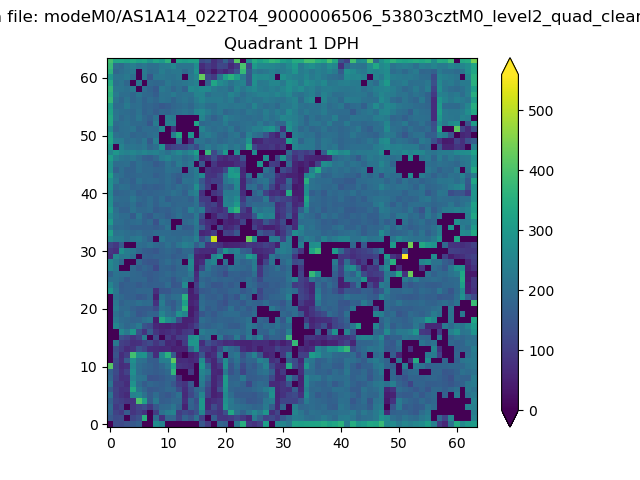 |
Quadrant B |
|---|---|---|---|
| Quadrant D | 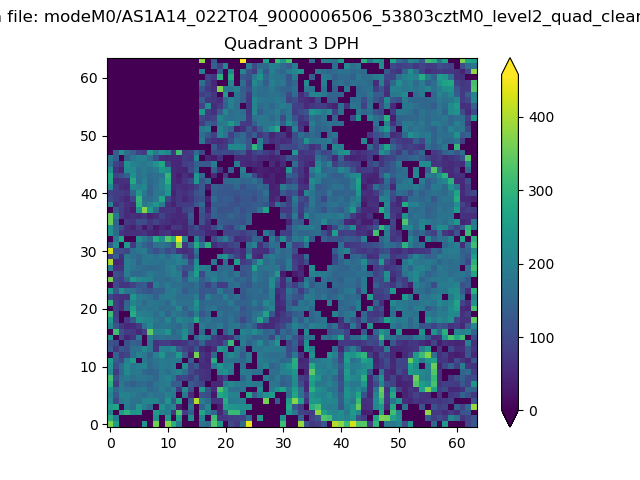 |
 |
Quadrant C |
| Plot type | Count rate plots | Images |
|---|---|---|
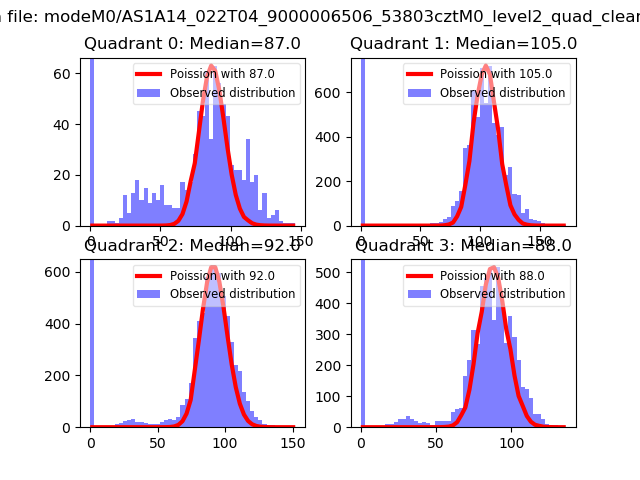
| Comparison with Poisson distribution Blue bars denote a histogram of data divided into 1 sec bins. Red curve is a Poisson curve with rate = median count rate of data. |
 |
 |
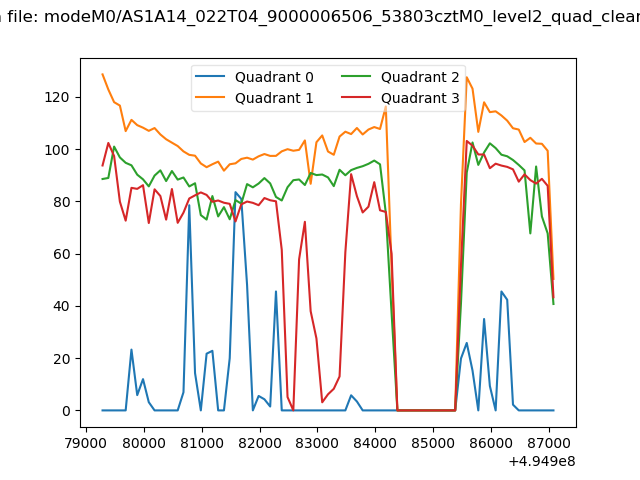
| Quadrant-wise count rates Data is divided into 100 sec bins |
 |
|
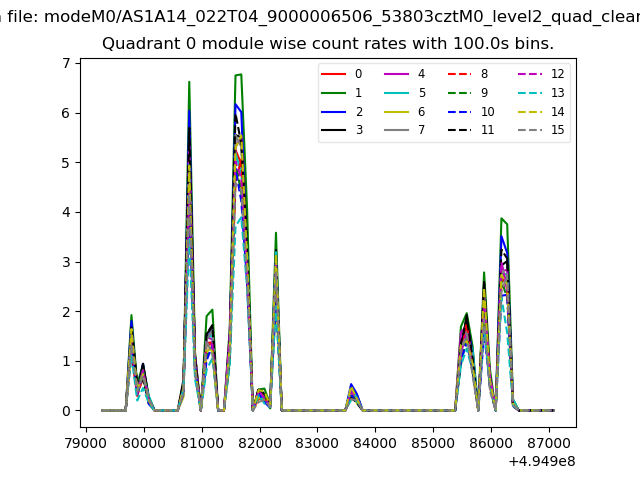
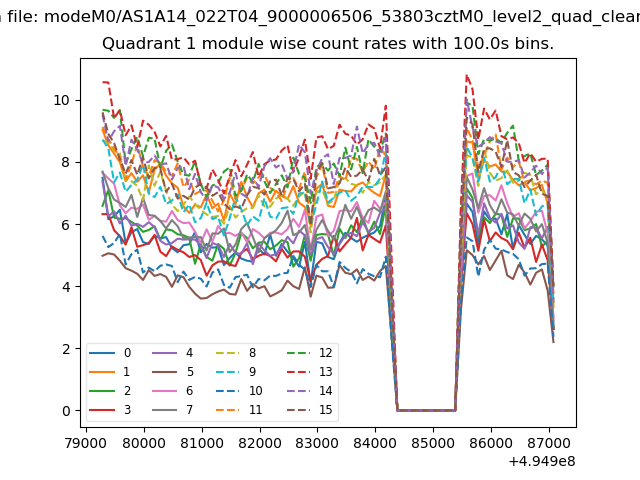
| Module-wise count rates for Quadrant A Data is divided into 100 sec bins |
 |
 |
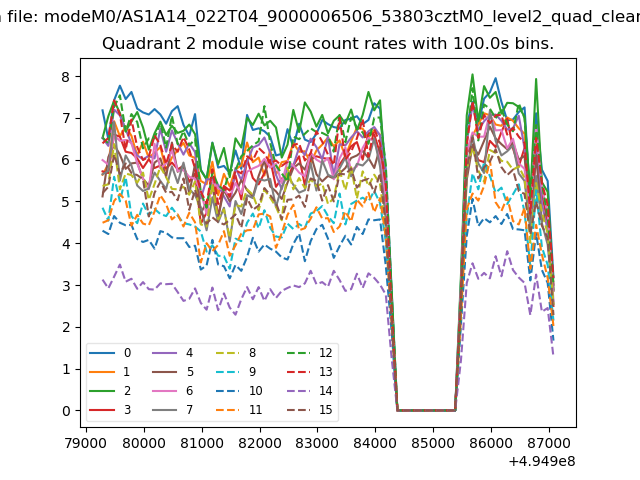
| Module-wise count rates for Quadrant B Data is divided into 100 sec bins |
 |
 |
| Module-wise count rates for Quadrant C Data is divided into 100 sec bins |
 |
 |
| Module-wise count rates for Quadrant D Data is divided into 100 sec bins |
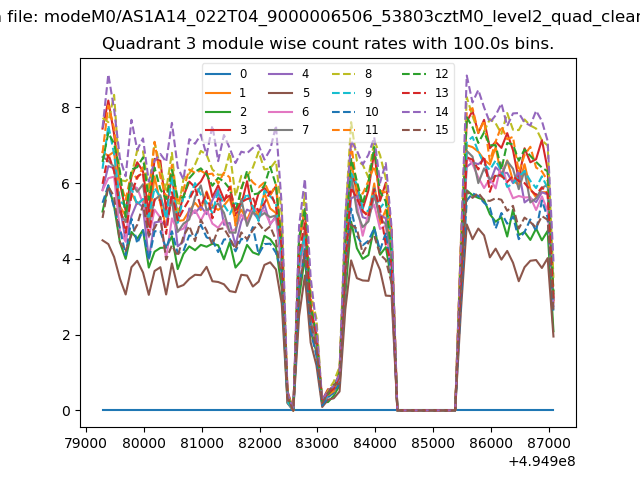 |
 |
| Parameter | Plot |
|---|---|
| CZT HV Monitor | 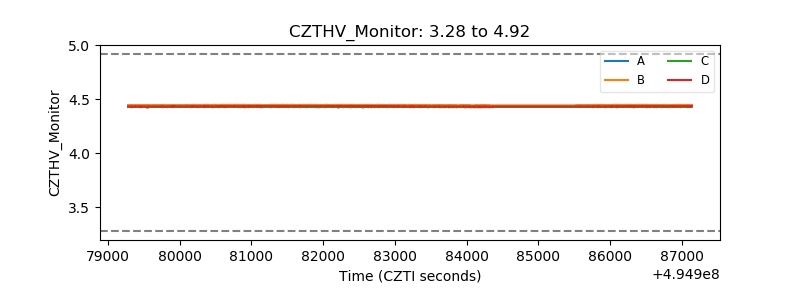 |
| D_VDD | 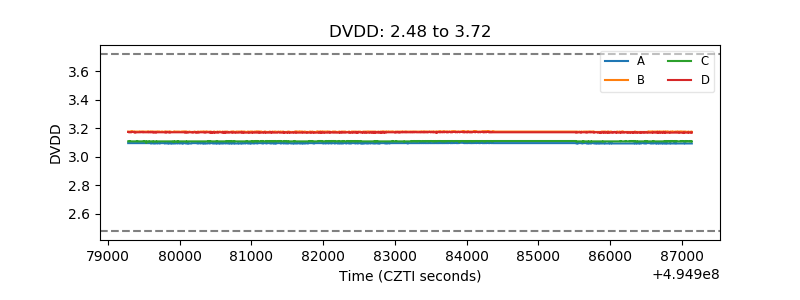 |
| Temperature 1 | 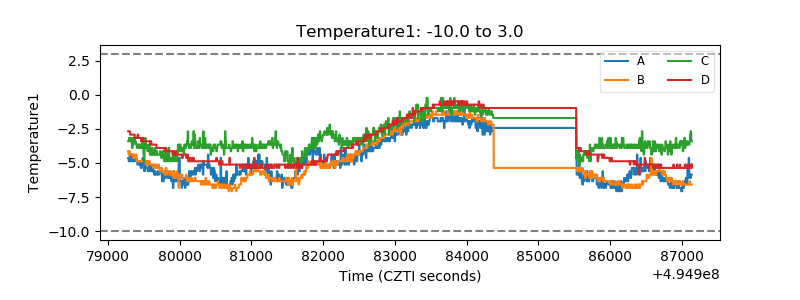 |
| Veto HV Monitor | 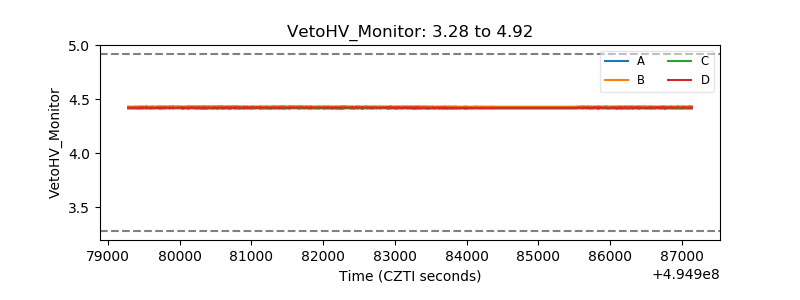 |
| Veto LLD | 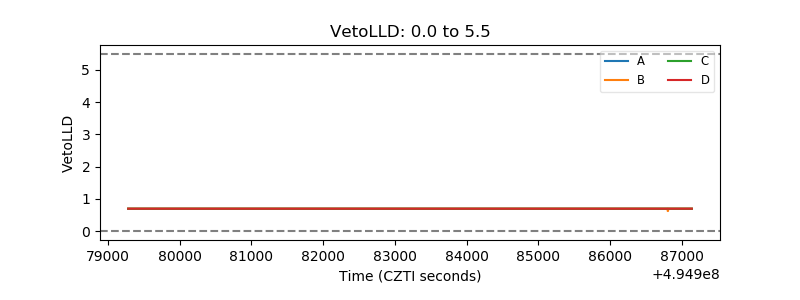 |
| Alpha Counter | 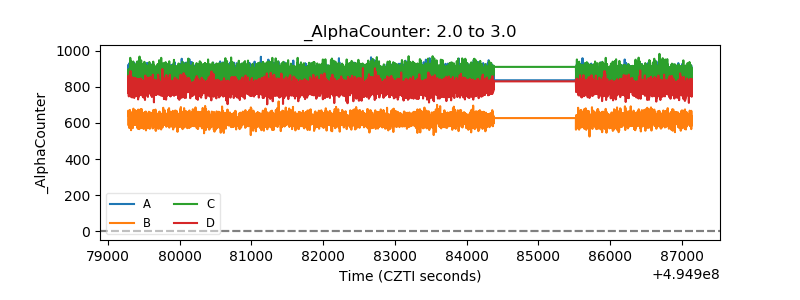 |
| _CPM_Rate | 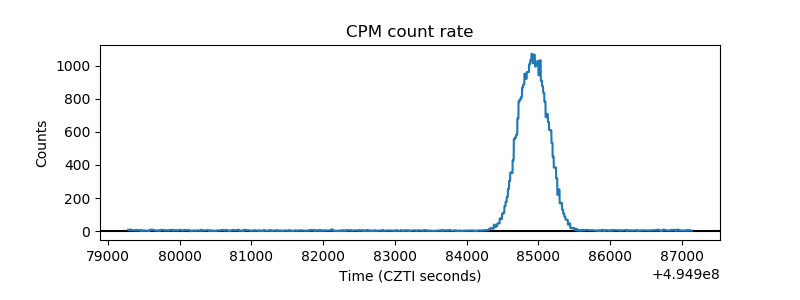 |
| CZT Counter | 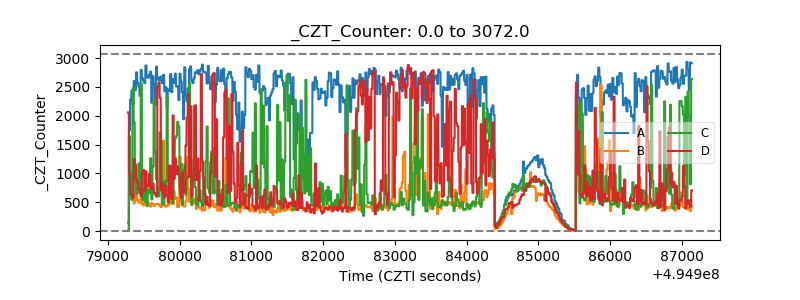 |
| +2.5 Volts monitor |  |
| +5 Volts monitor | 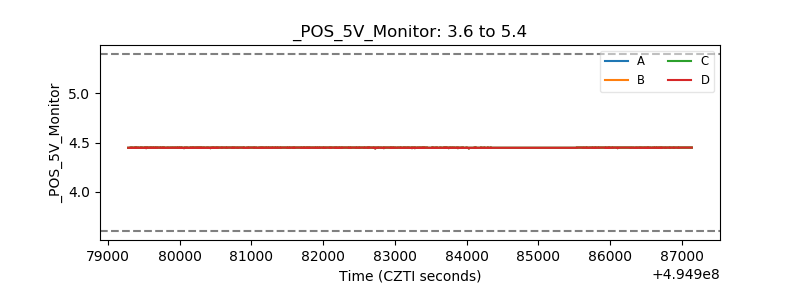 |
| _ROLL_ROT | 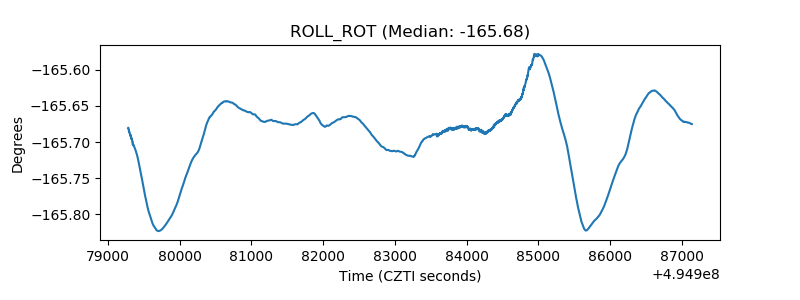 |
| _Roll_DEC | 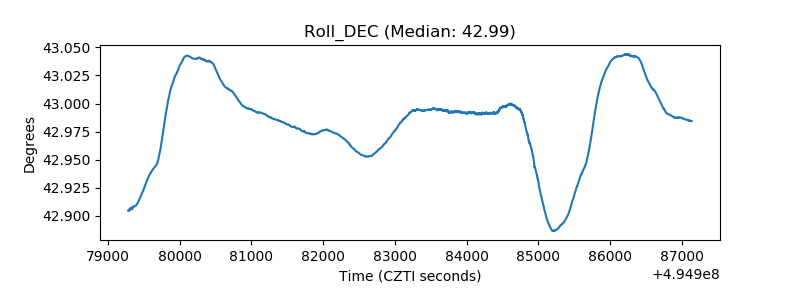 |
| _Roll_RA | 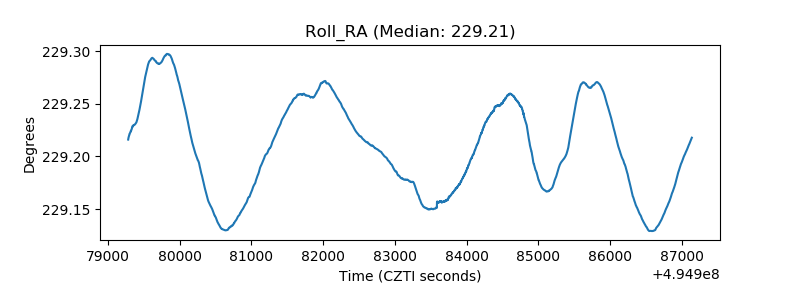 |
| Veto Counter | 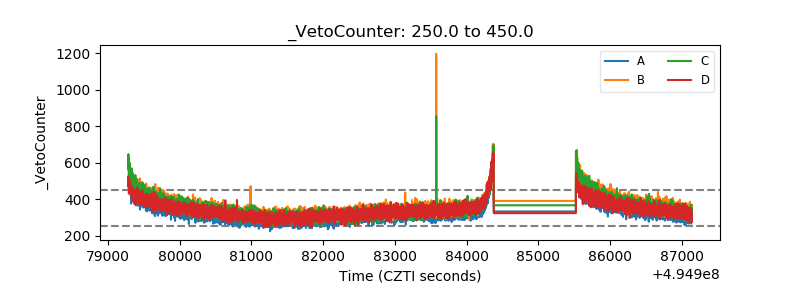 |