| Param | Original file | Final file |
|---|---|---|
| Filename | modeM0/AS1A14_022T04_9000006506_53804cztM0_level2.fits | modeM0/AS1A14_022T04_9000006506_53804cztM0_level2_quad_clean.evt |
| Size (bytes) | 833,261,760 | 70,997,760 |
| Size | 794.7 MB | 67.7 MB |
| Events in quadrant A | 14,228,782 | 122,109 |
| Events in quadrant B | 3,296,755 | 635,006 |
| Events in quadrant C | 5,562,724 | 526,619 |
| Events in quadrant D | 7,288,761 | 444,083 |
| Mode M0 | |||
|---|---|---|---|
| Quadrant | BADHDUFLAG | Total packets | Discarded packets |
| A | 0 | 46402 | 3 |
| B | 0 | 14105 | 1 |
| C | 0 | 20647 | 1 |
| D | 0 | 25836 | 1 |
| Mode SS | |||
|---|---|---|---|
| Quadrant | BADHDUFLAG | Total packets | Discarded packets |
| A | 0 | 122 | 0 |
| B | 0 | 122 | 0 |
| C | 0 | 122 | 0 |
| D | 0 | 122 | 0 |
| Mode M9 | |||
|---|---|---|---|
| Quadrant | BADHDUFLAG | Total packets | Discarded packets |
| A | 0 | 12 | 0 |
| B | 0 | 12 | 0 |
| C | 0 | 12 | 0 |
| D | 0 | 12 | 0 |
| Quadrant | Total seconds | Saturated seconds | Saturation percentage |
|---|---|---|---|
| A | 6039 | 5029 | 83.275377% |
| B | 6040 | 140 | 2.317881% |
| C | 6040 | 667 | 11.043046% |
| D | 6040 | 1286 | 21.291391% |
Noise dominated data is calculated using 1-second bins in cleaned event files. If a bin has >2000 counts, and if more than 50% of those come from <1% of pixels, then it is considered to be noise-dominated and hence unusable.
| Quadrant | # 1 sec bins | Bins with >0 counts | Bins with >2000 counts | High rate bins dominated by noise | Noise dominated (total time) | Noise dominated (detector-on time) | Marked lightcurve |
|---|---|---|---|---|---|---|---|
| A | 7244 | 6040 | 4942 | 4942 | 68.22% | 81.82% | 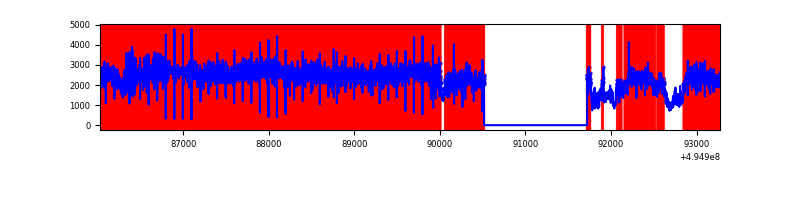 |
| B | 7245 | 6041 | 71 | 71 | 0.98% | 1.18% | 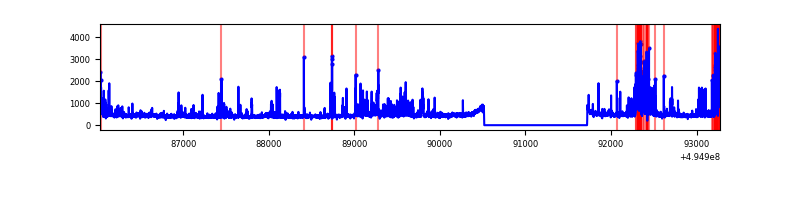 |
| C | 7245 | 6041 | 557 | 557 | 7.69% | 9.22% | 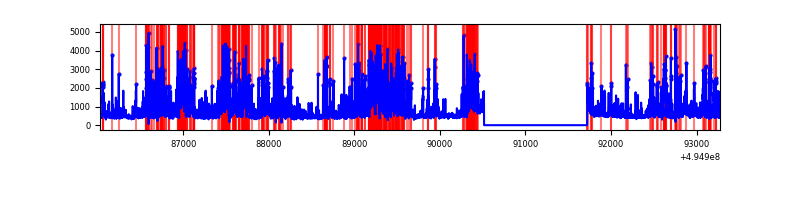 |
| D | 7245 | 6041 | 1184 | 1184 | 16.34% | 19.60% | 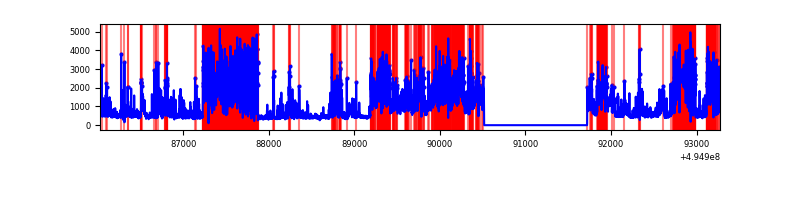 |
Top three noisy pixels from each quadrant. If the there are fewer than three noisy pixels in the level2.evt file, extra rows are filled as -1
| Pixel properties | Quadrant properties | ||||||
|---|---|---|---|---|---|---|---|
| Quadrant | DetID | PixID | Counts | Sigma | Mean | Median | Sigma |
| A | 3 | 63 | 12241442 | 116217.01 | 419 | 410 | 105.3 |
| A | 3 | 78 | 115784 | 1095.37 | 419 | 410 | 105.3 |
| A | 5 | 241 | 85290 | 805.86 | 419 | 410 | 105.3 |
| B | 5 | 185 | 641610 | 4644.35 | 644 | 621 | 138.0 |
| B | 8 | 234 | 45575 | 325.72 | 644 | 621 | 138.0 |
| B | 0 | 213 | 27070 | 191.64 | 644 | 621 | 138.0 |
| C | 15 | 224 | 2578893 | 15401.83 | 607 | 603 | 167.4 |
| C | 12 | 2 | 156259 | 929.84 | 607 | 603 | 167.4 |
| C | 12 | 249 | 133782 | 795.57 | 607 | 603 | 167.4 |
| D | 8 | 176 | 2122524 | 12919.2 | 566 | 540 | 164.3 |
| D | 1 | 241 | 1998115 | 12161.76 | 566 | 540 | 164.3 |
| D | 7 | 70 | 188295 | 1143.1 | 566 | 540 | 164.3 |
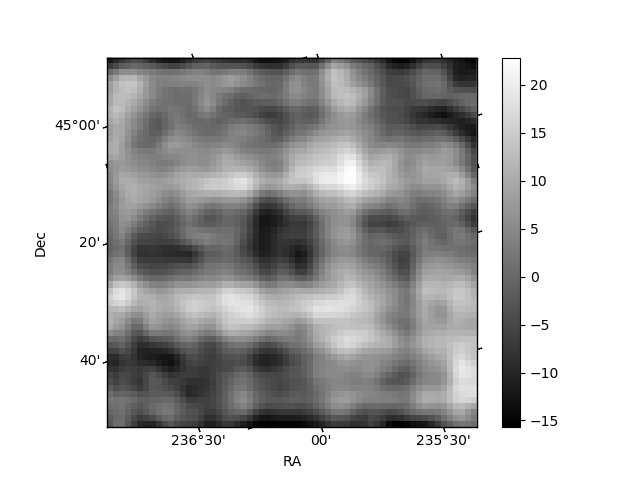
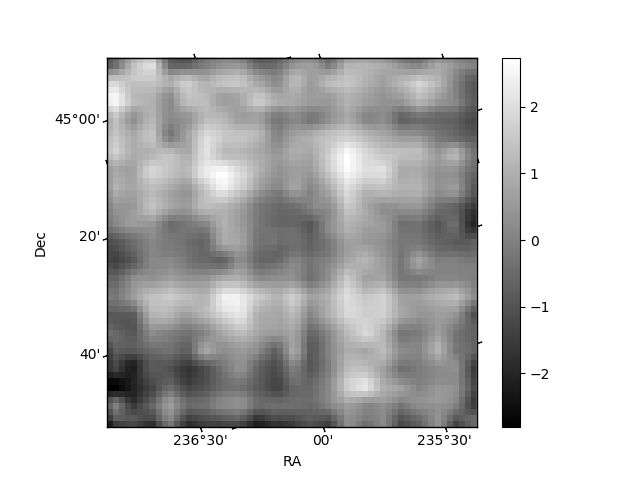
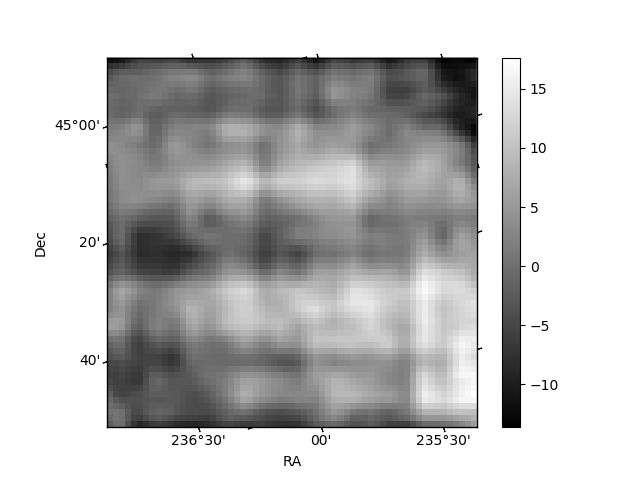
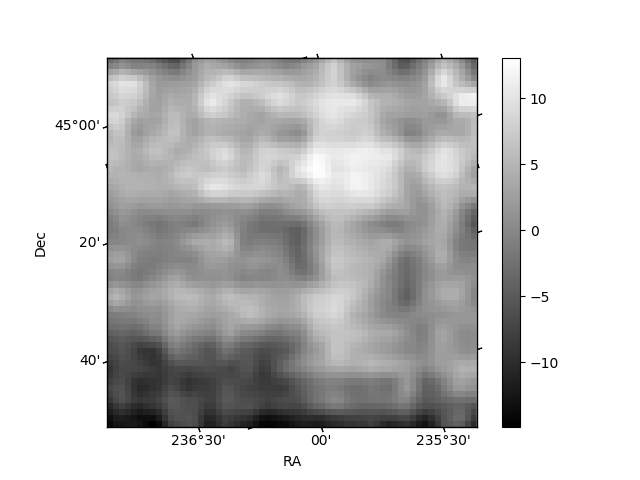
Histogram calculated using DETX and DETY for each event in the final _common_clean file
| Quadrant A | 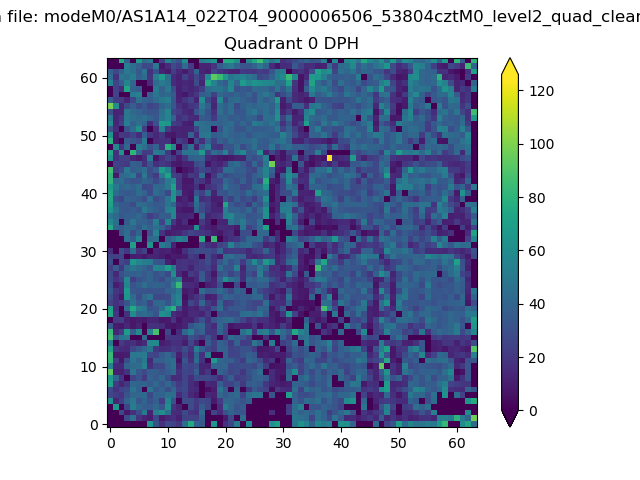 |
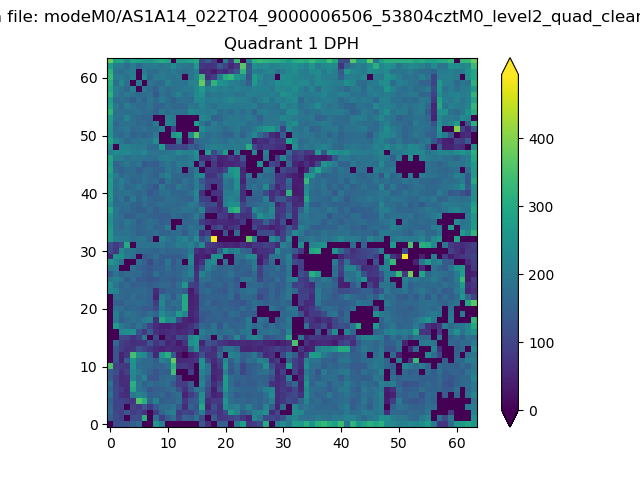 |
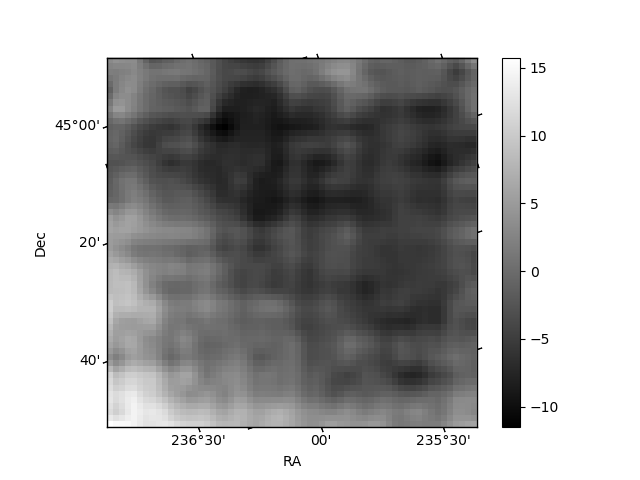
Quadrant B |
|---|---|---|---|
| Quadrant D | 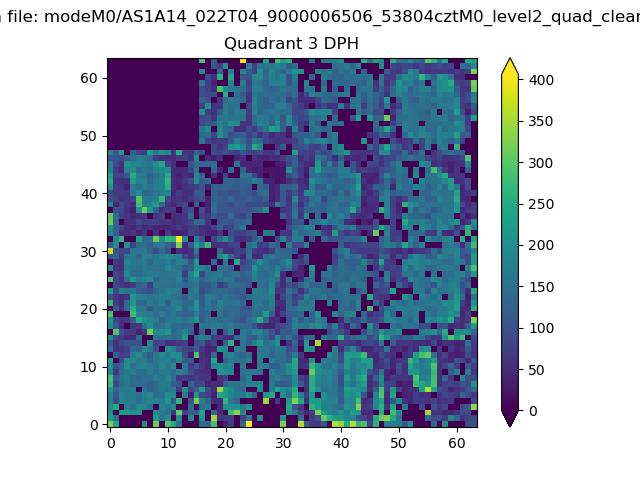 |
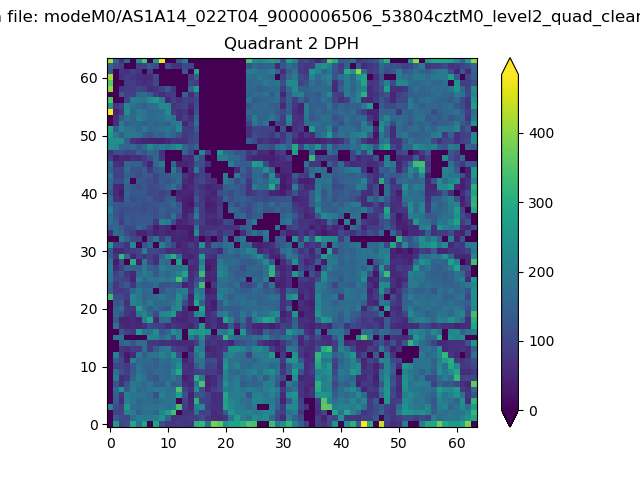 |
Quadrant C |
| Plot type | Count rate plots | Images |
|---|---|---|
| Comparison with Poisson distribution Blue bars denote a histogram of data divided into 1 sec bins. Red curve is a Poisson curve with rate = median count rate of data. |
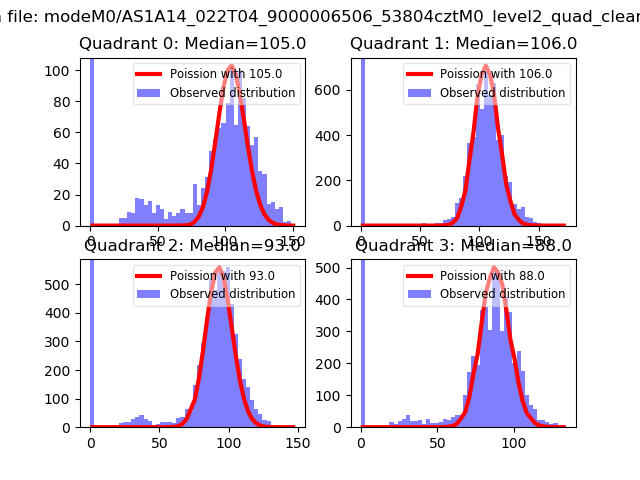 |
 |
| Quadrant-wise count rates Data is divided into 100 sec bins |
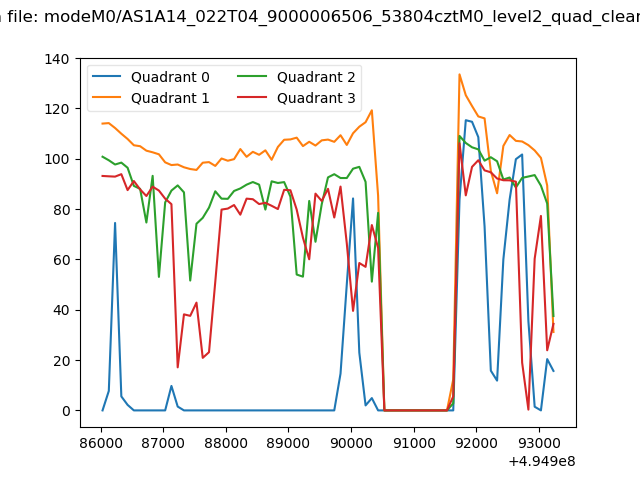 |
|
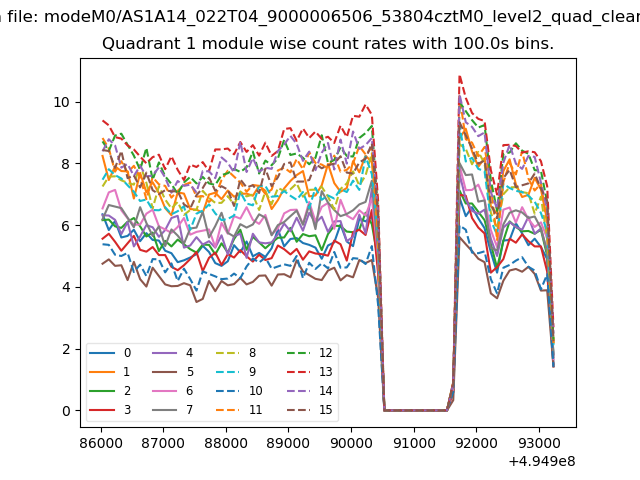
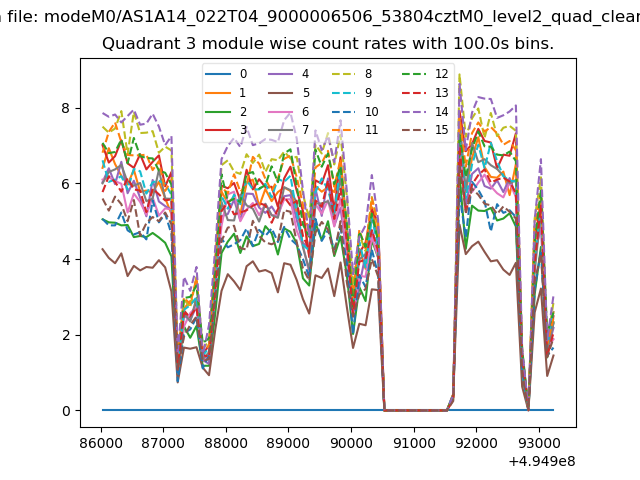
| Module-wise count rates for Quadrant A Data is divided into 100 sec bins |
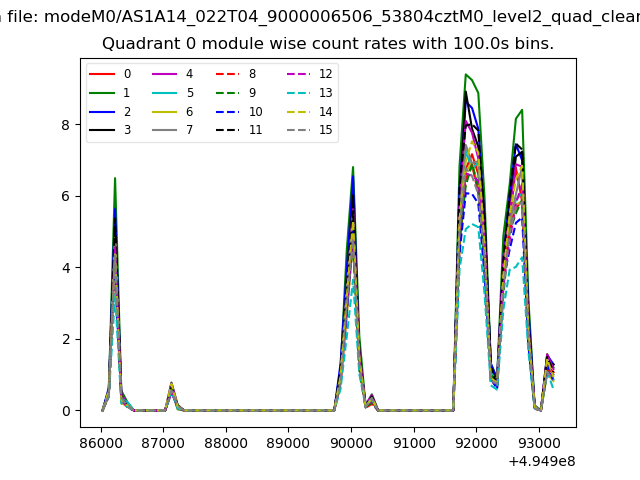 |
 |
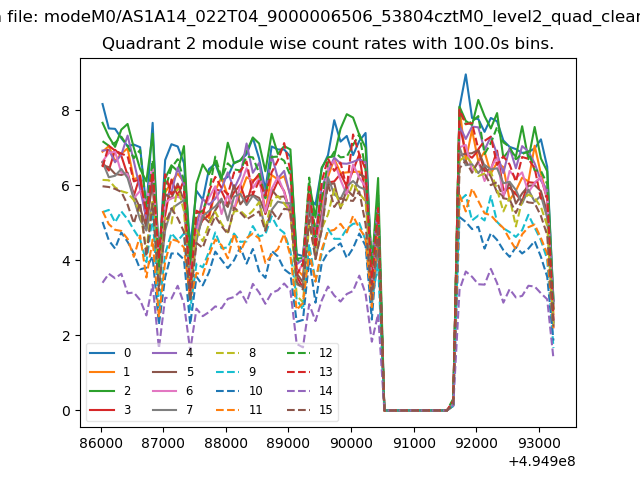
| Module-wise count rates for Quadrant B Data is divided into 100 sec bins |
 |
 |
| Module-wise count rates for Quadrant C Data is divided into 100 sec bins |
 |
 |
| Module-wise count rates for Quadrant D Data is divided into 100 sec bins |
 |
 |
| Parameter | Plot |
|---|---|
| CZT HV Monitor | 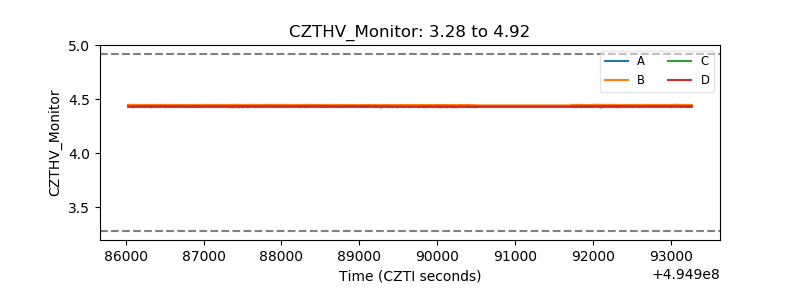 |
| D_VDD | 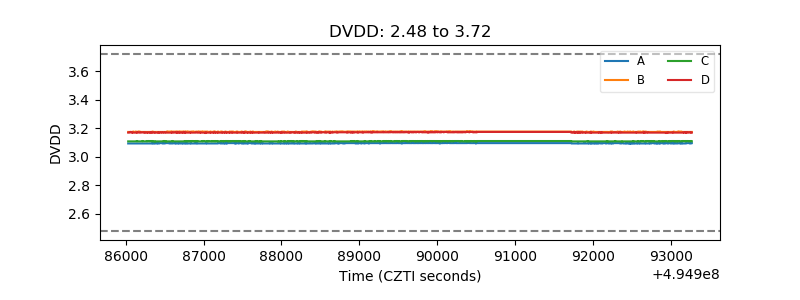 |
| Temperature 1 | 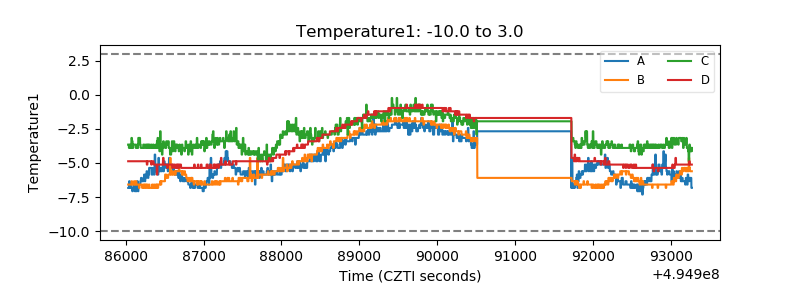 |
| Veto HV Monitor | 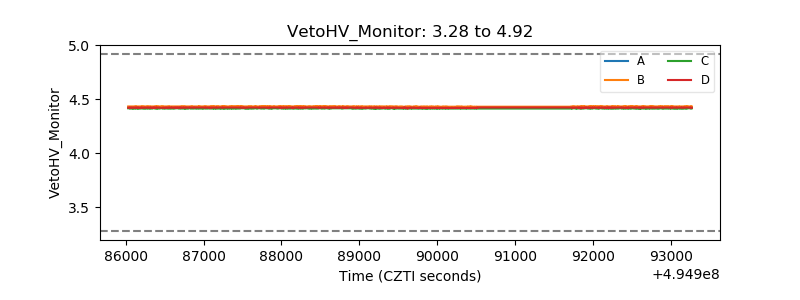 |
| Veto LLD | 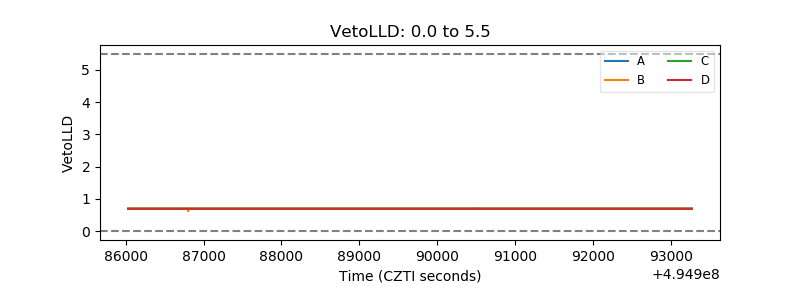 |
| Alpha Counter | 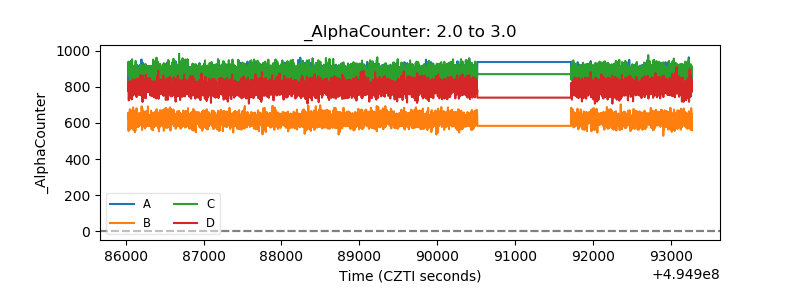 |
| _CPM_Rate |  |
| CZT Counter | 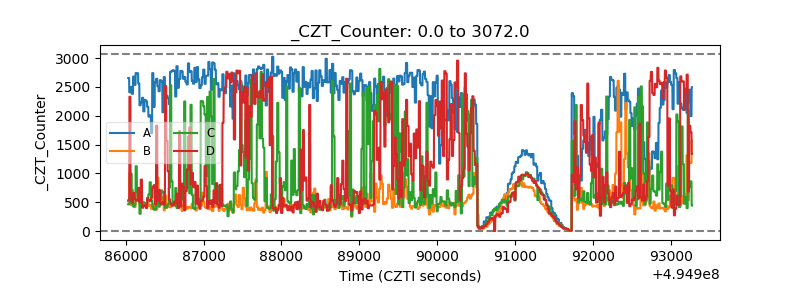 |
| +2.5 Volts monitor |  |
| +5 Volts monitor |  |
| _ROLL_ROT | 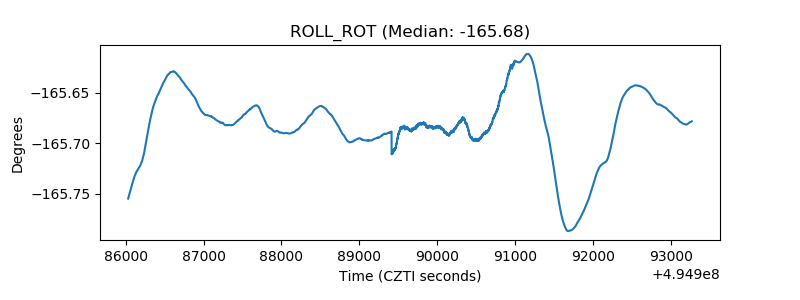 |
| _Roll_DEC | 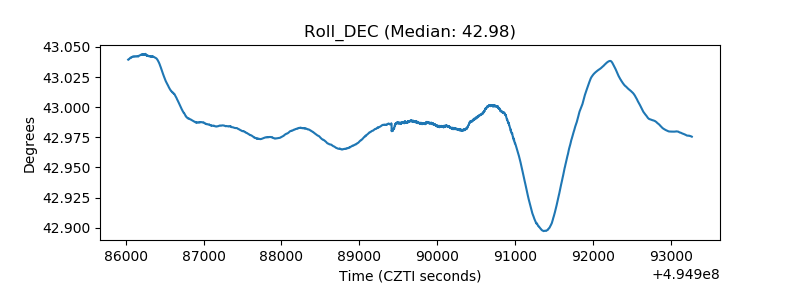 |
| _Roll_RA | 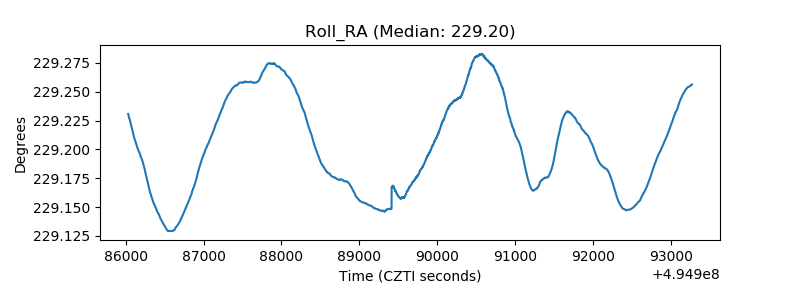 |
| Veto Counter | 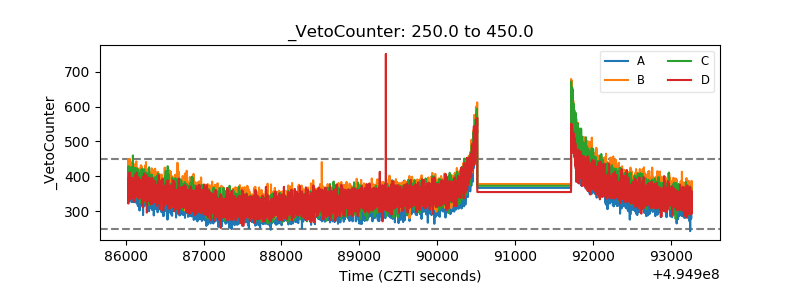 |