| Param | Original file | Final file |
|---|---|---|
| Filename | modeM0/AS1A14_022T04_9000006506_53806cztM0_level2.fits | modeM0/AS1A14_022T04_9000006506_53806cztM0_level2_quad_clean.evt |
| Size (bytes) | 1,007,187,840 | 62,945,280 |
| Size | 960.5 MB | 60.0 MB |
| Events in quadrant A | 15,821,369 | 10,724 |
| Events in quadrant B | 3,701,906 | 625,757 |
| Events in quadrant C | 7,980,004 | 458,106 |
| Events in quadrant D | 9,294,567 | 373,013 |
| Mode M0 | |||
|---|---|---|---|
| Quadrant | BADHDUFLAG | Total packets | Discarded packets |
| A | 0 | 52960 | 1622 |
| B | 0 | 15767 | 281 |
| C | 0 | 29405 | 1349 |
| D | 0 | 32634 | 704 |
| Mode SS | |||
|---|---|---|---|
| Quadrant | BADHDUFLAG | Total packets | Discarded packets |
| A | 0 | 131 | 5 |
| B | 0 | 131 | 5 |
| C | 0 | 132 | 4 |
| D | 0 | 132 | 4 |
| Mode M9 | |||
|---|---|---|---|
| Quadrant | BADHDUFLAG | Total packets | Discarded packets |
| A | 0 | 9 | 0 |
| B | 0 | 9 | 0 |
| C | 0 | 9 | 0 |
| D | 0 | 9 | 0 |
| Quadrant | Total seconds | Saturated seconds | Saturation percentage |
|---|---|---|---|
| A | 6236 | 6153 | 98.669019% |
| B | 6330 | 327 | 5.165877% |
| C | 6253 | 1622 | 25.939549% |
| D | 6274 | 2259 | 36.005738% |
Noise dominated data is calculated using 1-second bins in cleaned event files. If a bin has >2000 counts, and if more than 50% of those come from <1% of pixels, then it is considered to be noise-dominated and hence unusable.
| Quadrant | # 1 sec bins | Bins with >0 counts | Bins with >2000 counts | High rate bins dominated by noise | Noise dominated (total time) | Noise dominated (detector-on time) | Marked lightcurve |
|---|---|---|---|---|---|---|---|
| A | 7360 | 6262 | 5833 | 5833 | 79.25% | 93.15% | 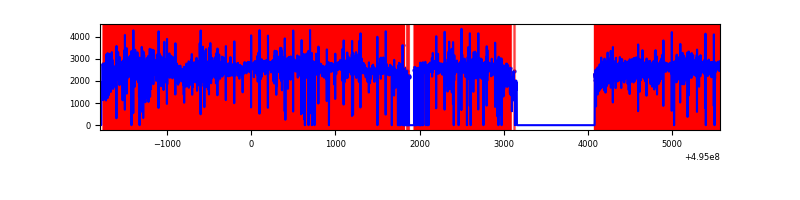 |
| B | 7368 | 6378 | 129 | 129 | 1.75% | 2.02% | 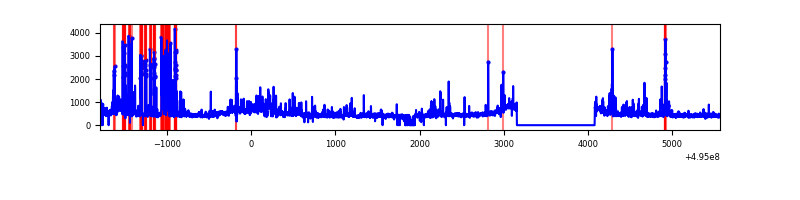 |
| C | 7363 | 6314 | 1166 | 1166 | 15.84% | 18.47% | 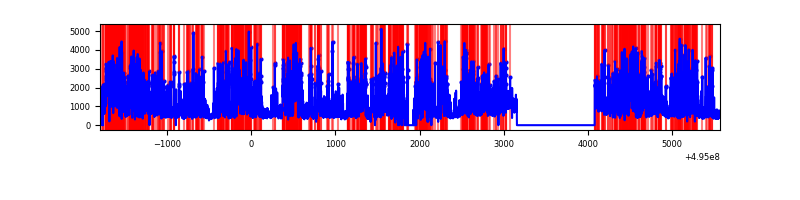 |
| D | 7369 | 6337 | 1887 | 1887 | 25.61% | 29.78% | 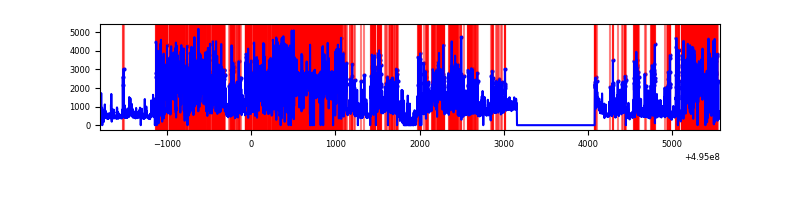 |
Top three noisy pixels from each quadrant. If the there are fewer than three noisy pixels in the level2.evt file, extra rows are filled as -1
| Pixel properties | Quadrant properties | ||||||
|---|---|---|---|---|---|---|---|
| Quadrant | DetID | PixID | Counts | Sigma | Mean | Median | Sigma |
| A | 3 | 63 | 14556675 | 221926.13 | 263 | 256 | 65.6 |
| A | 3 | 78 | 122573 | 1864.84 | 263 | 256 | 65.6 |
| A | 4 | 249 | 37794 | 572.3 | 263 | 256 | 65.6 |
| B | 5 | 185 | 573650 | 3961.89 | 675 | 652 | 144.6 |
| B | 5 | 172 | 373195 | 2575.88 | 675 | 652 | 144.6 |
| B | 0 | 213 | 31669 | 214.46 | 675 | 652 | 144.6 |
| C | 15 | 224 | 4980905 | 30425.53 | 596 | 588 | 163.7 |
| C | 12 | 2 | 254243 | 1549.62 | 596 | 588 | 163.7 |
| C | 7 | 64 | 112413 | 683.16 | 596 | 588 | 163.7 |
| D | 8 | 176 | 4211543 | 27761.14 | 535 | 511 | 151.7 |
| D | 1 | 241 | 1872031 | 12337.96 | 535 | 511 | 151.7 |
| D | 7 | 70 | 241985 | 1591.91 | 535 | 511 | 151.7 |
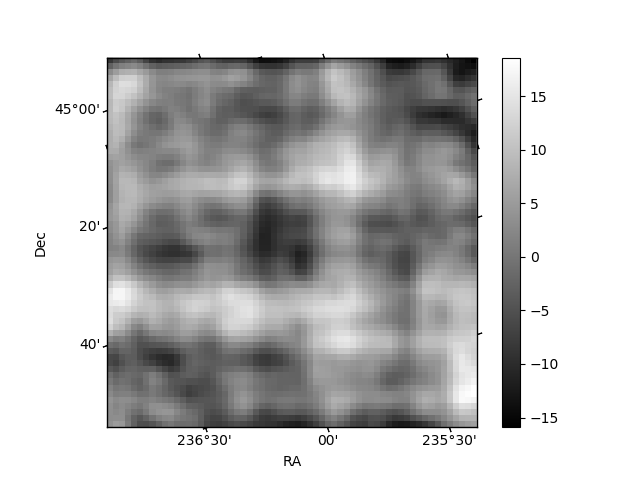
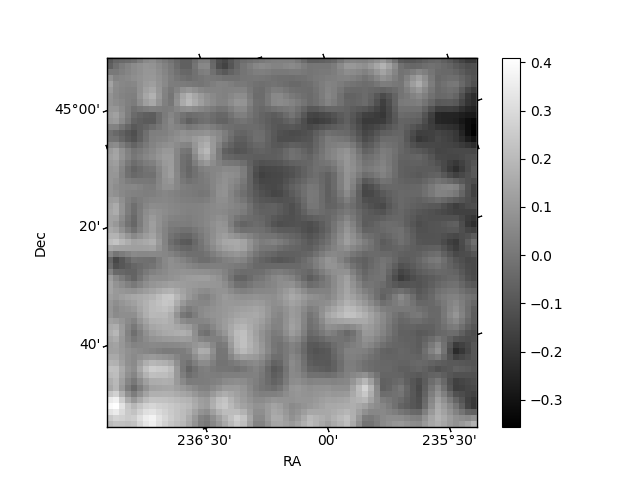
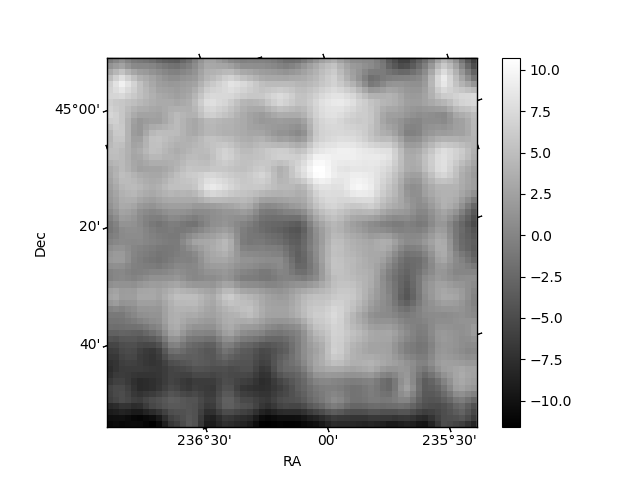
Histogram calculated using DETX and DETY for each event in the final _common_clean file
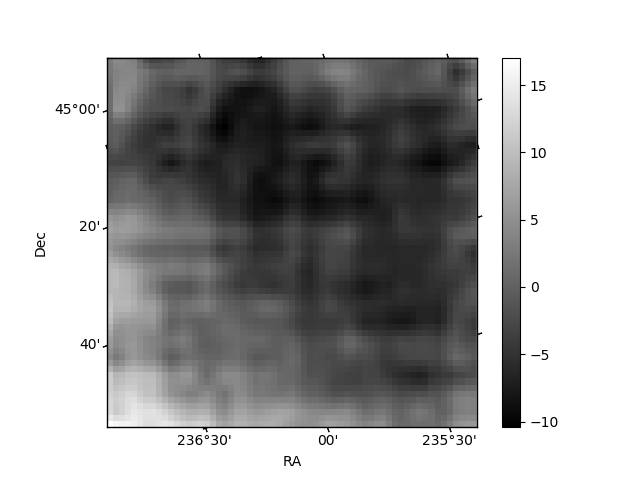
| Quadrant A | 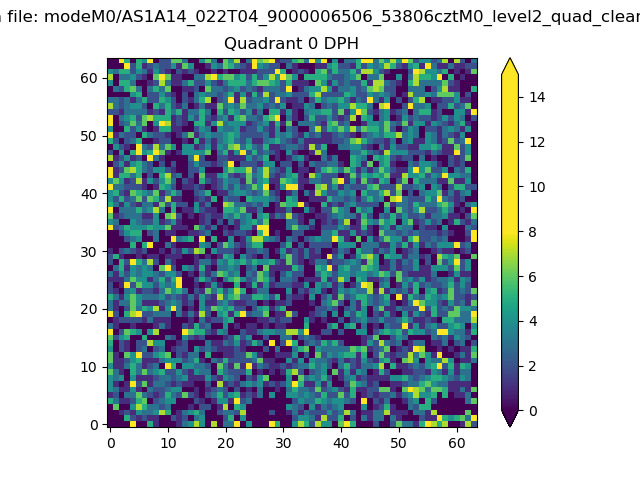 |
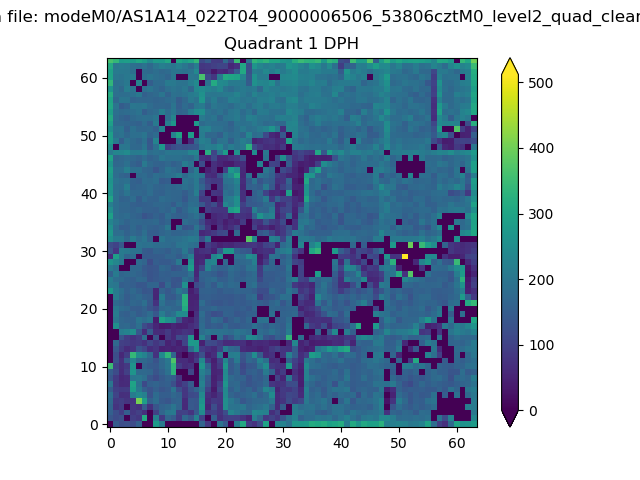 |
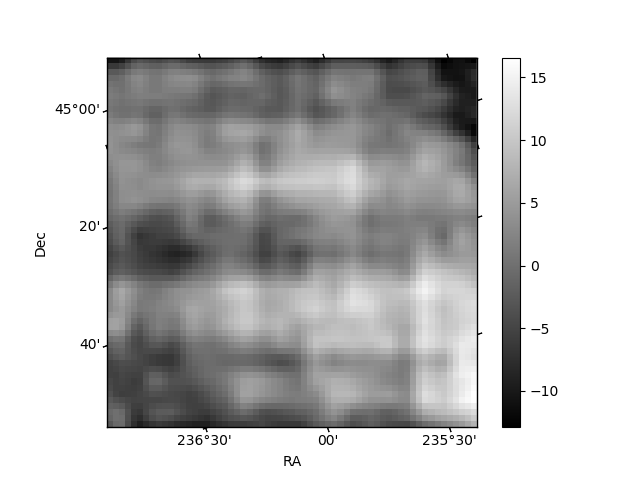
Quadrant B |
|---|---|---|---|
| Quadrant D | 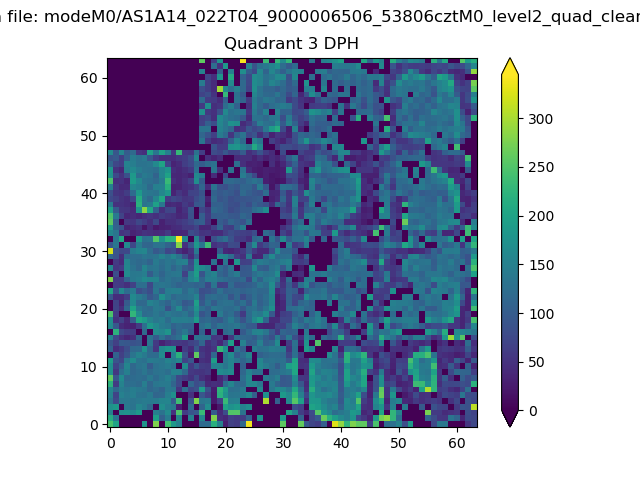 |
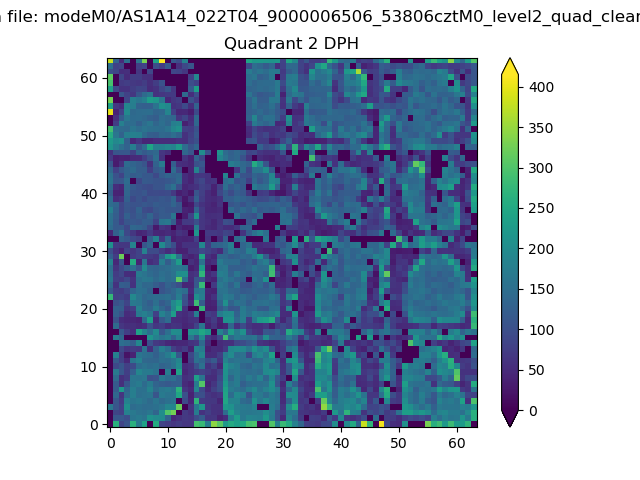 |
Quadrant C |
| Plot type | Count rate plots | Images |
|---|---|---|
| Comparison with Poisson distribution Blue bars denote a histogram of data divided into 1 sec bins. Red curve is a Poisson curve with rate = median count rate of data. |
 |
 |
| Quadrant-wise count rates Data is divided into 100 sec bins |
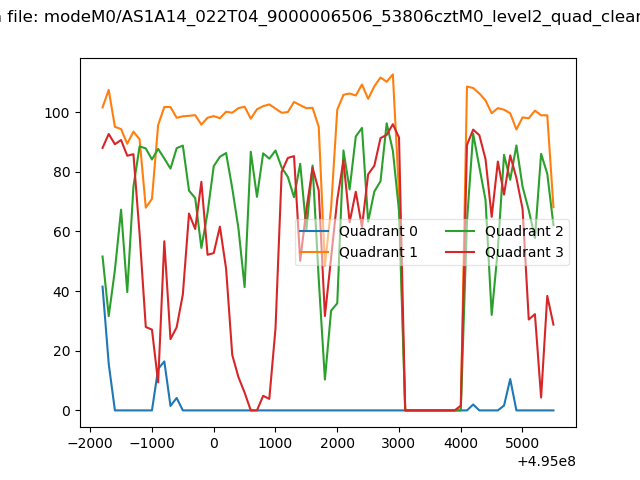 |
|
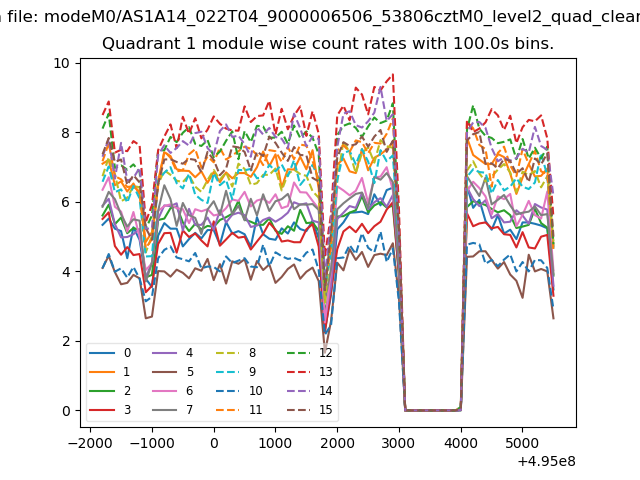
| Module-wise count rates for Quadrant A Data is divided into 100 sec bins |
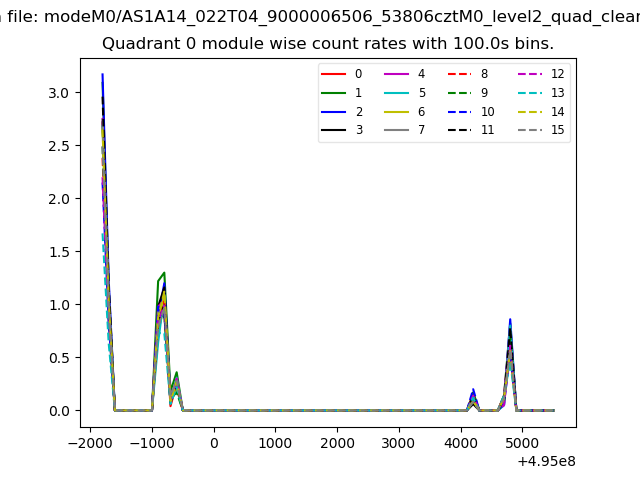 |
 |
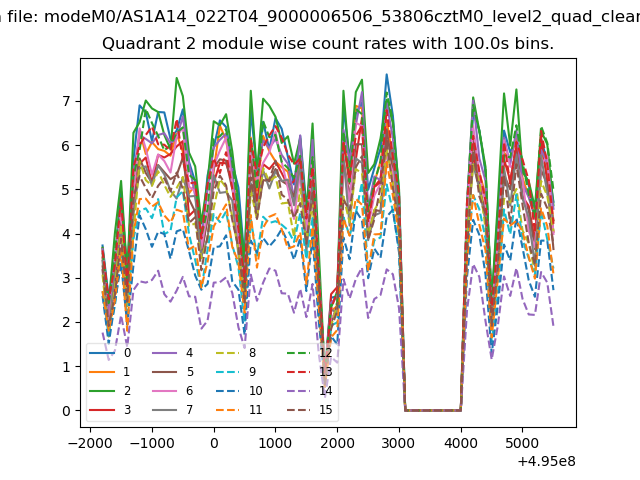
| Module-wise count rates for Quadrant B Data is divided into 100 sec bins |
 |
 |
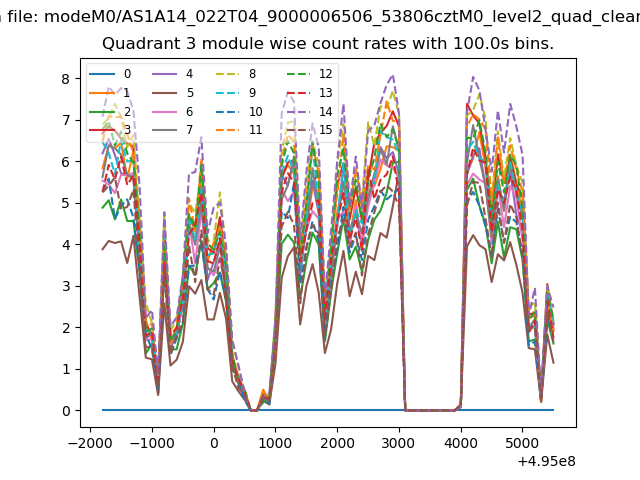
| Module-wise count rates for Quadrant C Data is divided into 100 sec bins |
 |
 |
| Module-wise count rates for Quadrant D Data is divided into 100 sec bins |
 |
 |
| Parameter | Plot |
|---|---|
| CZT HV Monitor | 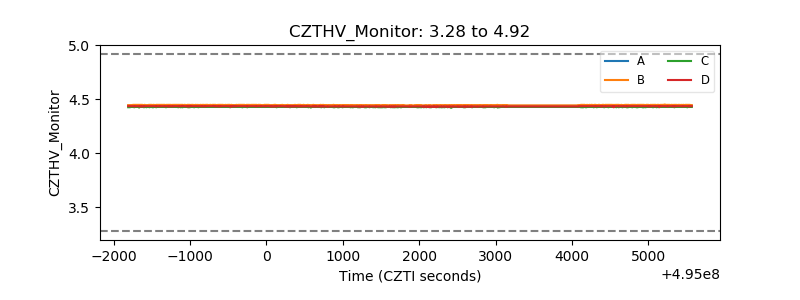 |
| D_VDD | 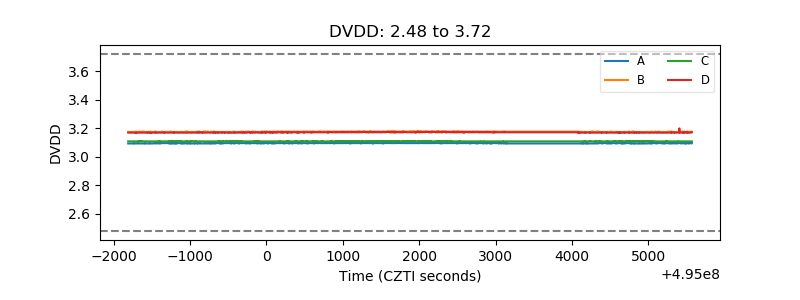 |
| Temperature 1 | 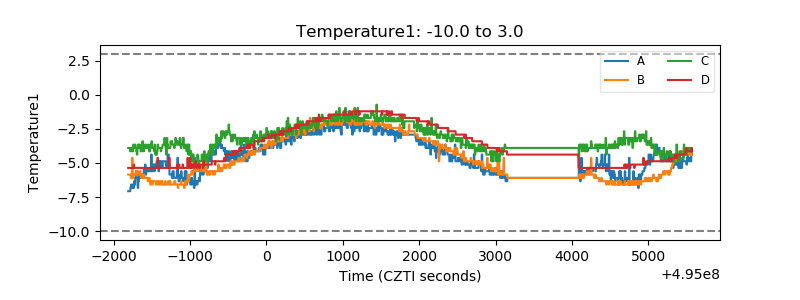 |
| Veto HV Monitor | 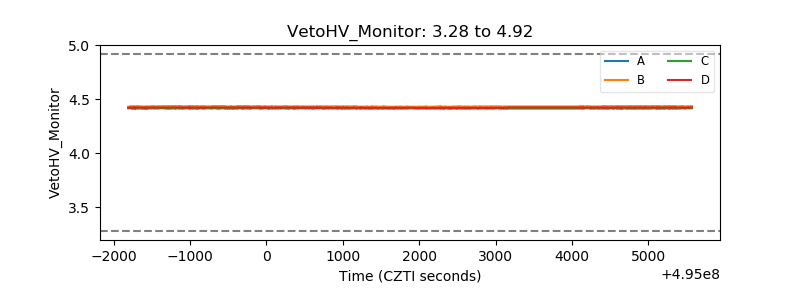 |
| Veto LLD | 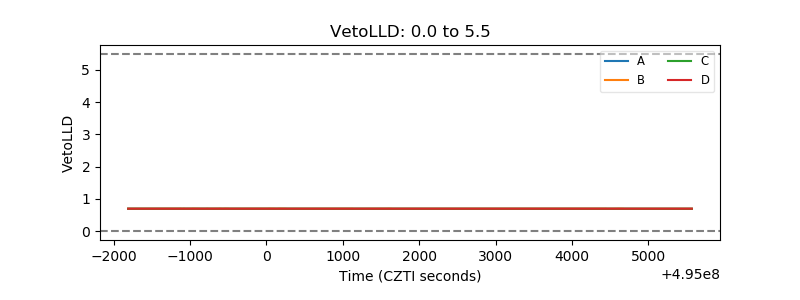 |
| Alpha Counter | 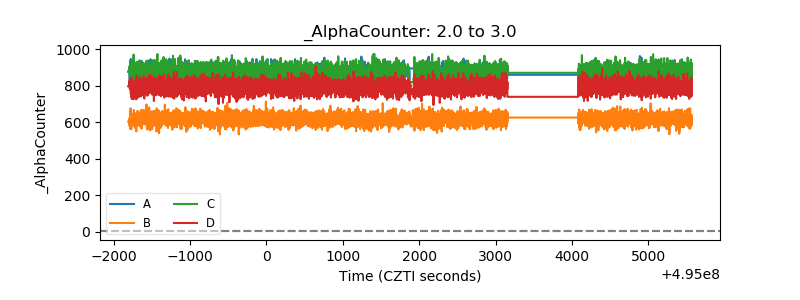 |
| _CPM_Rate | 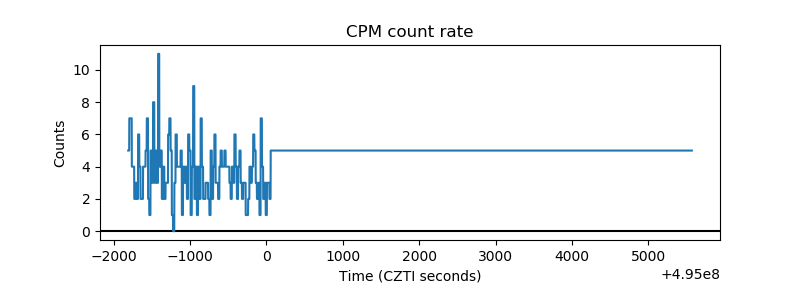 |
| CZT Counter | 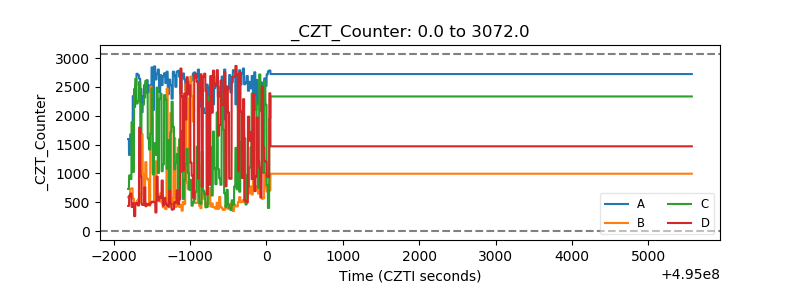 |
| +2.5 Volts monitor |  |
| +5 Volts monitor |  |
| _ROLL_ROT | 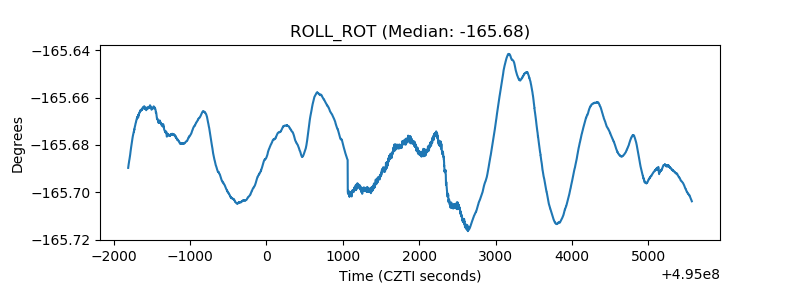 |
| _Roll_DEC | 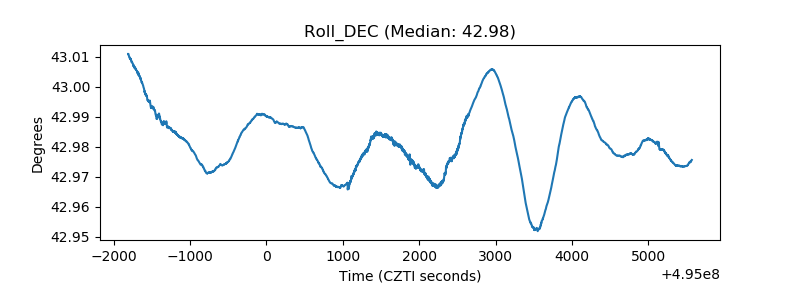 |
| _Roll_RA | 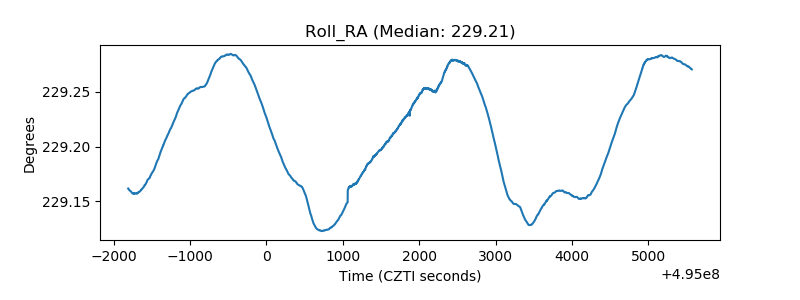 |
| Veto Counter | 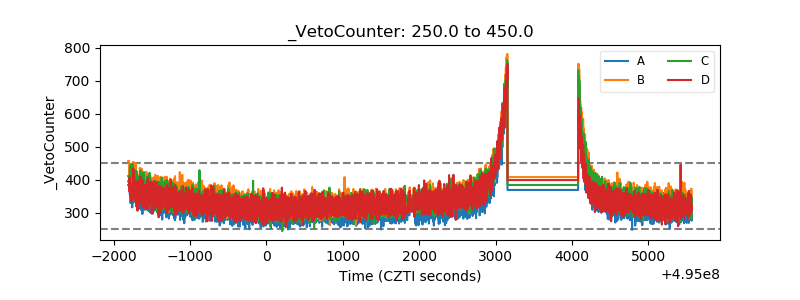 |