| Param | Original file | Final file |
|---|---|---|
| Filename | modeM0/AS1A14_022T04_9000006506_53807cztM0_level2.fits | modeM0/AS1A14_022T04_9000006506_53807cztM0_level2_quad_clean.evt |
| Size (bytes) | 989,426,880 | 73,909,440 |
| Size | 943.6 MB | 70.5 MB |
| Events in quadrant A | 14,155,003 | 242,401 |
| Events in quadrant B | 3,376,382 | 680,213 |
| Events in quadrant C | 7,799,647 | 515,341 |
| Events in quadrant D | 10,760,803 | 319,038 |
| Mode M0 | |||
|---|---|---|---|
| Quadrant | BADHDUFLAG | Total packets | Discarded packets |
| A | 0 | 46914 | 1 |
| B | 0 | 15186 | 1 |
| C | 0 | 27970 | 1 |
| D | 0 | 36684 | 1 |
| Mode SS | |||
|---|---|---|---|
| Quadrant | BADHDUFLAG | Total packets | Discarded packets |
| A | 0 | 140 | 0 |
| B | 0 | 140 | 0 |
| C | 0 | 140 | 0 |
| D | 0 | 140 | 0 |
| Mode M9 | |||
|---|---|---|---|
| Quadrant | BADHDUFLAG | Total packets | Discarded packets |
| A | 0 | 6 | 0 |
| B | 0 | 6 | 0 |
| C | 0 | 6 | 0 |
| D | 0 | 6 | 0 |
| Quadrant | Total seconds | Saturated seconds | Saturation percentage |
|---|---|---|---|
| A | 6895 | 4565 | 66.207397% |
| B | 6896 | 234 | 3.393271% |
| C | 6896 | 1443 | 20.925174% |
| D | 6896 | 3394 | 49.216937% |
Noise dominated data is calculated using 1-second bins in cleaned event files. If a bin has >2000 counts, and if more than 50% of those come from <1% of pixels, then it is considered to be noise-dominated and hence unusable.
| Quadrant | # 1 sec bins | Bins with >0 counts | Bins with >2000 counts | High rate bins dominated by noise | Noise dominated (total time) | Noise dominated (detector-on time) | Marked lightcurve |
|---|---|---|---|---|---|---|---|
| A | 7530 | 6896 | 4399 | 4399 | 58.42% | 63.79% | 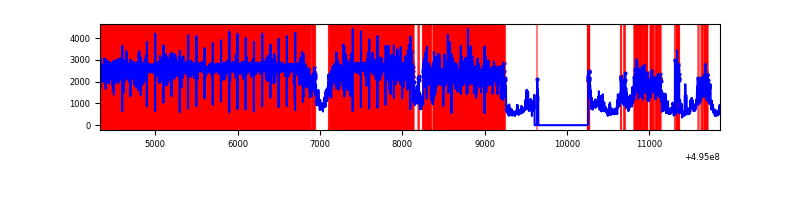 |
| B | 7531 | 6898 | 49 | 49 | 0.65% | 0.71% | 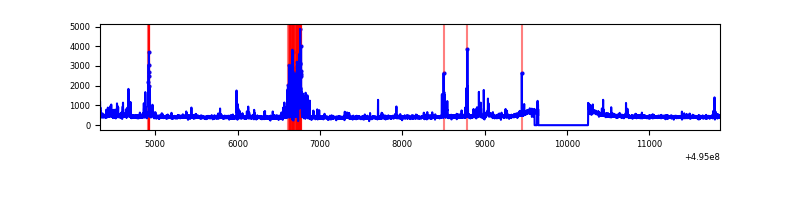 |
| C | 7531 | 6898 | 1030 | 1030 | 13.68% | 14.93% | 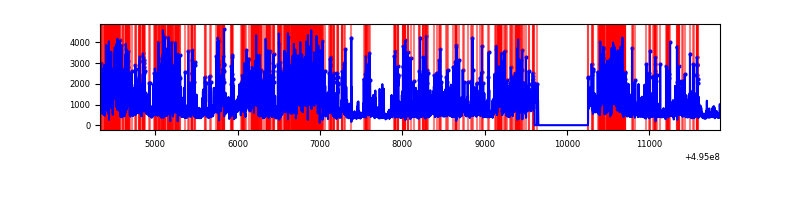 |
| D | 7530 | 6896 | 2622 | 2622 | 34.82% | 38.02% | 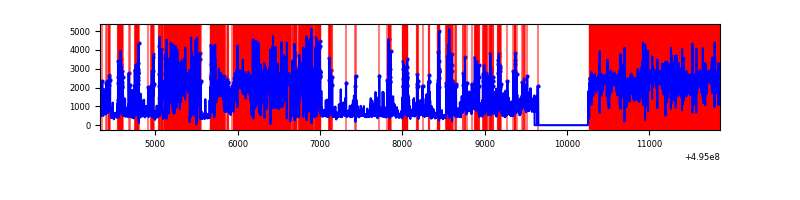 |
Top three noisy pixels from each quadrant. If the there are fewer than three noisy pixels in the level2.evt file, extra rows are filled as -1
| Pixel properties | Quadrant properties | ||||||
|---|---|---|---|---|---|---|---|
| Quadrant | DetID | PixID | Counts | Sigma | Mean | Median | Sigma |
| A | 3 | 63 | 11803887 | 97970.24 | 487 | 473 | 120.5 |
| A | 8 | 249 | 142658 | 1180.16 | 487 | 473 | 120.5 |
| A | 2 | 143 | 101492 | 838.47 | 487 | 473 | 120.5 |
| B | 5 | 185 | 343993 | 2204.9 | 724 | 695 | 155.7 |
| B | 0 | 213 | 48372 | 306.21 | 724 | 695 | 155.7 |
| B | 7 | 252 | 31255 | 196.28 | 724 | 695 | 155.7 |
| C | 15 | 224 | 4364310 | 24358.89 | 651 | 646 | 179.1 |
| C | 12 | 2 | 241535 | 1344.69 | 651 | 646 | 179.1 |
| C | 1 | 16 | 189543 | 1054.46 | 651 | 646 | 179.1 |
| D | 8 | 176 | 7245902 | 56671.16 | 450 | 430 | 127.9 |
| D | 1 | 241 | 474665 | 3709.28 | 450 | 430 | 127.9 |
| D | 7 | 70 | 262978 | 2053.54 | 450 | 430 | 127.9 |
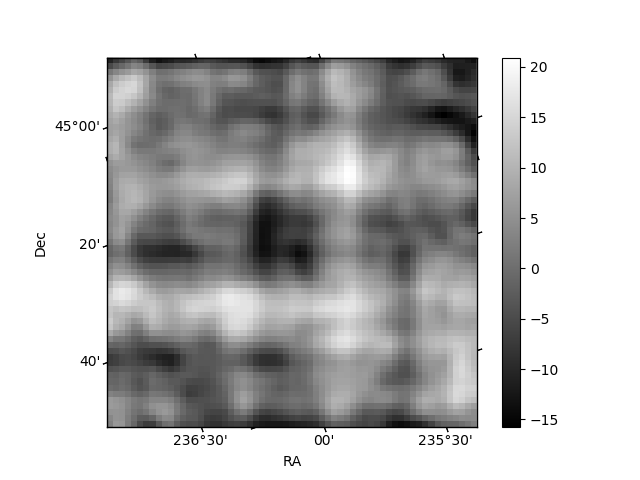
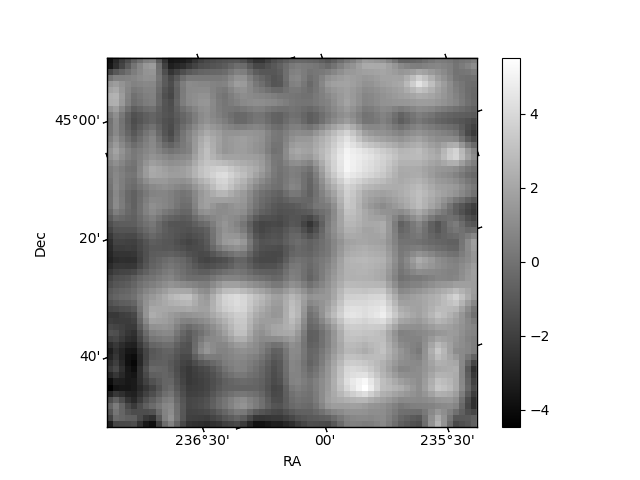
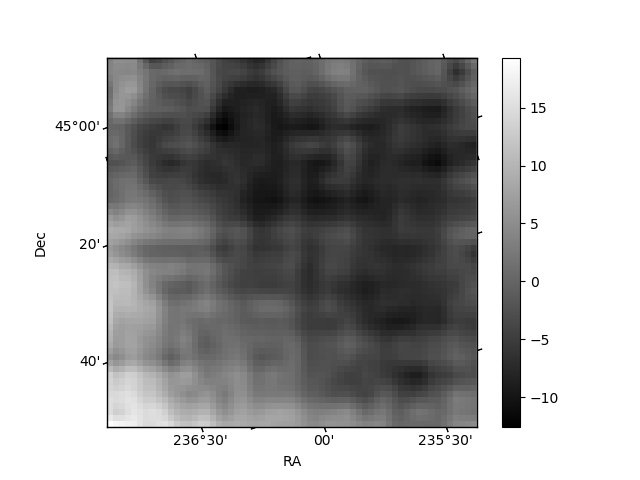
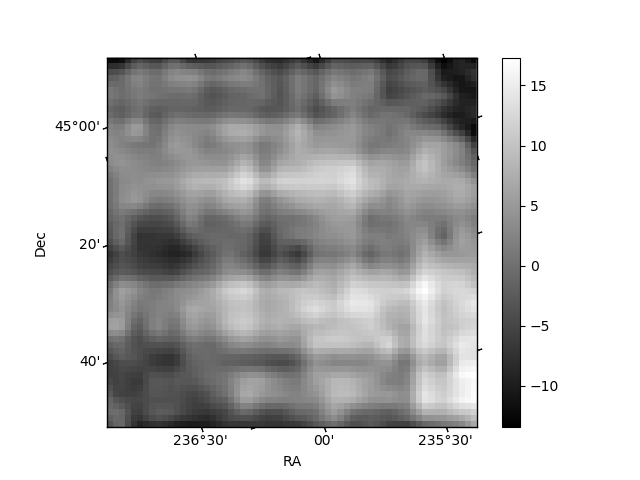
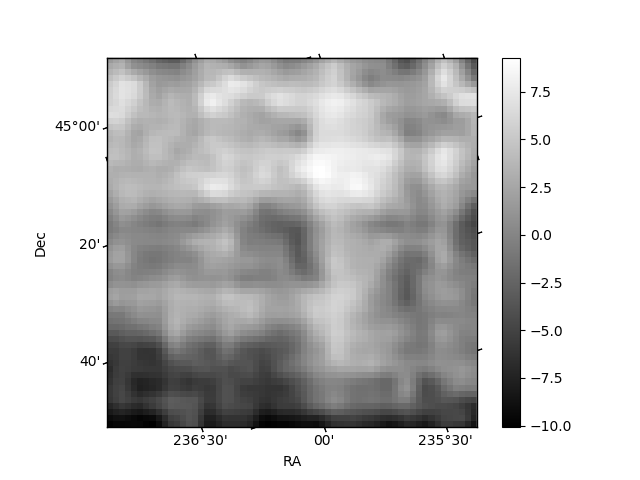
Histogram calculated using DETX and DETY for each event in the final _common_clean file
| Quadrant A | 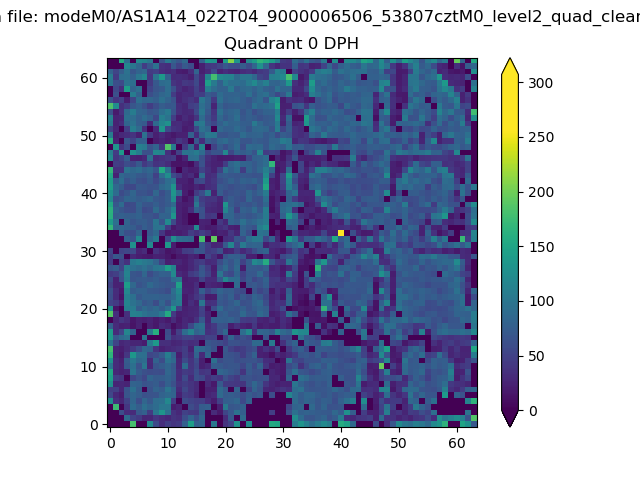 |
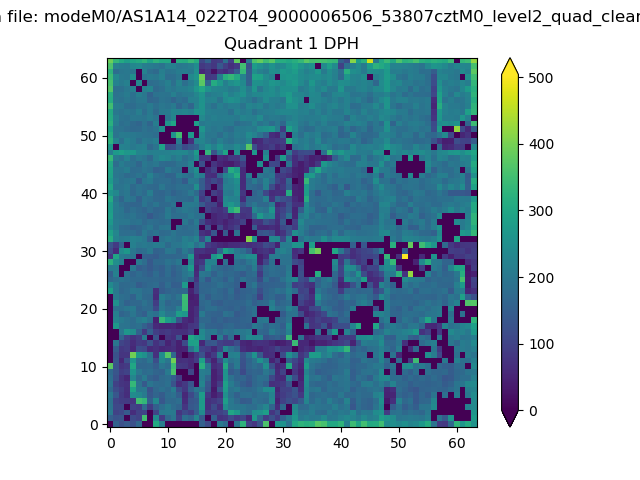 |
Quadrant B |
|---|---|---|---|
| Quadrant D | 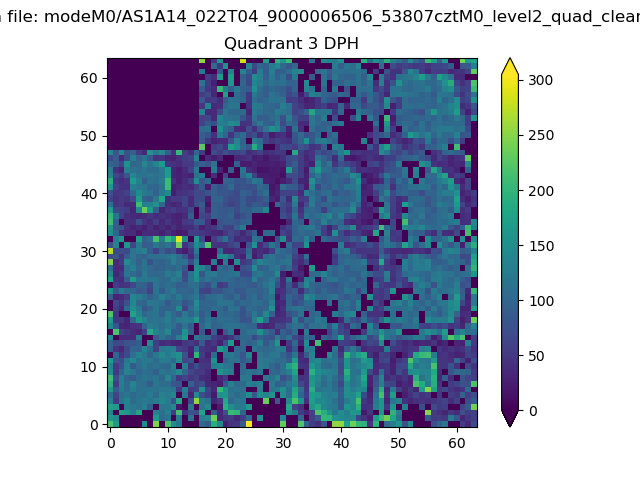 |
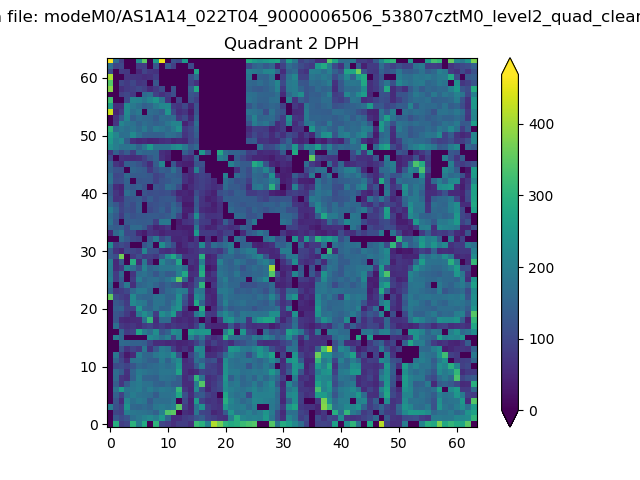 |
Quadrant C |
| Plot type | Count rate plots | Images |
|---|---|---|
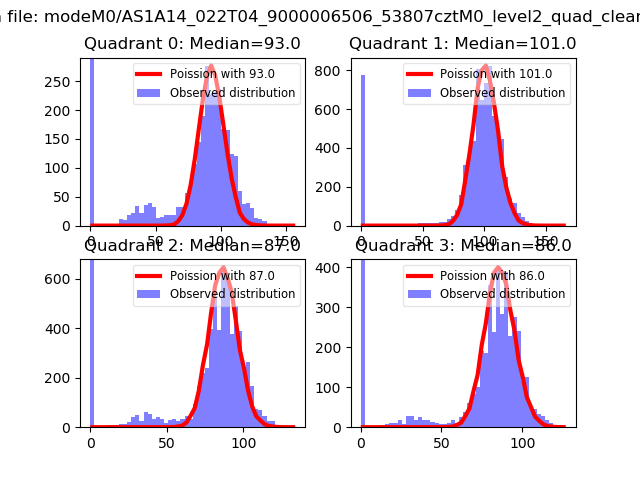
| Comparison with Poisson distribution Blue bars denote a histogram of data divided into 1 sec bins. Red curve is a Poisson curve with rate = median count rate of data. |
 |
 |
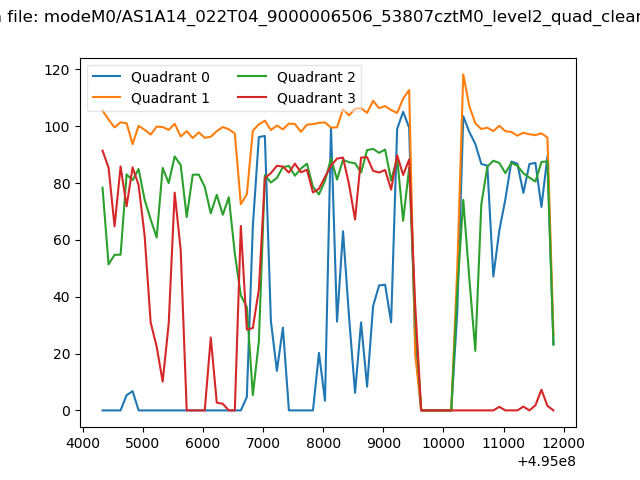
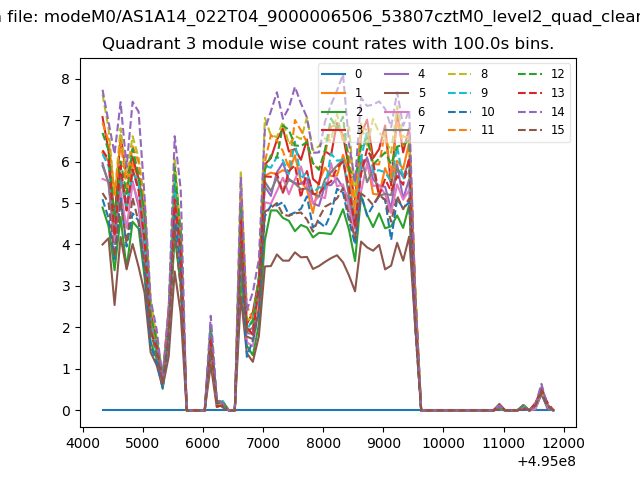
| Quadrant-wise count rates Data is divided into 100 sec bins |
 |
|
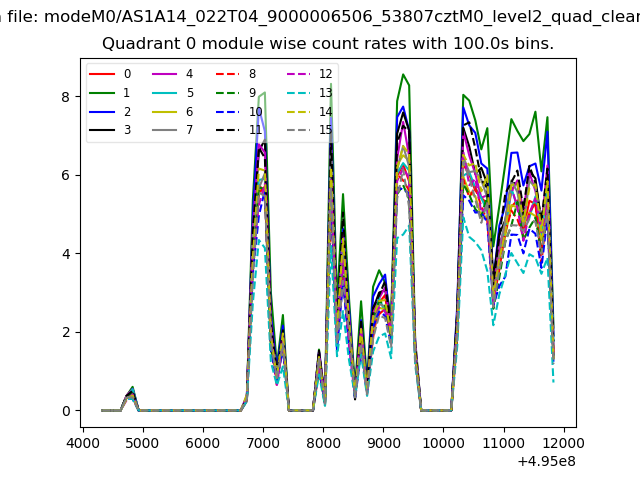
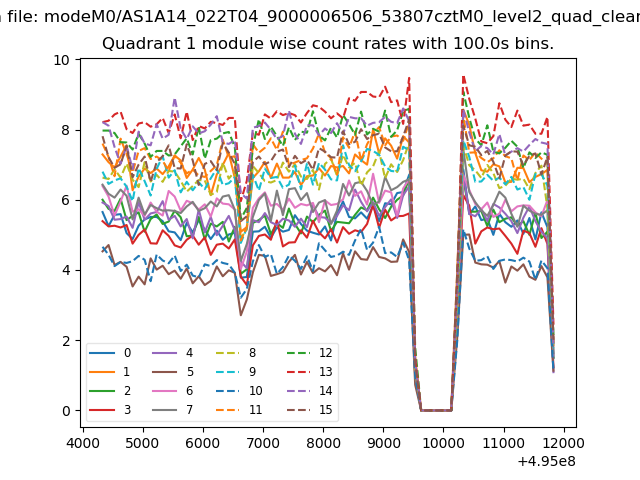
| Module-wise count rates for Quadrant A Data is divided into 100 sec bins |
 |
 |
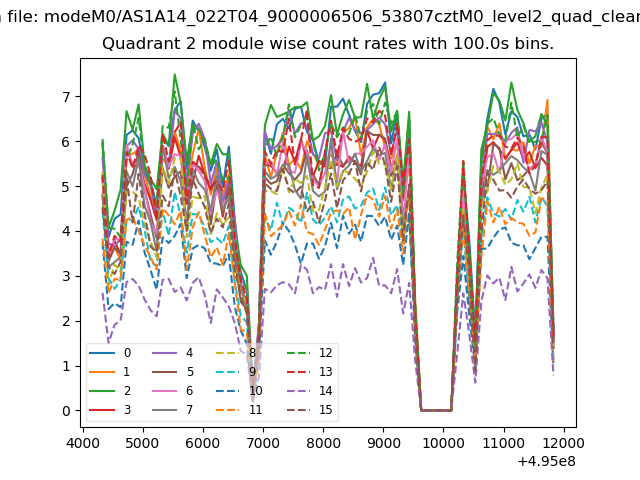
| Module-wise count rates for Quadrant B Data is divided into 100 sec bins |
 |
 |
| Module-wise count rates for Quadrant C Data is divided into 100 sec bins |
 |
 |
| Module-wise count rates for Quadrant D Data is divided into 100 sec bins |
 |
 |
| Parameter | Plot |
|---|---|
| CZT HV Monitor | 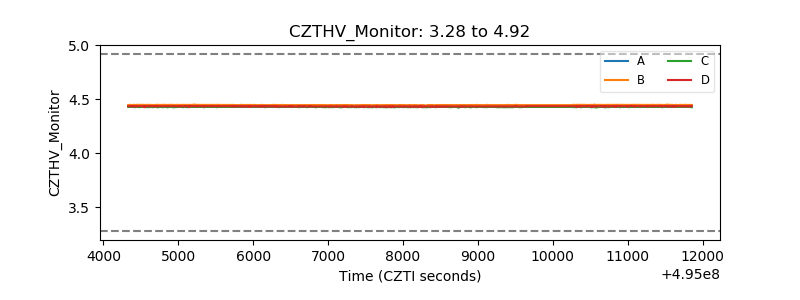 |
| D_VDD | 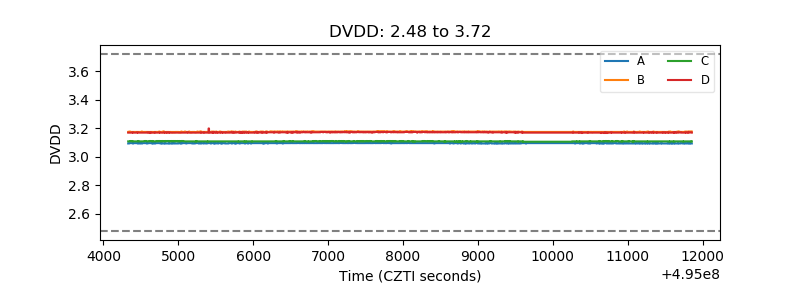 |
| Temperature 1 | 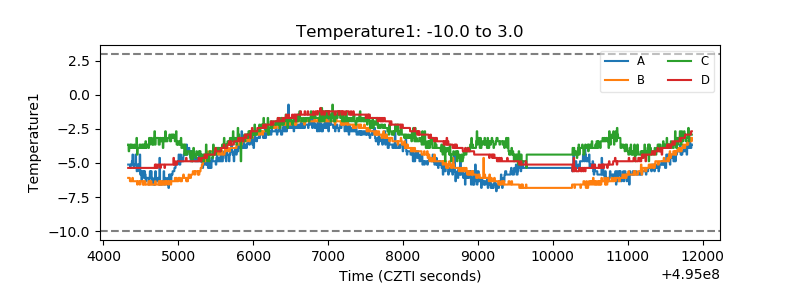 |
| Veto HV Monitor | 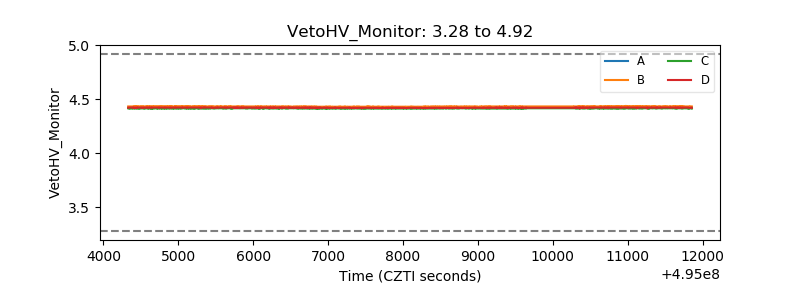 |
| Veto LLD | 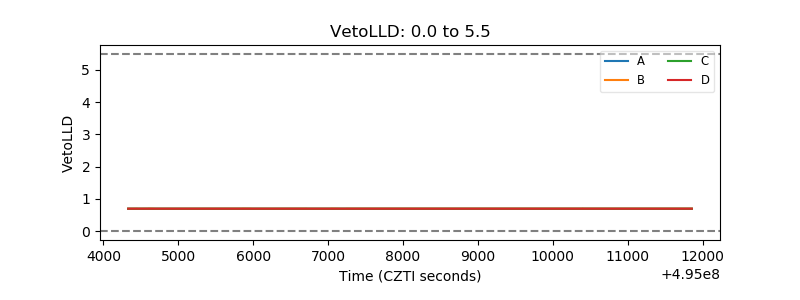 |
| Alpha Counter | 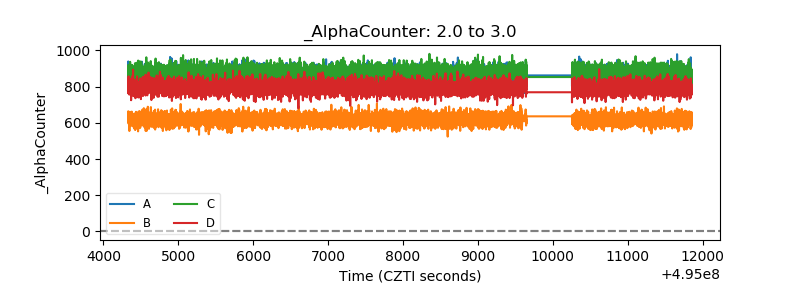 |
| _CPM_Rate | 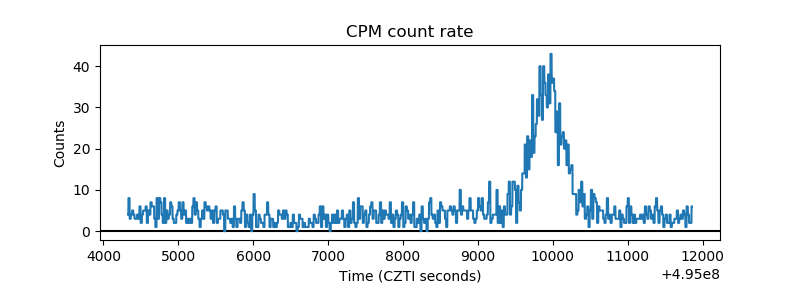 |
| CZT Counter | 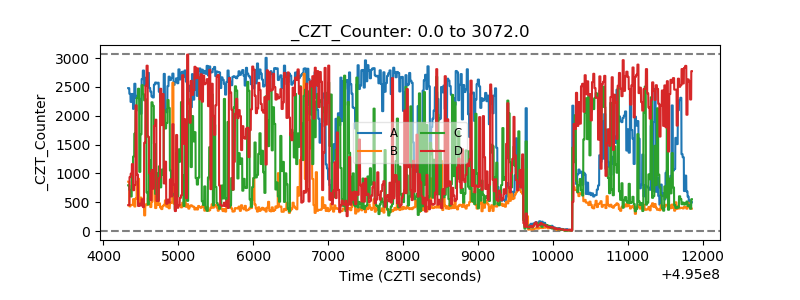 |
| +2.5 Volts monitor |  |
| +5 Volts monitor |  |
| _ROLL_ROT | 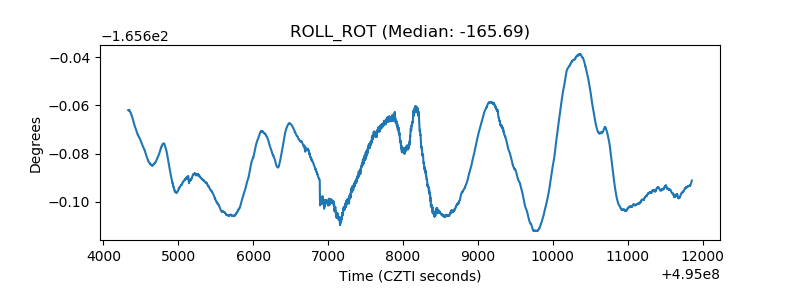 |
| _Roll_DEC | 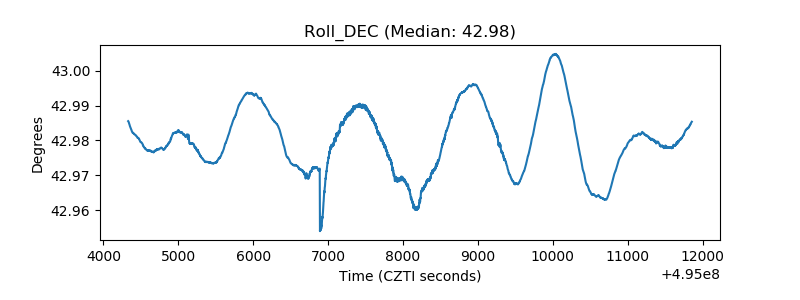 |
| _Roll_RA | 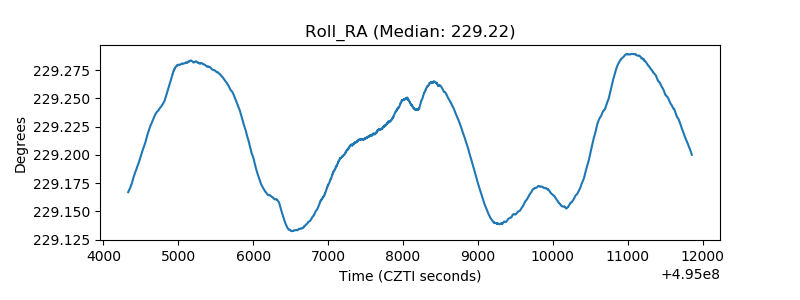 |
| Veto Counter | 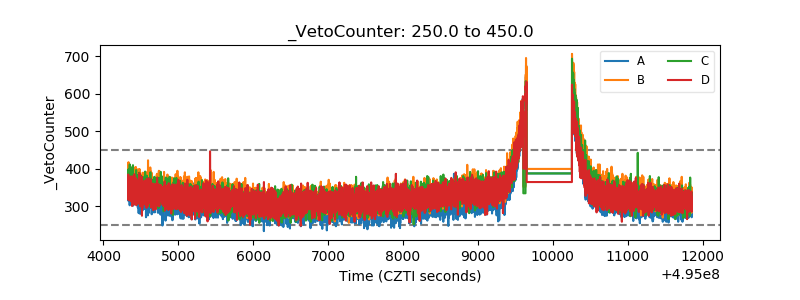 |