| Param | Original file | Final file |
|---|---|---|
| Filename | modeM0/AS1A14_022T04_9000006506_53808cztM0_level2.fits | modeM0/AS1A14_022T04_9000006506_53808cztM0_level2_quad_clean.evt |
| Size (bytes) | 2,714,365,440 | 183,867,840 |
| Size | 2.5 GB | 175.4 MB |
| Events in quadrant A | 38,719,476 | 491,771 |
| Events in quadrant B | 9,308,409 | 1,740,123 |
| Events in quadrant C | 19,689,768 | 1,344,744 |
| Events in quadrant D | 31,383,774 | 756,843 |
| Mode M0 | |||
|---|---|---|---|
| Quadrant | BADHDUFLAG | Total packets | Discarded packets |
| A | 0 | 127526 | 2 |
| B | 0 | 40793 | 2 |
| C | 0 | 70936 | 2 |
| D | 0 | 105509 | 2 |
| Mode SS | |||
|---|---|---|---|
| Quadrant | BADHDUFLAG | Total packets | Discarded packets |
| A | 0 | 362 | 0 |
| B | 0 | 362 | 0 |
| C | 0 | 362 | 0 |
| D | 0 | 362 | 0 |
| Mode M9 | |||
|---|---|---|---|
| Quadrant | BADHDUFLAG | Total packets | Discarded packets |
| A | 0 | 15 | 0 |
| B | 0 | 15 | 0 |
| C | 0 | 15 | 0 |
| D | 0 | 15 | 0 |
| Quadrant | Total seconds | Saturated seconds | Saturation percentage |
|---|---|---|---|
| A | 17878 | 13192 | 73.789014% |
| B | 17879 | 716 | 4.004698% |
| C | 17879 | 3368 | 18.837743% |
| D | 17879 | 9623 | 53.822921% |
Noise dominated data is calculated using 1-second bins in cleaned event files. If a bin has >2000 counts, and if more than 50% of those come from <1% of pixels, then it is considered to be noise-dominated and hence unusable.
| Quadrant | # 1 sec bins | Bins with >0 counts | Bins with >2000 counts | High rate bins dominated by noise | Noise dominated (total time) | Noise dominated (detector-on time) | Marked lightcurve |
|---|---|---|---|---|---|---|---|
| A | 19438 | 17879 | 12337 | 12337 | 63.47% | 69.00% | 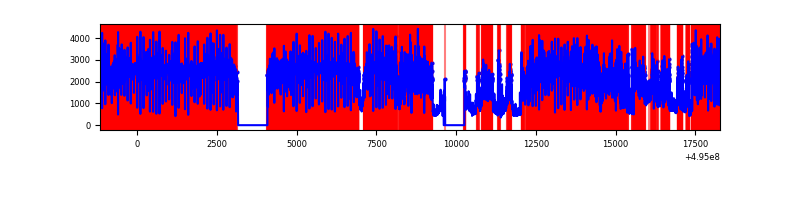 |
| B | 19439 | 17882 | 154 | 154 | 0.79% | 0.86% | 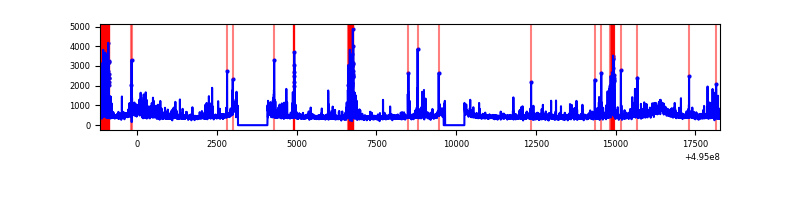 |
| C | 19439 | 17882 | 2434 | 2434 | 12.52% | 13.61% | 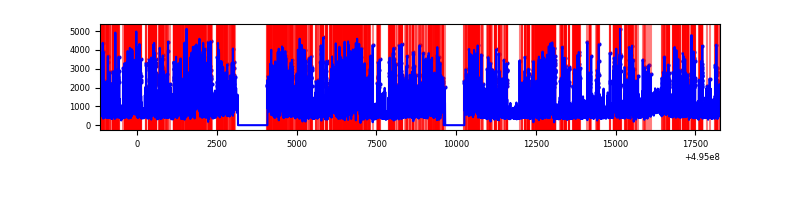 |
| D | 19439 | 17881 | 7912 | 7912 | 40.70% | 44.25% | 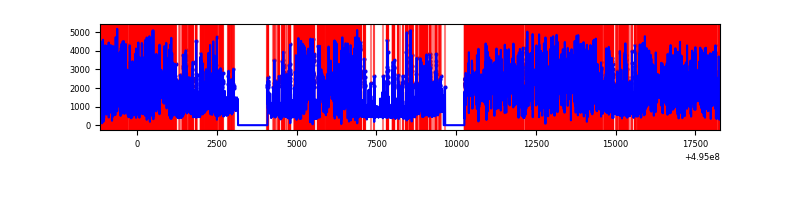 |
Top three noisy pixels from each quadrant. If the there are fewer than three noisy pixels in the level2.evt file, extra rows are filled as -1
| Pixel properties | Quadrant properties | ||||||
|---|---|---|---|---|---|---|---|
| Quadrant | DetID | PixID | Counts | Sigma | Mean | Median | Sigma |
| A | 3 | 63 | 32881939 | 116547.47 | 1154 | 1125 | 282.1 |
| A | 8 | 249 | 307519 | 1086.03 | 1154 | 1125 | 282.1 |
| A | 5 | 241 | 295169 | 1042.25 | 1154 | 1125 | 282.1 |
| B | 5 | 185 | 871187 | 2146.09 | 1898 | 1823 | 405.1 |
| B | 5 | 172 | 239546 | 586.84 | 1898 | 1823 | 405.1 |
| B | 10 | 246 | 183369 | 448.16 | 1898 | 1823 | 405.1 |
| C | 15 | 224 | 11013402 | 23029.28 | 1738 | 1721 | 478.2 |
| C | 12 | 2 | 609826 | 1271.76 | 1738 | 1721 | 478.2 |
| C | 1 | 16 | 249459 | 518.11 | 1738 | 1721 | 478.2 |
| D | 8 | 176 | 20721463 | 61606.55 | 1192 | 1140 | 336.3 |
| D | 1 | 241 | 2489886 | 7399.65 | 1192 | 1140 | 336.3 |
| D | 7 | 70 | 634121 | 1882.01 | 1192 | 1140 | 336.3 |
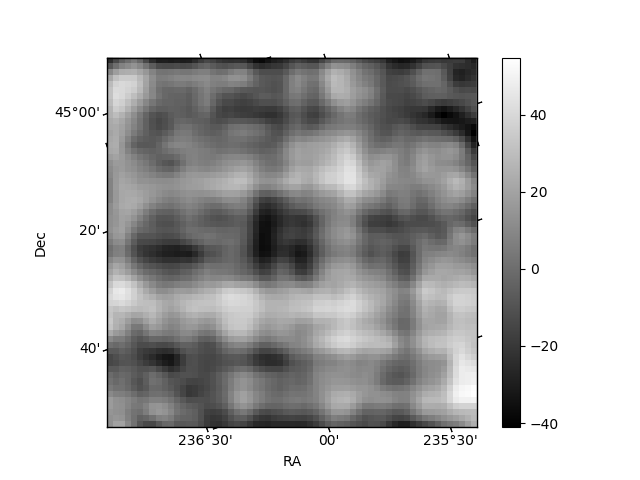
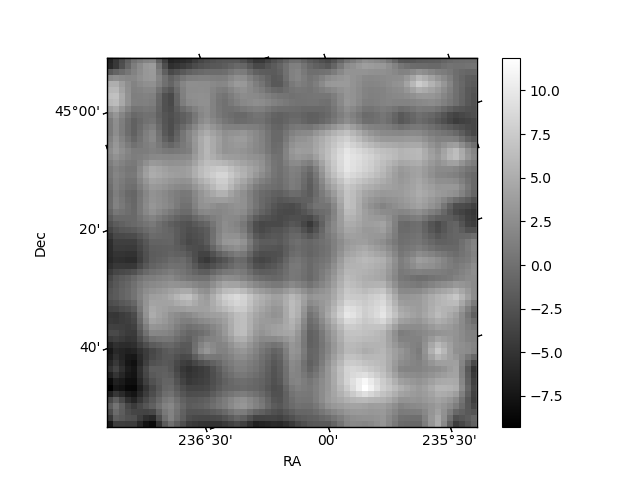
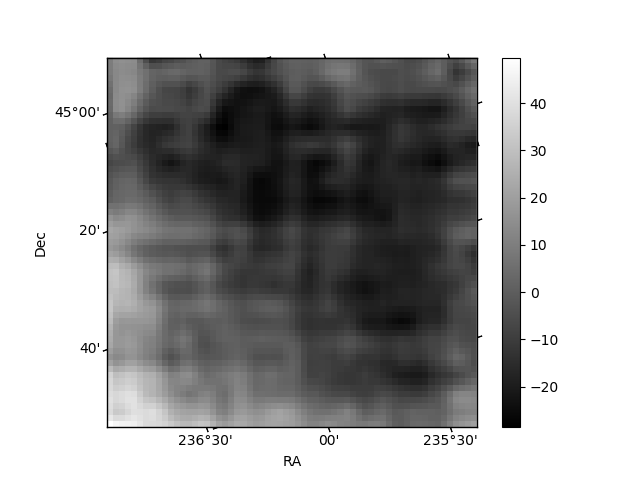
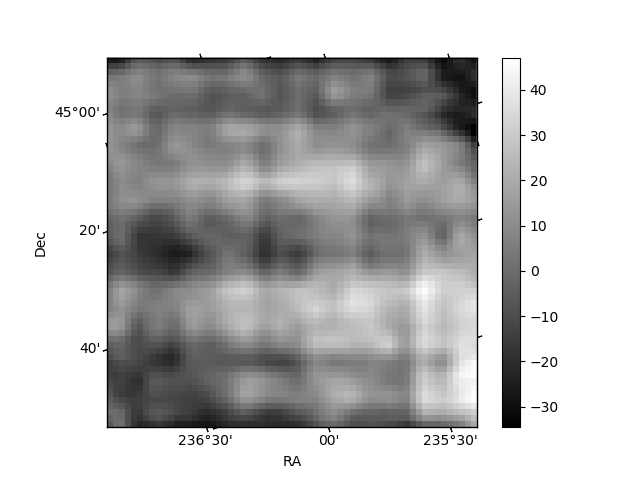
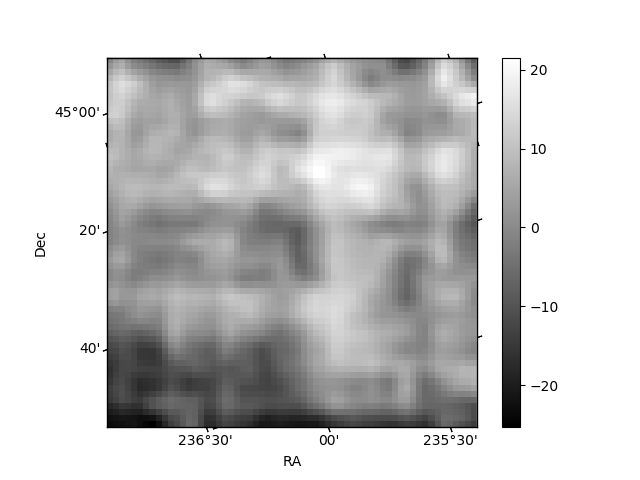
Histogram calculated using DETX and DETY for each event in the final _common_clean file
| Quadrant A | 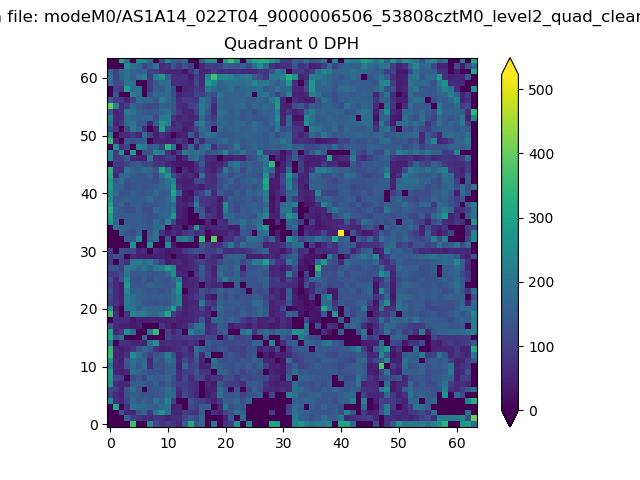 |
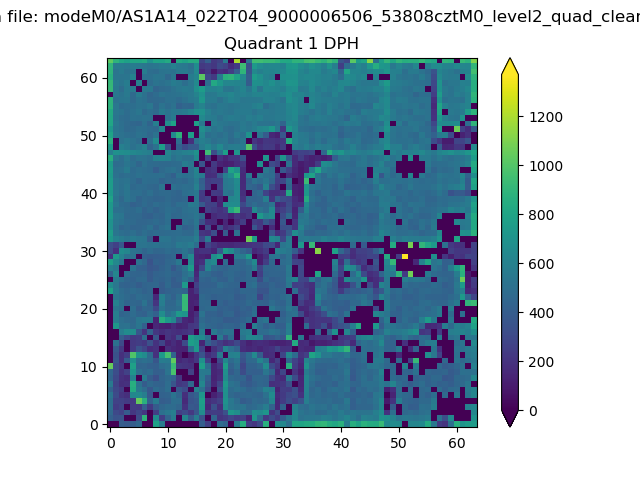 |
Quadrant B |
|---|---|---|---|
| Quadrant D | 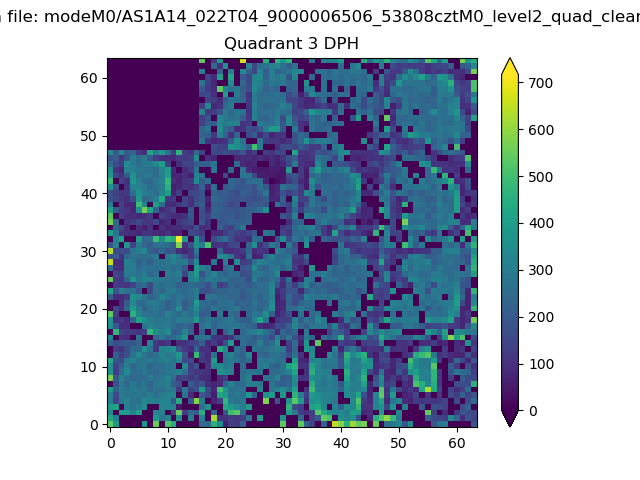 |
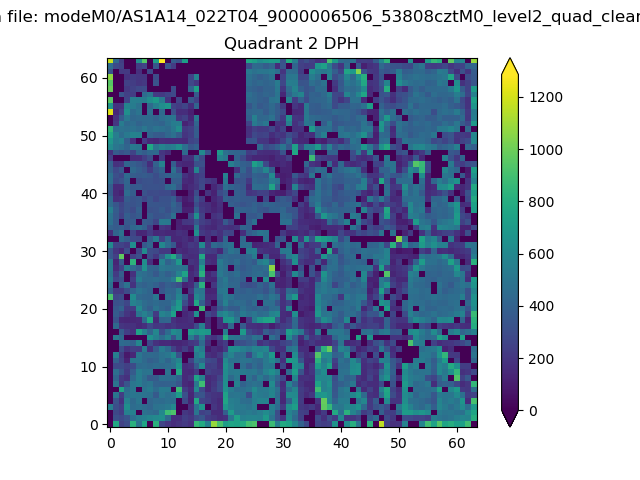 |
Quadrant C |
| Plot type | Count rate plots | Images |
|---|---|---|
| Comparison with Poisson distribution Blue bars denote a histogram of data divided into 1 sec bins. Red curve is a Poisson curve with rate = median count rate of data. |
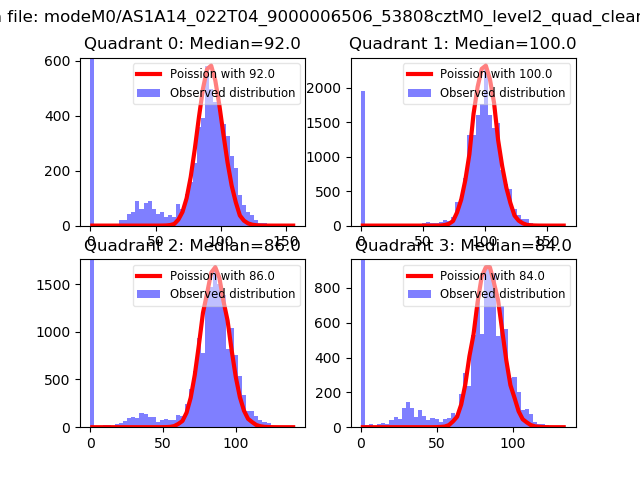 |
 |
| Quadrant-wise count rates Data is divided into 100 sec bins |
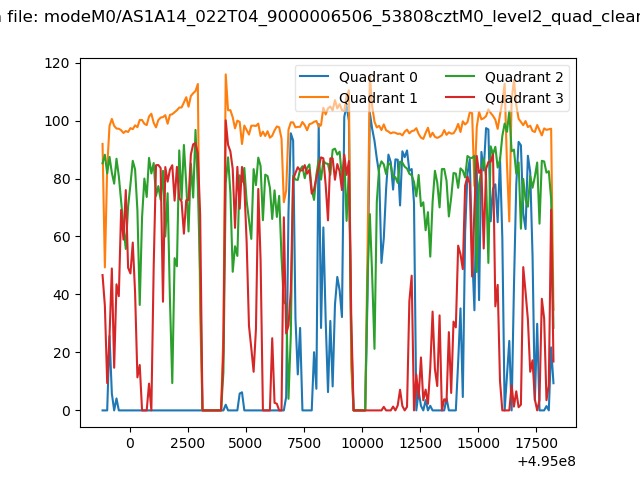 |
|
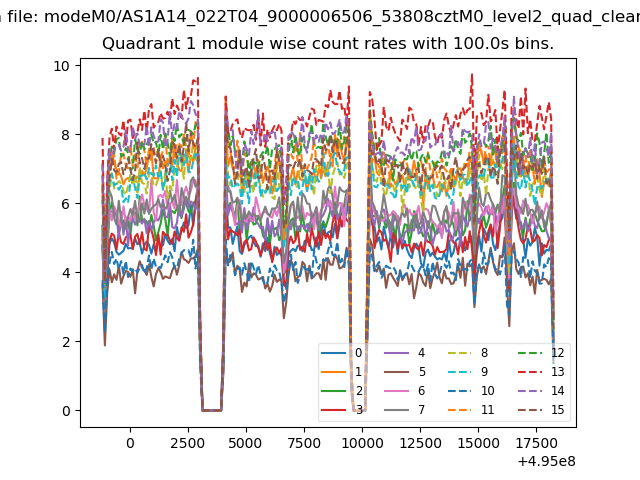
| Module-wise count rates for Quadrant A Data is divided into 100 sec bins |
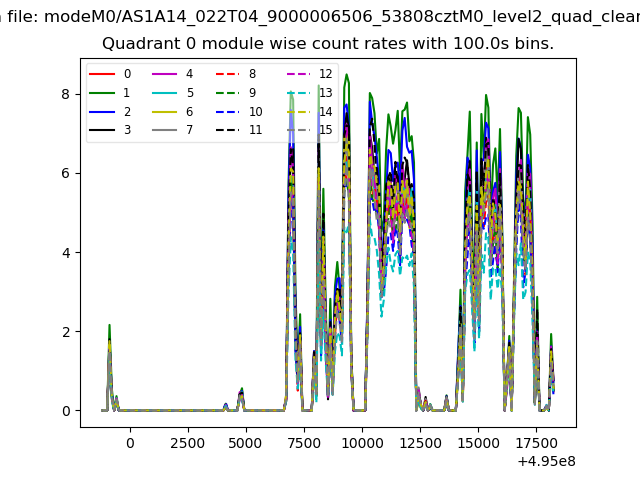 |
 |
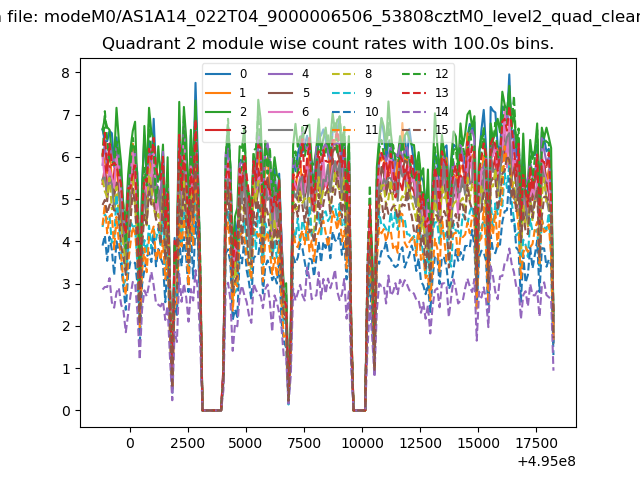
| Module-wise count rates for Quadrant B Data is divided into 100 sec bins |
 |
 |
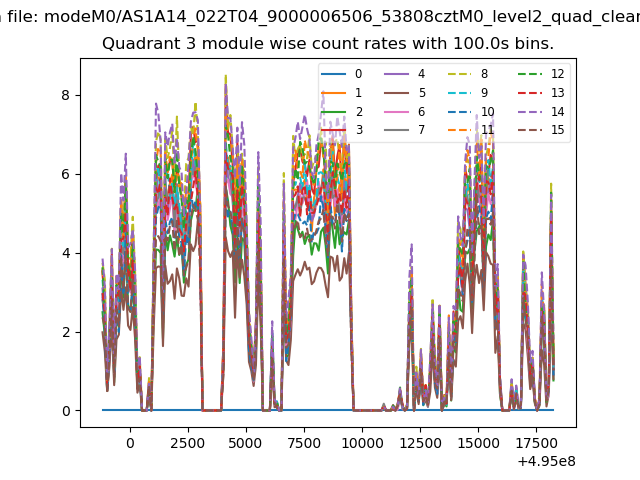
| Module-wise count rates for Quadrant C Data is divided into 100 sec bins |
 |
 |
| Module-wise count rates for Quadrant D Data is divided into 100 sec bins |
 |
 |
| Parameter | Plot |
|---|---|
| CZT HV Monitor | 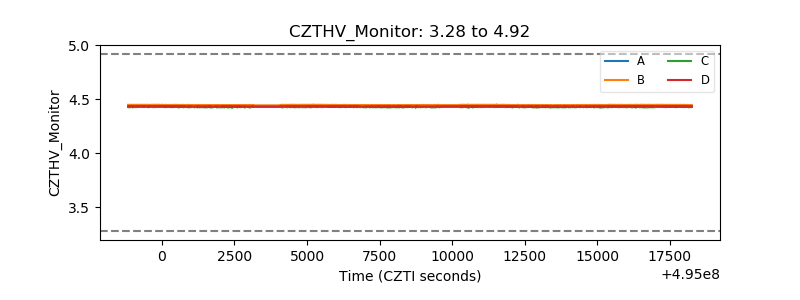 |
| D_VDD | 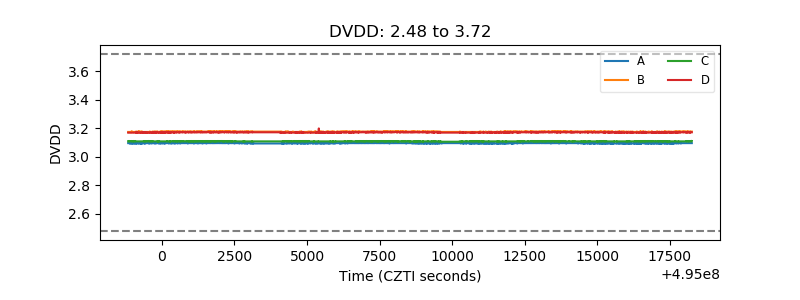 |
| Temperature 1 | 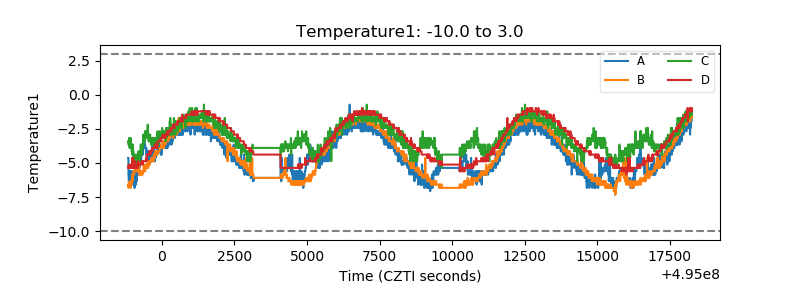 |
| Veto HV Monitor | 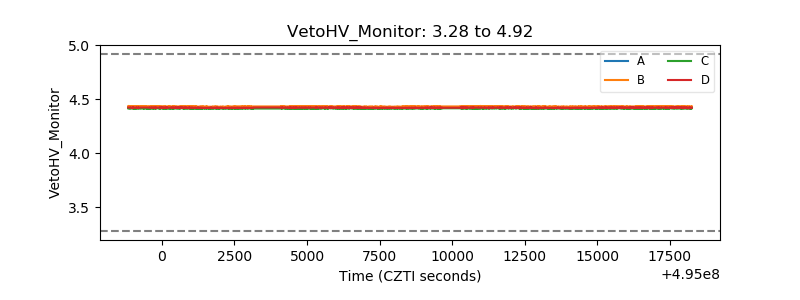 |
| Veto LLD | 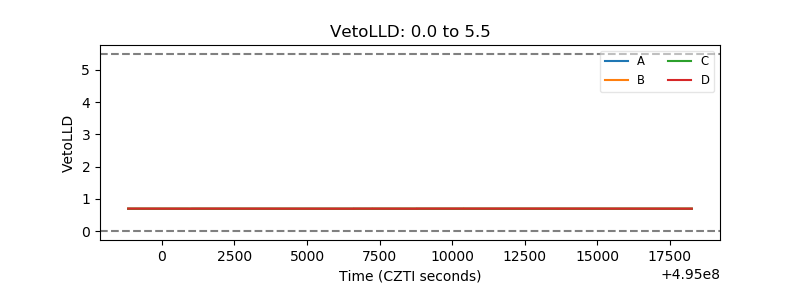 |
| Alpha Counter | 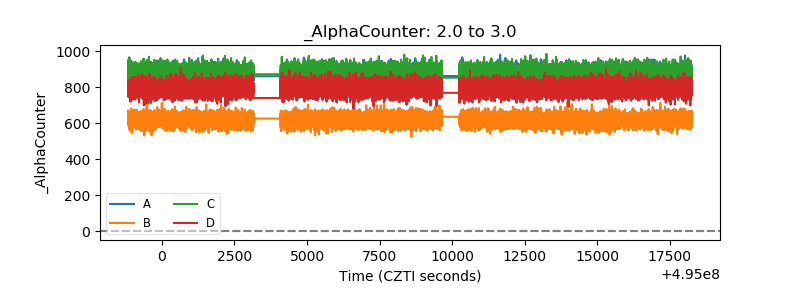 |
| _CPM_Rate |  |
| CZT Counter | 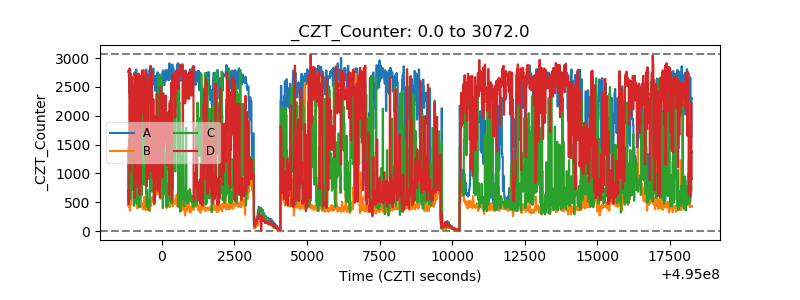 |
| +2.5 Volts monitor |  |
| +5 Volts monitor |  |
| _ROLL_ROT | 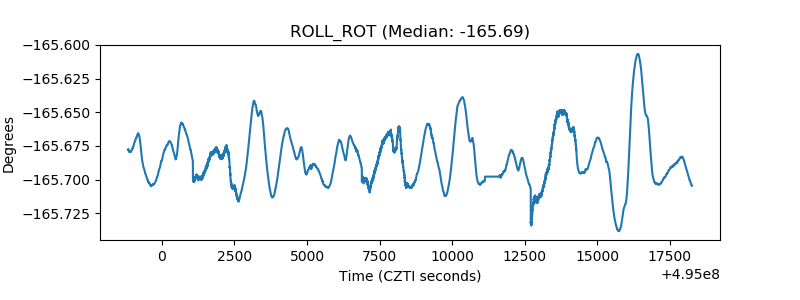 |
| _Roll_DEC | 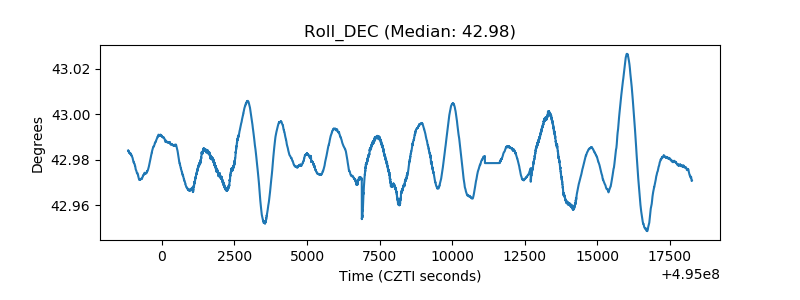 |
| _Roll_RA | 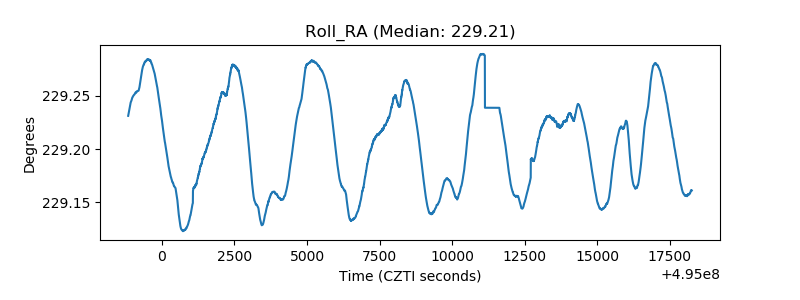 |
| Veto Counter | 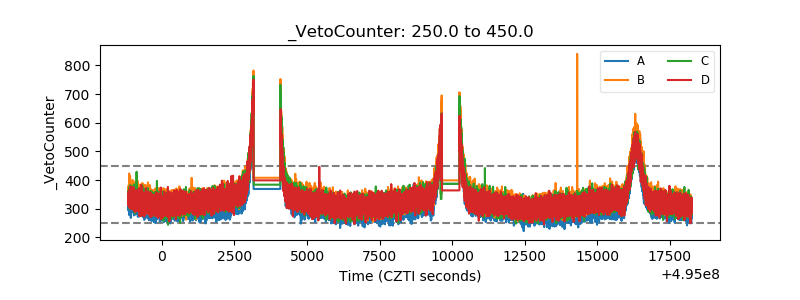 |