| Param | Original file | Final file |
|---|---|---|
| Filename | modeM0/AS1A14_022T04_9000006506_53809cztM0_level2.fits | modeM0/AS1A14_022T04_9000006506_53809cztM0_level2_quad_clean.evt |
| Size (bytes) | 1,245,450,240 | 64,105,920 |
| Size | 1.2 GB | 61.1 MB |
| Events in quadrant A | 17,815,880 | 39,977 |
| Events in quadrant B | 4,736,468 | 691,645 |
| Events in quadrant C | 6,665,005 | 583,905 |
| Events in quadrant D | 16,334,791 | 128,044 |
| Mode M0 | |||
|---|---|---|---|
| Quadrant | BADHDUFLAG | Total packets | Discarded packets |
| A | 0 | 57877 | 7 |
| B | 0 | 19020 | 0 |
| C | 0 | 24721 | 0 |
| D | 0 | 53393 | 0 |
| Mode SS | |||
|---|---|---|---|
| Quadrant | BADHDUFLAG | Total packets | Discarded packets |
| A | 0 | 142 | 0 |
| B | 0 | 142 | 0 |
| C | 0 | 142 | 0 |
| D | 0 | 142 | 0 |
| Quadrant | Total seconds | Saturated seconds | Saturation percentage |
|---|---|---|---|
| A | 7139 | 6786 | 95.055330% |
| B | 7140 | 337 | 4.719888% |
| C | 7140 | 720 | 10.084034% |
| D | 7140 | 5824 | 81.568627% |
Noise dominated data is calculated using 1-second bins in cleaned event files. If a bin has >2000 counts, and if more than 50% of those come from <1% of pixels, then it is considered to be noise-dominated and hence unusable.
| Quadrant | # 1 sec bins | Bins with >0 counts | Bins with >2000 counts | High rate bins dominated by noise | Noise dominated (total time) | Noise dominated (detector-on time) | Marked lightcurve |
|---|---|---|---|---|---|---|---|
| A | 7138 | 7138 | 6406 | 6406 | 89.75% | 89.75% | 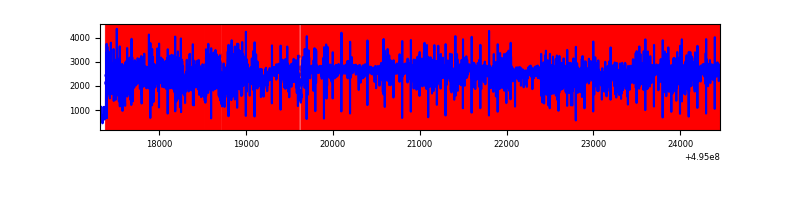 |
| B | 7140 | 7140 | 231 | 231 | 3.24% | 3.24% | 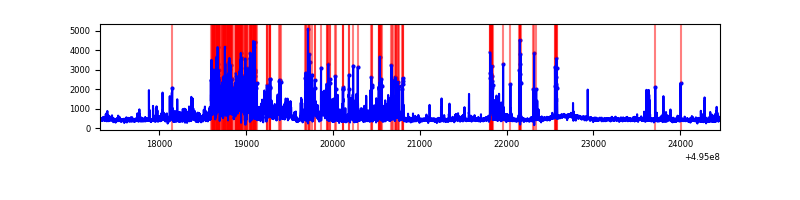 |
| C | 7140 | 7140 | 613 | 613 | 8.59% | 8.59% | 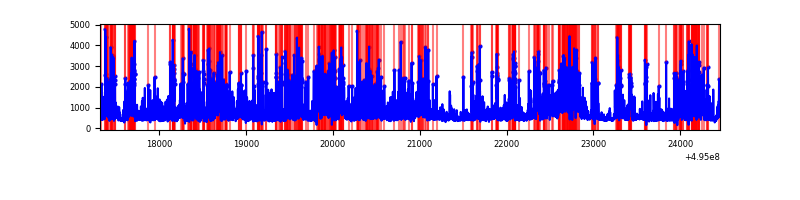 |
| D | 7139 | 7139 | 5031 | 5031 | 70.47% | 70.47% | 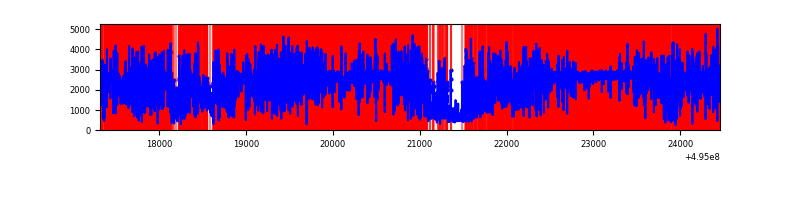 |
Top three noisy pixels from each quadrant. If the there are fewer than three noisy pixels in the level2.evt file, extra rows are filled as -1
| Pixel properties | Quadrant properties | ||||||
|---|---|---|---|---|---|---|---|
| Quadrant | DetID | PixID | Counts | Sigma | Mean | Median | Sigma |
| A | 3 | 63 | 16108864 | 186220.79 | 343 | 335 | 86.5 |
| A | 8 | 249 | 142527 | 1643.79 | 343 | 335 | 86.5 |
| A | 4 | 249 | 92336 | 1063.57 | 343 | 335 | 86.5 |
| B | 5 | 185 | 1086368 | 6822.86 | 730 | 705 | 159.1 |
| B | 8 | 234 | 362724 | 2275.11 | 730 | 705 | 159.1 |
| B | 0 | 213 | 167407 | 1047.64 | 730 | 705 | 159.1 |
| C | 15 | 224 | 3166484 | 16318.6 | 696 | 688 | 194.0 |
| C | 12 | 2 | 203629 | 1046.09 | 696 | 688 | 194.0 |
| C | 14 | 254 | 71211 | 363.52 | 696 | 688 | 194.0 |
| D | 8 | 176 | 13035939 | 142496.94 | 311 | 296 | 91.5 |
| D | 2 | 172 | 707457 | 7730.21 | 311 | 296 | 91.5 |
| D | 1 | 241 | 702096 | 7671.61 | 311 | 296 | 91.5 |
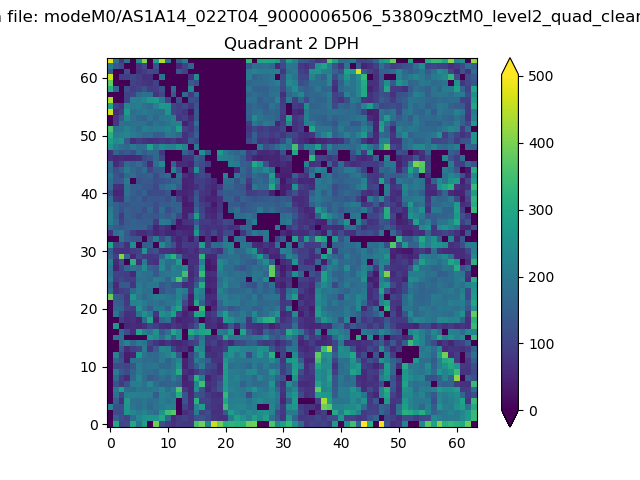
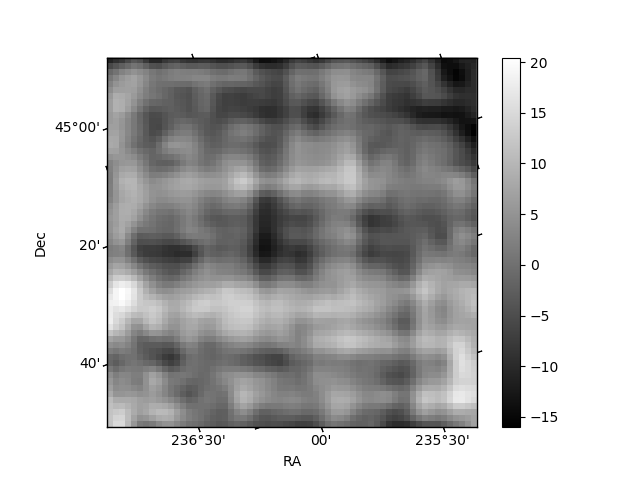
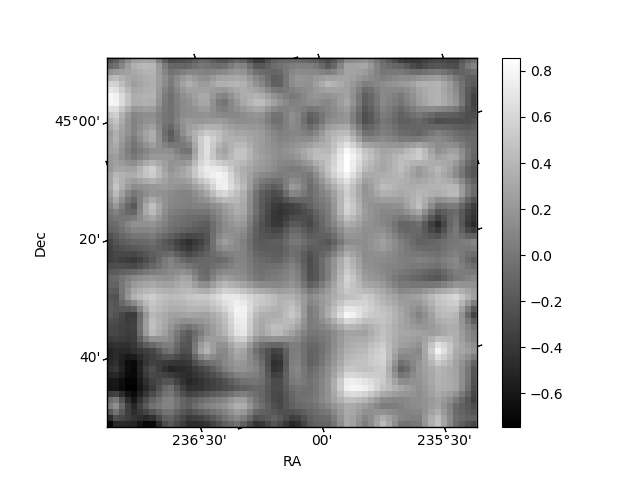
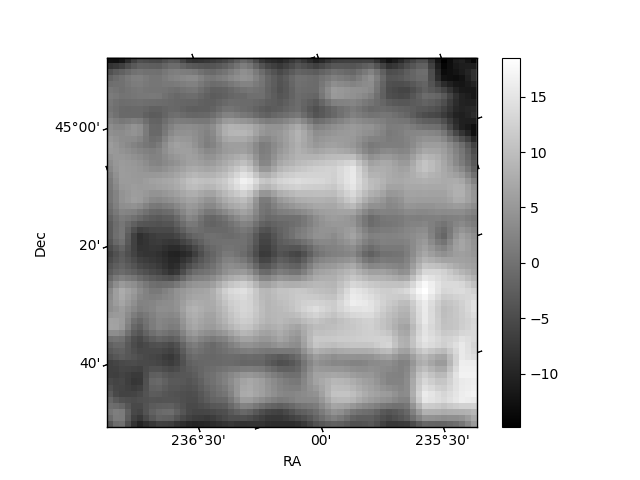
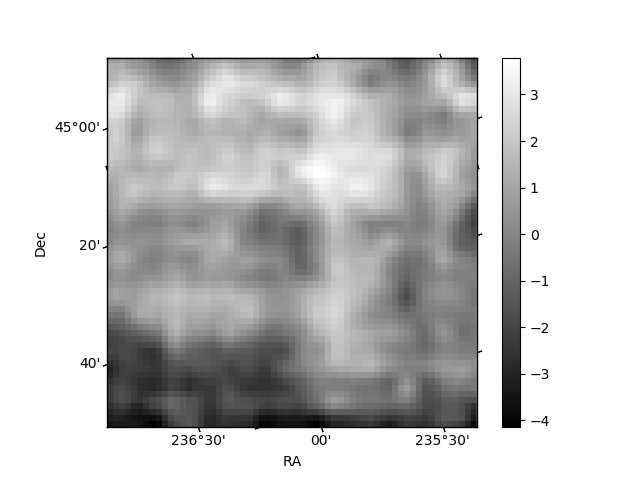
Histogram calculated using DETX and DETY for each event in the final _common_clean file
| Quadrant A | 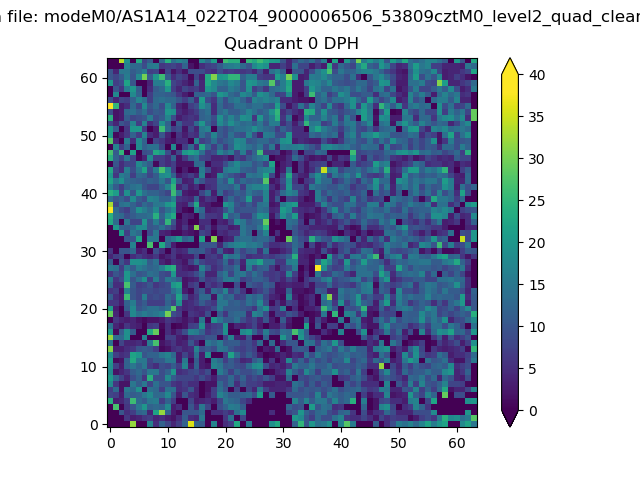 |
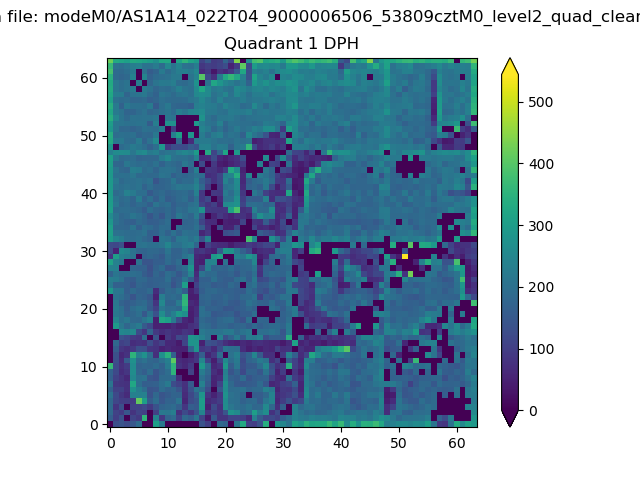 |
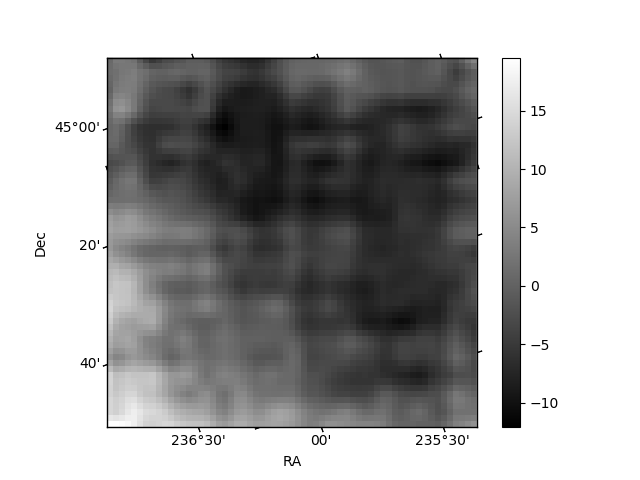
Quadrant B |
|---|---|---|---|
| Quadrant D | 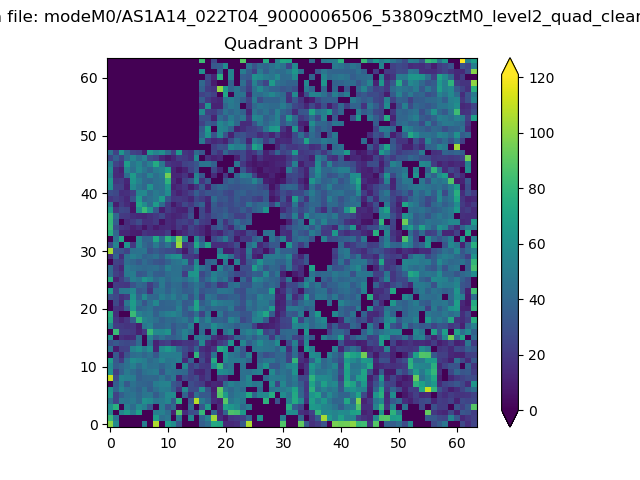 |
 |
Quadrant C |
| Plot type | Count rate plots | Images |
|---|---|---|
| Comparison with Poisson distribution Blue bars denote a histogram of data divided into 1 sec bins. Red curve is a Poisson curve with rate = median count rate of data. |
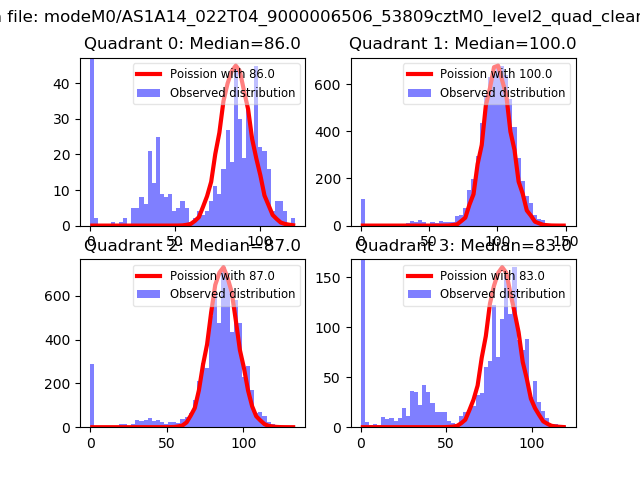 |
 |
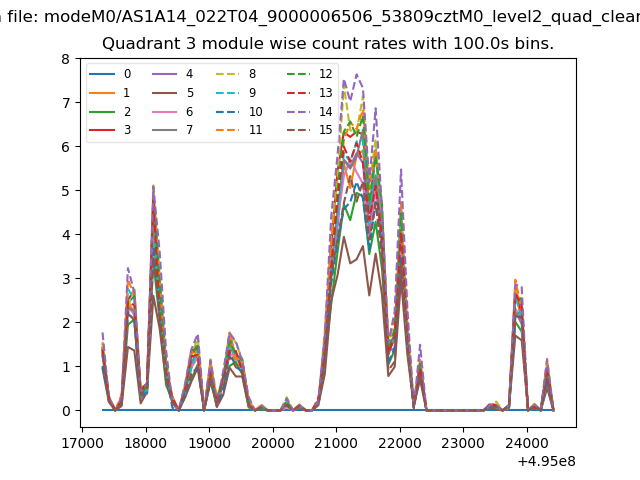
| Quadrant-wise count rates Data is divided into 100 sec bins |
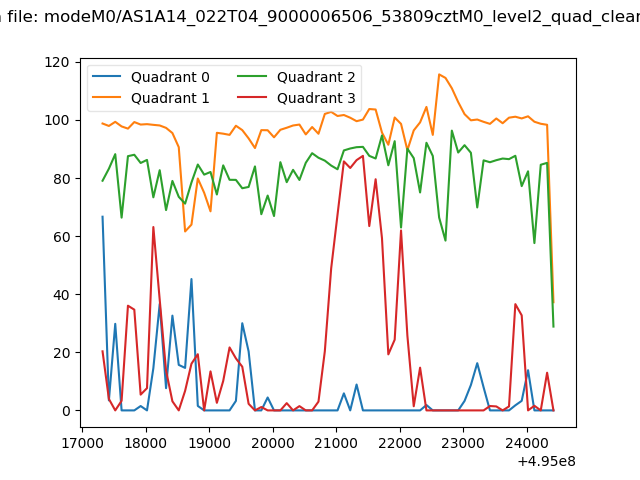 |
|
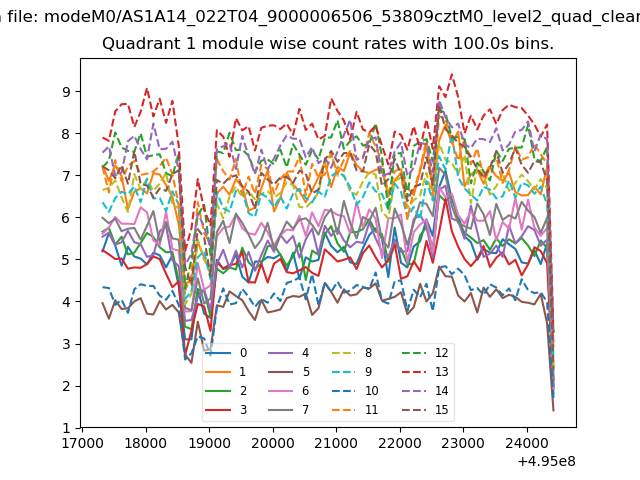
| Module-wise count rates for Quadrant A Data is divided into 100 sec bins |
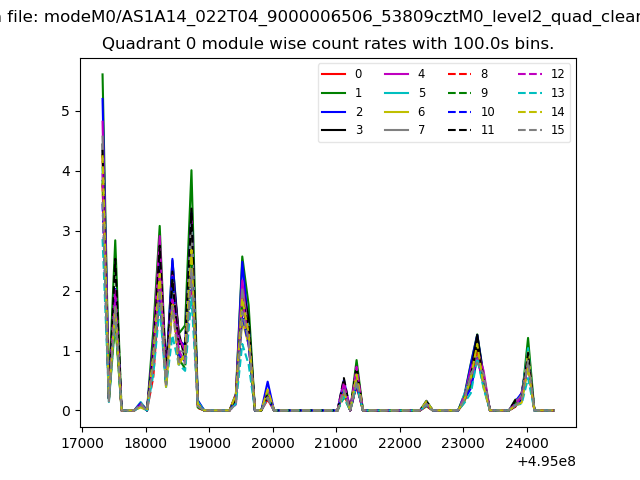 |
 |
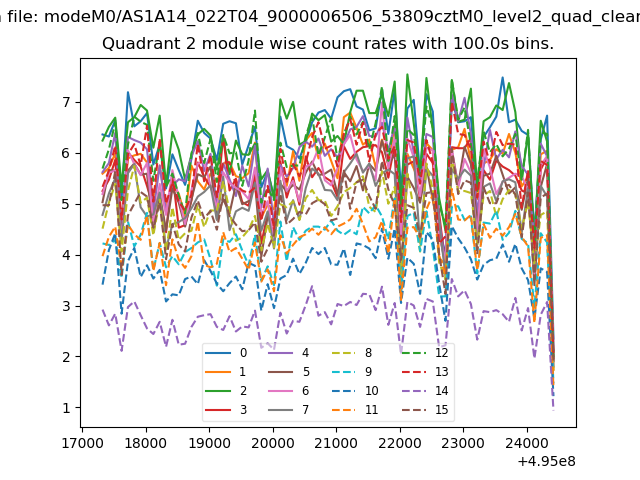
| Module-wise count rates for Quadrant B Data is divided into 100 sec bins |
 |
 |
| Module-wise count rates for Quadrant C Data is divided into 100 sec bins |
 |
 |
| Module-wise count rates for Quadrant D Data is divided into 100 sec bins |
 |
 |
| Parameter | Plot |
|---|---|
| CZT HV Monitor | 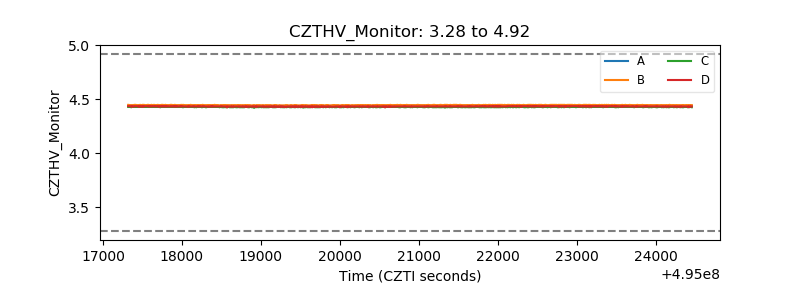 |
| D_VDD |  |
| Temperature 1 | 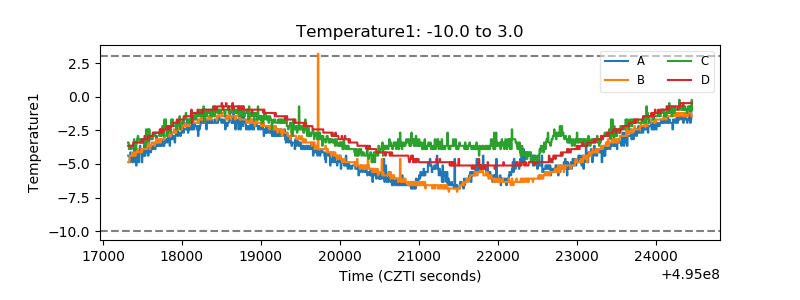 |
| Veto HV Monitor | 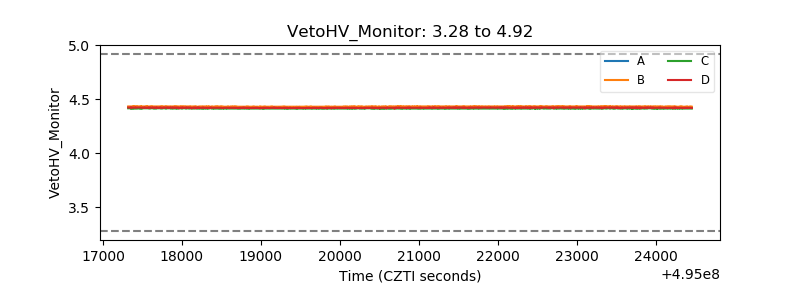 |
| Veto LLD | 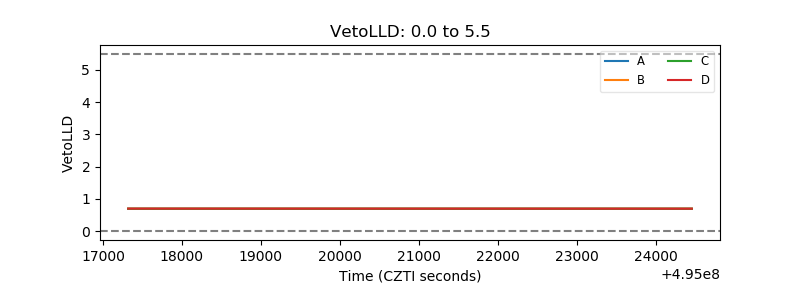 |
| Alpha Counter | 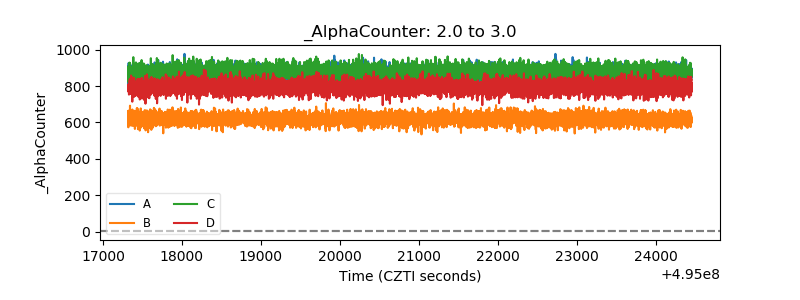 |
| _CPM_Rate | 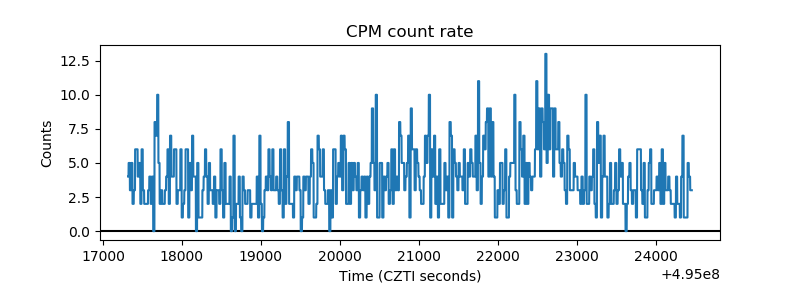 |
| CZT Counter | 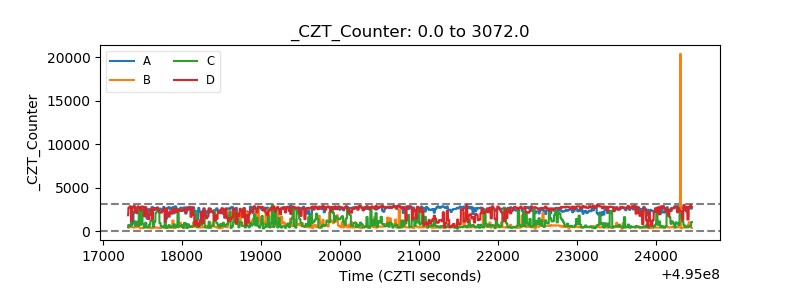 |
| +2.5 Volts monitor | 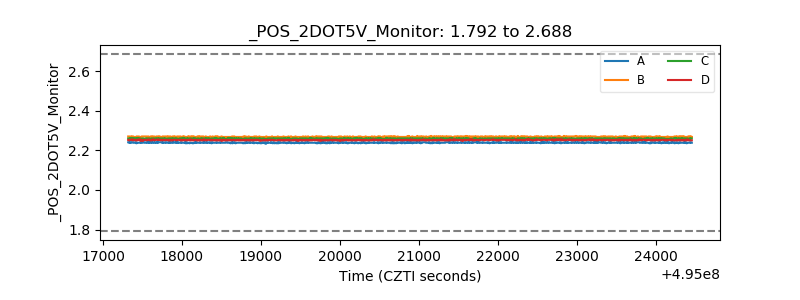 |
| +5 Volts monitor | 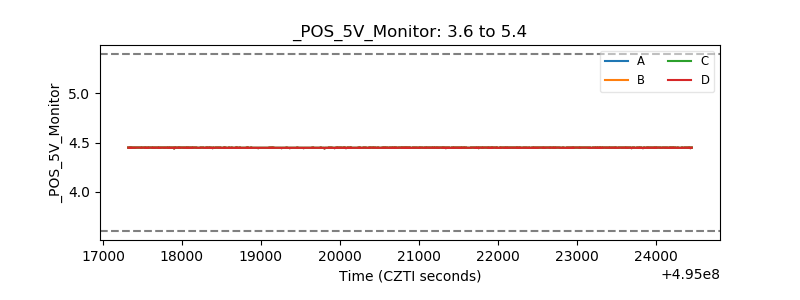 |
| _ROLL_ROT | 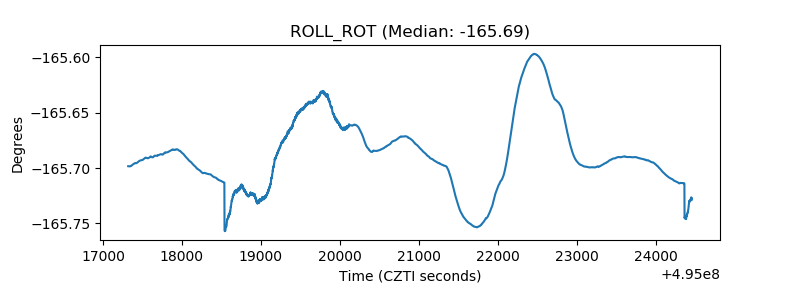 |
| _Roll_DEC | 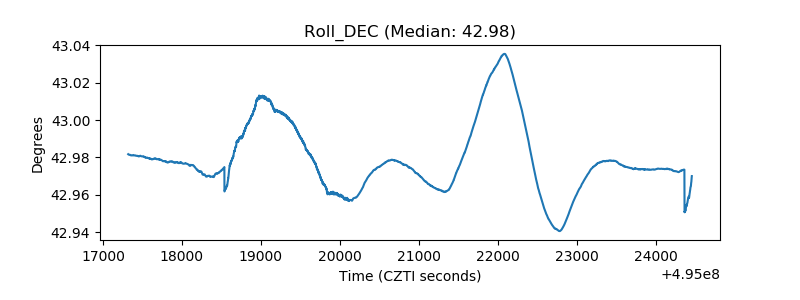 |
| _Roll_RA | 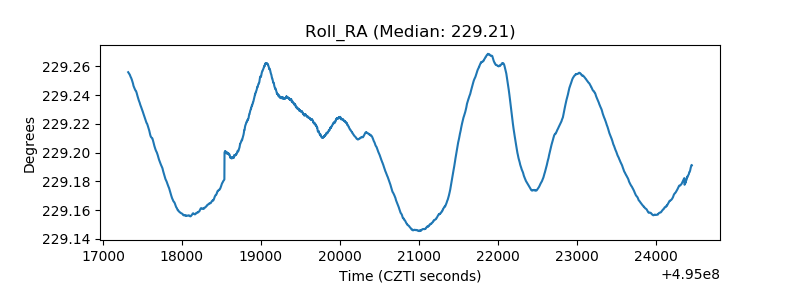 |
| Veto Counter | 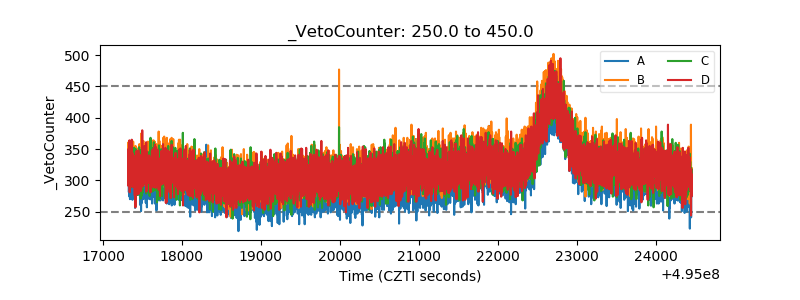 |