| Param | Original file | Final file |
|---|---|---|
| Filename | modeM0/AS1A14_022T04_9000006506_53810cztM0_level2.fits | modeM0/AS1A14_022T04_9000006506_53810cztM0_level2_quad_clean.evt |
| Size (bytes) | 766,543,680 | 51,664,320 |
| Size | 731.0 MB | 49.3 MB |
| Events in quadrant A | 10,946,992 | 133,601 |
| Events in quadrant B | 2,700,106 | 503,703 |
| Events in quadrant C | 4,522,273 | 415,913 |
| Events in quadrant D | 9,818,085 | 159,913 |
| Mode M0 | |||
|---|---|---|---|
| Quadrant | BADHDUFLAG | Total packets | Discarded packets |
| A | 0 | 38291 | 2310 |
| B | 0 | 12561 | 847 |
| C | 0 | 18440 | 1531 |
| D | 0 | 36697 | 4140 |
| Mode SS | |||
|---|---|---|---|
| Quadrant | BADHDUFLAG | Total packets | Discarded packets |
| A | 0 | 107 | 5 |
| B | 0 | 109 | 9 |
| C | 0 | 110 | 10 |
| D | 0 | 106 | 1 |
| Mode M9 | |||
|---|---|---|---|
| Quadrant | BADHDUFLAG | Total packets | Discarded packets |
| A | 0 | 2 | 2 |
| B | 0 | 4 | 4 |
| C | 0 | 3 | 3 |
| D | 0 | 4 | 4 |
| Quadrant | Total seconds | Saturated seconds | Saturation percentage |
|---|---|---|---|
| A | 4981 | 3693 | 74.141739% |
| B | 5079 | 68 | 1.338846% |
| C | 5036 | 427 | 8.478952% |
| D | 4901 | 3090 | 63.048357% |
Noise dominated data is calculated using 1-second bins in cleaned event files. If a bin has >2000 counts, and if more than 50% of those come from <1% of pixels, then it is considered to be noise-dominated and hence unusable.
| Quadrant | # 1 sec bins | Bins with >0 counts | Bins with >2000 counts | High rate bins dominated by noise | Noise dominated (total time) | Noise dominated (detector-on time) | Marked lightcurve |
|---|---|---|---|---|---|---|---|
| A | 7263 | 5071 | 3401 | 3401 | 46.83% | 67.07% | 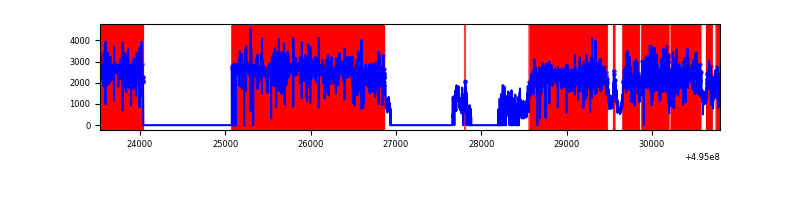 |
| B | 7264 | 5165 | 42 | 42 | 0.58% | 0.81% | 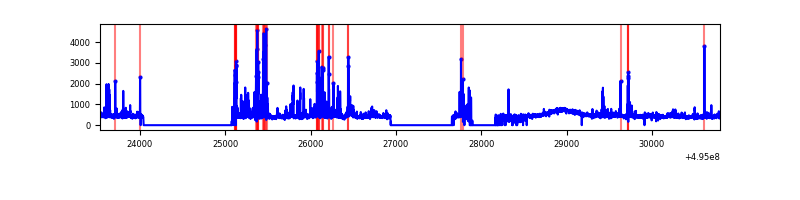 |
| C | 7264 | 5136 | 309 | 309 | 4.25% | 6.02% | 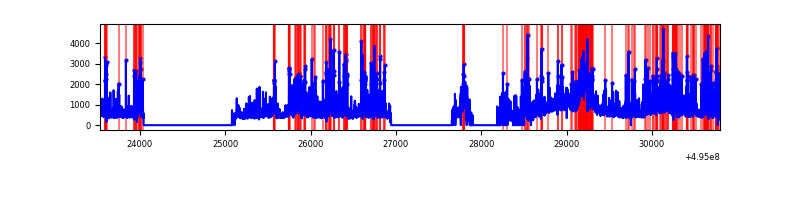 |
| D | 7264 | 4923 | 2857 | 2857 | 39.33% | 58.03% | 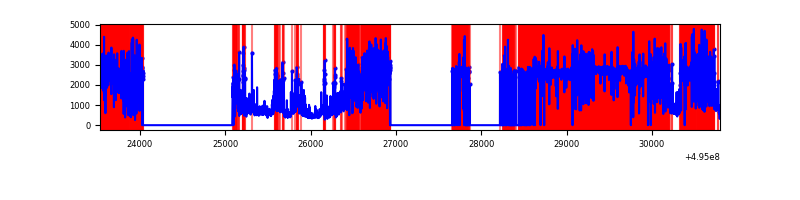 |
Top three noisy pixels from each quadrant. If the there are fewer than three noisy pixels in the level2.evt file, extra rows are filled as -1
| Pixel properties | Quadrant properties | ||||||
|---|---|---|---|---|---|---|---|
| Quadrant | DetID | PixID | Counts | Sigma | Mean | Median | Sigma |
| A | 3 | 63 | 9297677 | 107149.39 | 344 | 336 | 86.8 |
| A | 4 | 249 | 113333 | 1302.26 | 344 | 336 | 86.8 |
| A | 8 | 249 | 68311 | 783.39 | 344 | 336 | 86.8 |
| B | 5 | 185 | 347621 | 2969.33 | 539 | 519 | 116.9 |
| B | 0 | 213 | 44942 | 380.02 | 539 | 519 | 116.9 |
| B | 7 | 252 | 43919 | 371.27 | 539 | 519 | 116.9 |
| C | 15 | 224 | 1400789 | 9832.06 | 511 | 507 | 142.4 |
| C | 15 | 157 | 364549 | 2556.12 | 511 | 507 | 142.4 |
| C | 15 | 158 | 169707 | 1188.04 | 511 | 507 | 142.4 |
| D | 8 | 176 | 7570014 | 93756.03 | 279 | 267 | 80.7 |
| D | 1 | 241 | 311672 | 3856.94 | 279 | 267 | 80.7 |
| D | 7 | 70 | 197083 | 2437.69 | 279 | 267 | 80.7 |
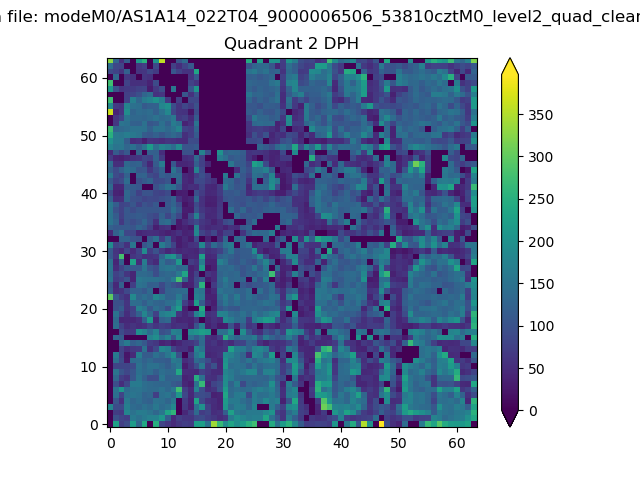
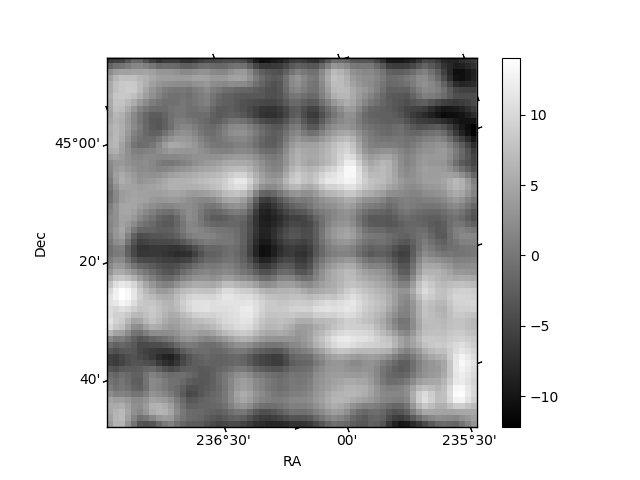
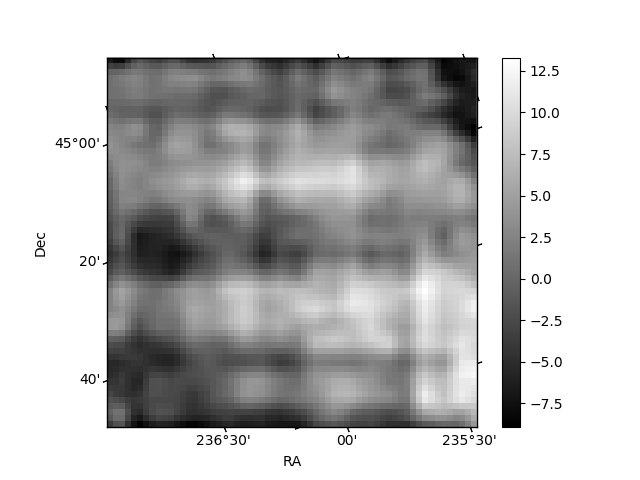
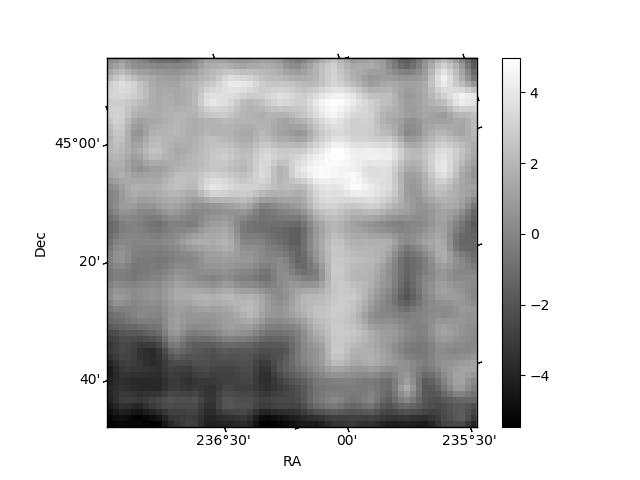
Histogram calculated using DETX and DETY for each event in the final _common_clean file
| Quadrant A | 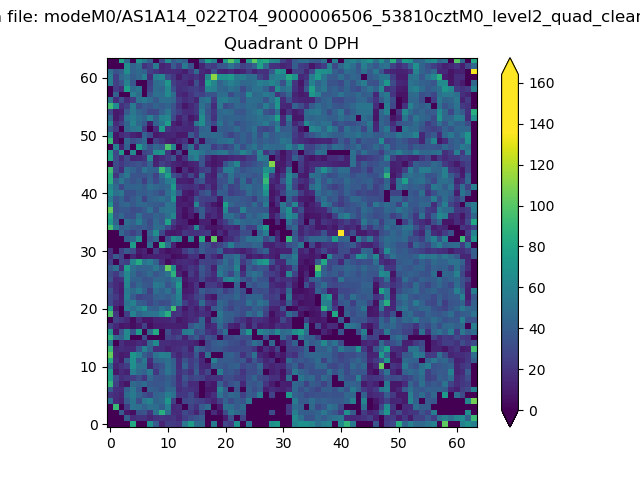 |
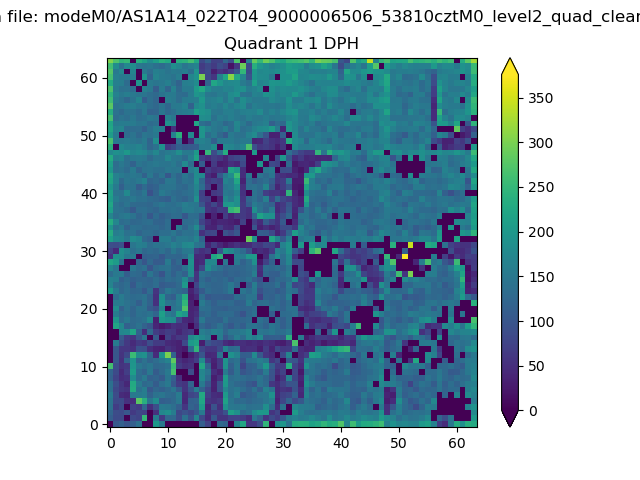 |
Quadrant B |
|---|---|---|---|
| Quadrant D | 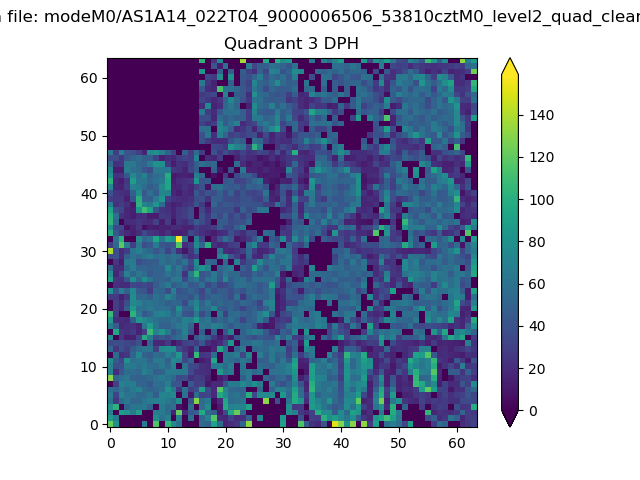 |
 |
Quadrant C |
| Plot type | Count rate plots | Images |
|---|---|---|
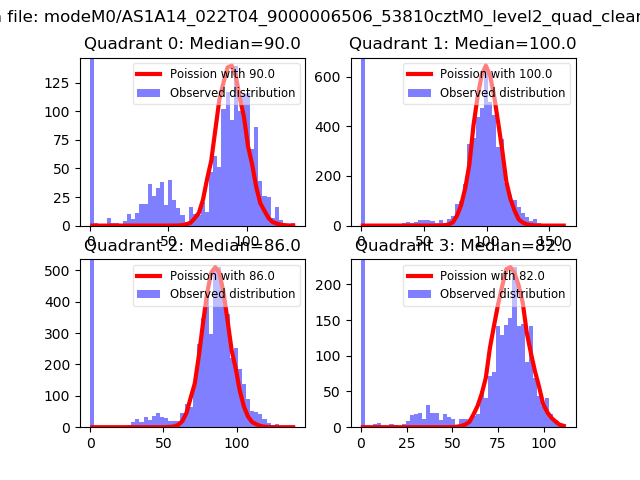
| Comparison with Poisson distribution Blue bars denote a histogram of data divided into 1 sec bins. Red curve is a Poisson curve with rate = median count rate of data. |
 |
 |
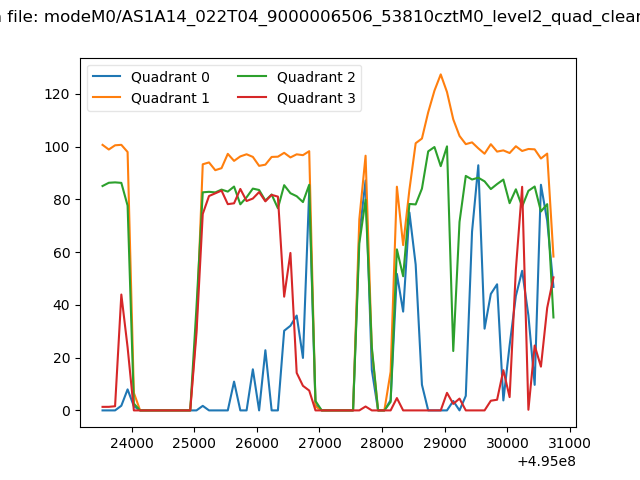
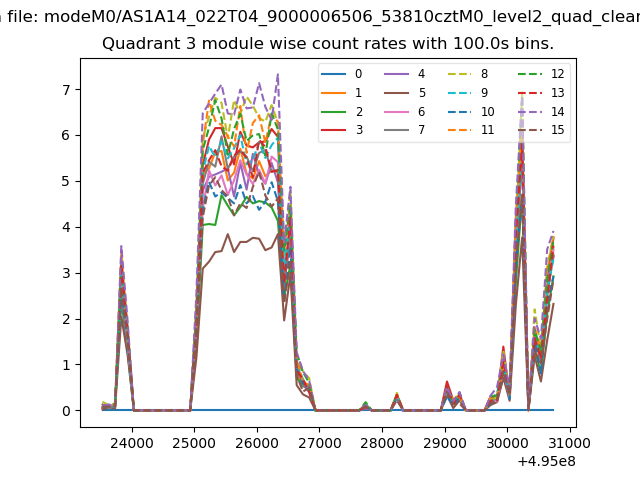
| Quadrant-wise count rates Data is divided into 100 sec bins |
 |
|
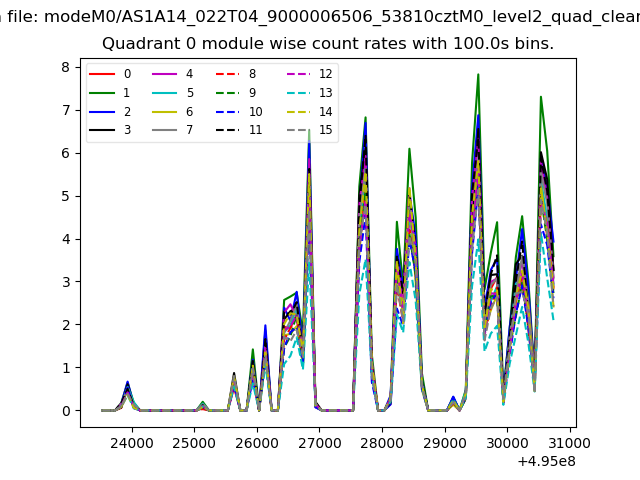
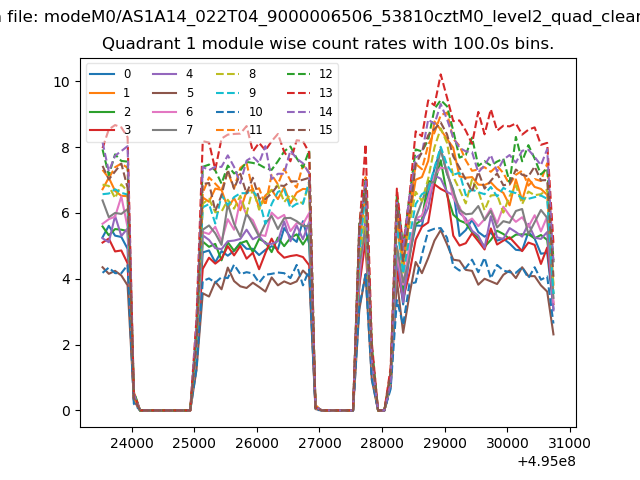
| Module-wise count rates for Quadrant A Data is divided into 100 sec bins |
 |
 |
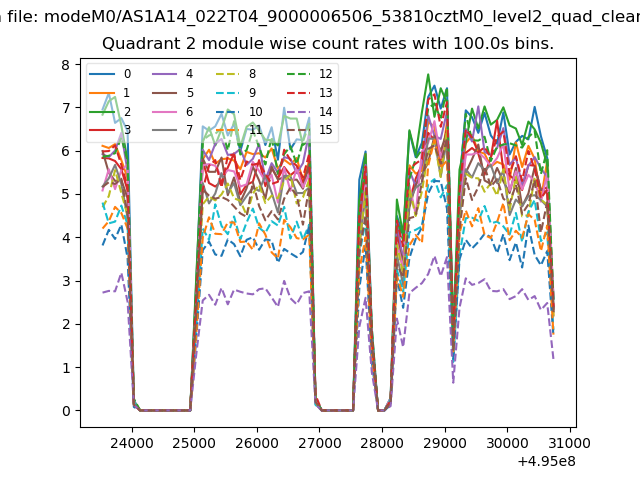
| Module-wise count rates for Quadrant B Data is divided into 100 sec bins |
 |
 |
| Module-wise count rates for Quadrant C Data is divided into 100 sec bins |
 |
 |
| Module-wise count rates for Quadrant D Data is divided into 100 sec bins |
 |
 |
| Parameter | Plot |
|---|---|
| CZT HV Monitor | 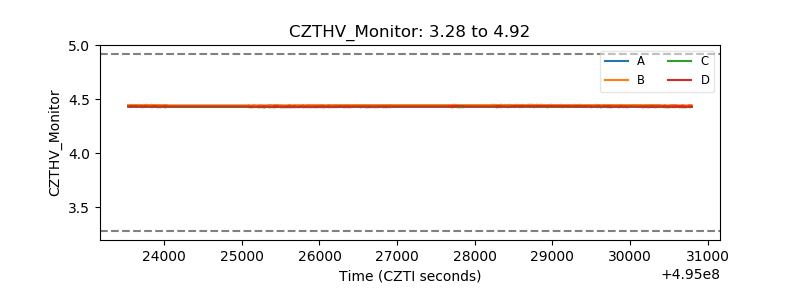 |
| D_VDD | 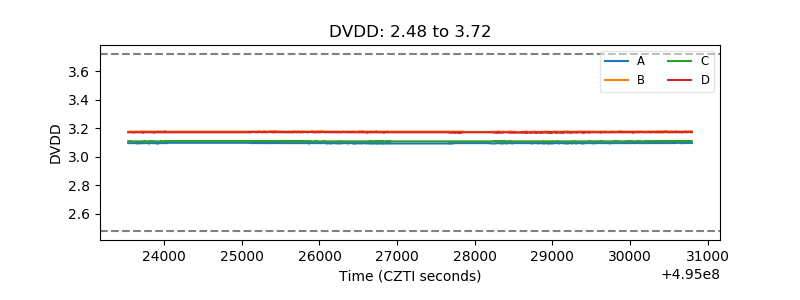 |
| Temperature 1 | 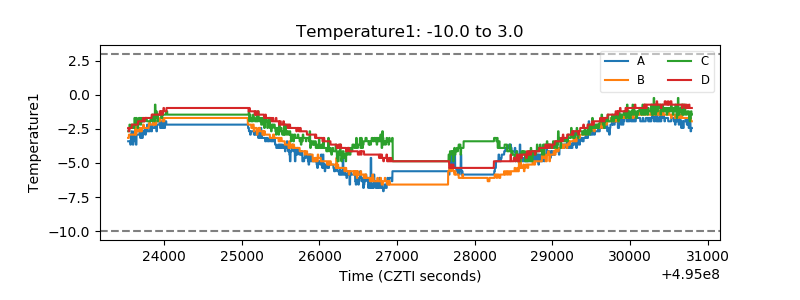 |
| Veto HV Monitor | 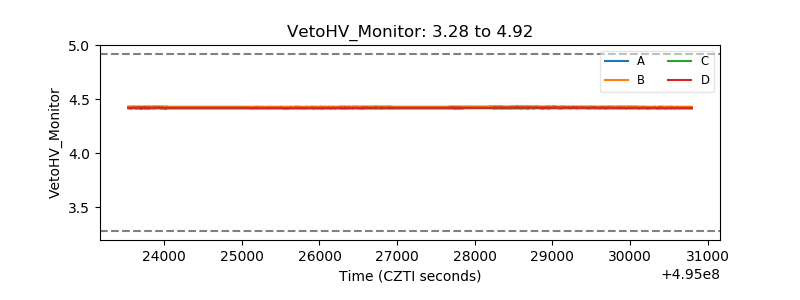 |
| Veto LLD | 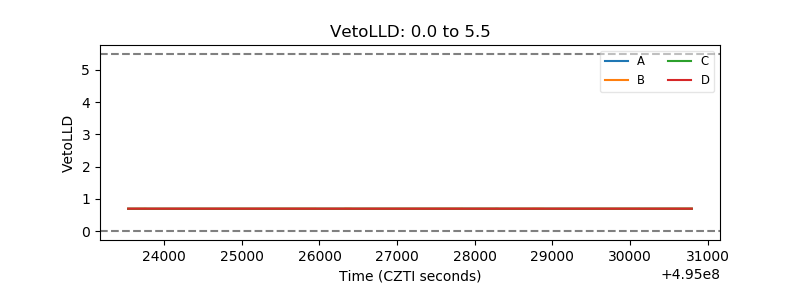 |
| Alpha Counter | 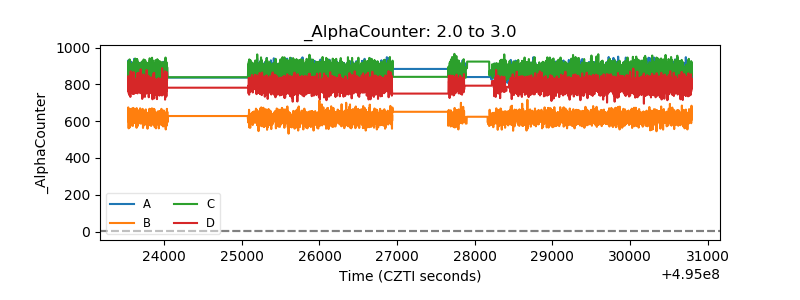 |
| _CPM_Rate | 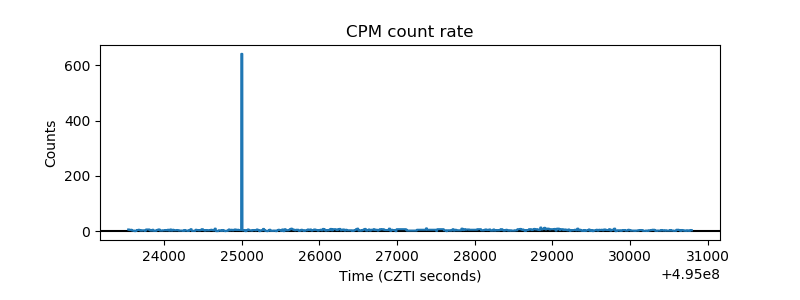 |
| CZT Counter | 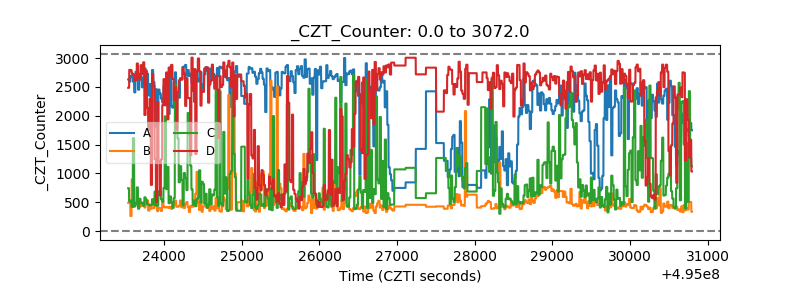 |
| +2.5 Volts monitor |  |
| +5 Volts monitor |  |
| _ROLL_ROT | 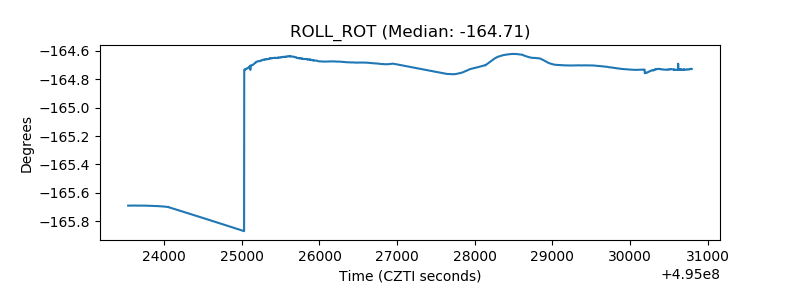 |
| _Roll_DEC | 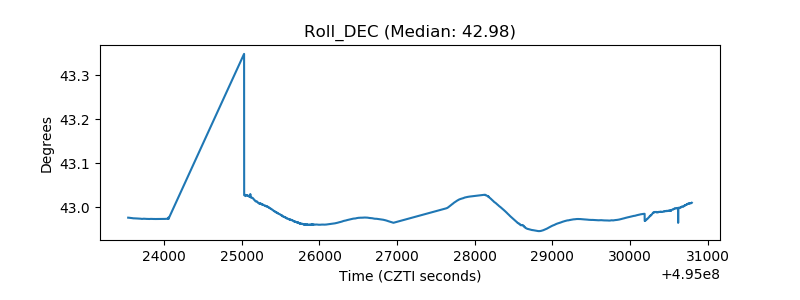 |
| _Roll_RA | 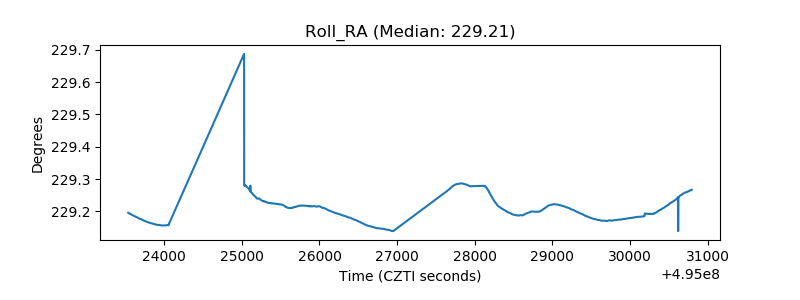 |
| Veto Counter | 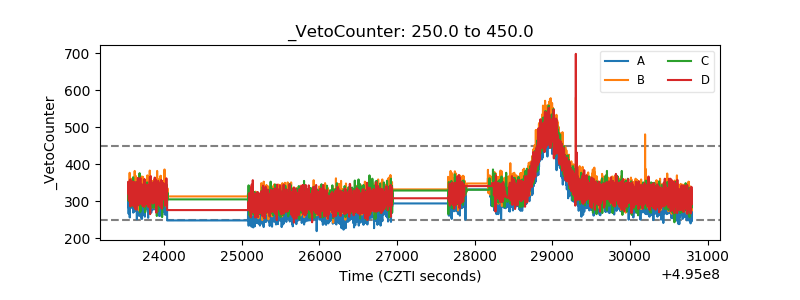 |