| Param | Original file | Final file |
|---|---|---|
| Filename | modeM0/AS1A14_022T04_9000006506_53813cztM0_level2.fits | modeM0/AS1A14_022T04_9000006506_53813cztM0_level2_quad_clean.evt |
| Size (bytes) | 2,756,471,040 | 183,888,000 |
| Size | 2.6 GB | 175.4 MB |
| Events in quadrant A | 37,144,958 | 650,532 |
| Events in quadrant B | 8,856,554 | 1,767,273 |
| Events in quadrant C | 22,915,547 | 1,210,786 |
| Events in quadrant D | 31,730,695 | 692,922 |
| Mode M0 | |||
|---|---|---|---|
| Quadrant | BADHDUFLAG | Total packets | Discarded packets |
| A | 0 | 122925 | 6 |
| B | 0 | 39634 | 3 |
| C | 0 | 80609 | 3 |
| D | 0 | 106718 | 3 |
| Mode SS | |||
|---|---|---|---|
| Quadrant | BADHDUFLAG | Total packets | Discarded packets |
| A | 0 | 368 | 0 |
| B | 0 | 368 | 0 |
| C | 0 | 368 | 0 |
| D | 0 | 368 | 0 |
| Mode M9 | |||
|---|---|---|---|
| Quadrant | BADHDUFLAG | Total packets | Discarded packets |
| A | 0 | 14 | 0 |
| B | 0 | 14 | 0 |
| C | 0 | 14 | 0 |
| D | 0 | 14 | 0 |
| Quadrant | Total seconds | Saturated seconds | Saturation percentage |
|---|---|---|---|
| A | 18051 | 11648 | 64.528281% |
| B | 18052 | 305 | 1.689563% |
| C | 18052 | 4647 | 25.742300% |
| D | 18052 | 10105 | 55.977177% |
Noise dominated data is calculated using 1-second bins in cleaned event files. If a bin has >2000 counts, and if more than 50% of those come from <1% of pixels, then it is considered to be noise-dominated and hence unusable.
| Quadrant | # 1 sec bins | Bins with >0 counts | Bins with >2000 counts | High rate bins dominated by noise | Noise dominated (total time) | Noise dominated (detector-on time) | Marked lightcurve |
|---|---|---|---|---|---|---|---|
| A | 19445 | 18052 | 10965 | 10965 | 56.39% | 60.74% | 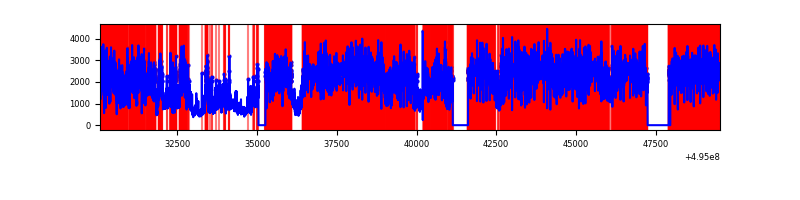 |
| B | 19447 | 18056 | 110 | 110 | 0.57% | 0.61% | 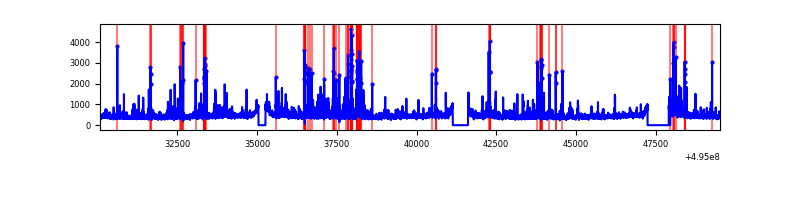 |
| C | 19447 | 18056 | 3660 | 3660 | 18.82% | 20.27% | 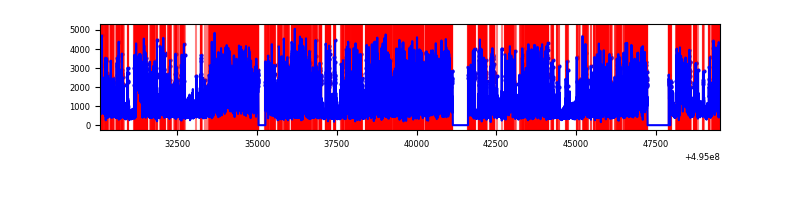 |
| D | 19447 | 18054 | 8150 | 8150 | 41.91% | 45.14% | 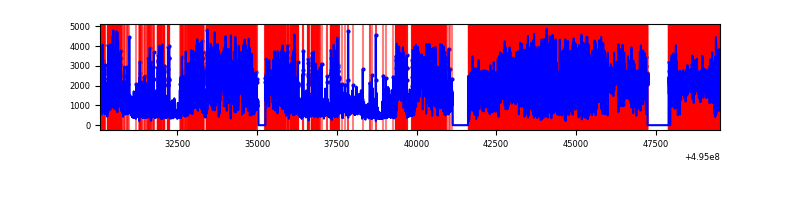 |
Top three noisy pixels from each quadrant. If the there are fewer than three noisy pixels in the level2.evt file, extra rows are filled as -1
| Pixel properties | Quadrant properties | ||||||
|---|---|---|---|---|---|---|---|
| Quadrant | DetID | PixID | Counts | Sigma | Mean | Median | Sigma |
| A | 3 | 63 | 30583927 | 94437.21 | 1311 | 1281 | 323.8 |
| A | 8 | 245 | 371269 | 1142.5 | 1311 | 1281 | 323.8 |
| A | 4 | 249 | 329315 | 1012.95 | 1311 | 1281 | 323.8 |
| B | 5 | 185 | 749633 | 1885.66 | 1876 | 1808 | 396.6 |
| B | 0 | 213 | 193246 | 482.72 | 1876 | 1808 | 396.6 |
| B | 7 | 252 | 75716 | 186.36 | 1876 | 1808 | 396.6 |
| C | 15 | 224 | 11404178 | 25025.08 | 1649 | 1634 | 455.6 |
| C | 15 | 157 | 1931583 | 4235.65 | 1649 | 1634 | 455.6 |
| C | 12 | 2 | 606811 | 1328.18 | 1649 | 1634 | 455.6 |
| D | 8 | 176 | 22048538 | 66435.74 | 1141 | 1092 | 331.9 |
| D | 1 | 241 | 1190813 | 3585.0 | 1141 | 1092 | 331.9 |
| D | 10 | 172 | 1060319 | 3191.78 | 1141 | 1092 | 331.9 |
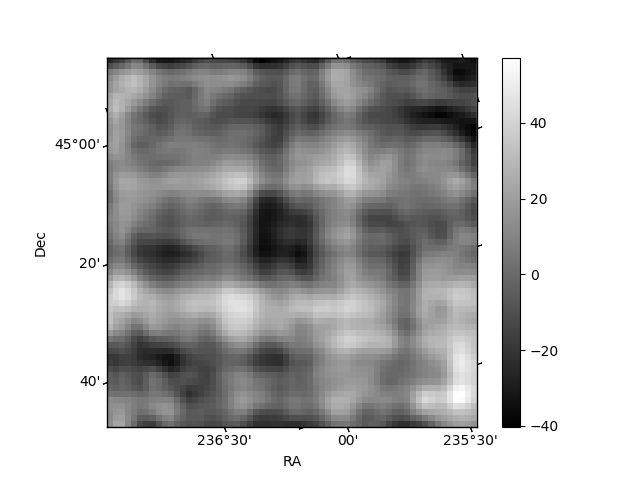
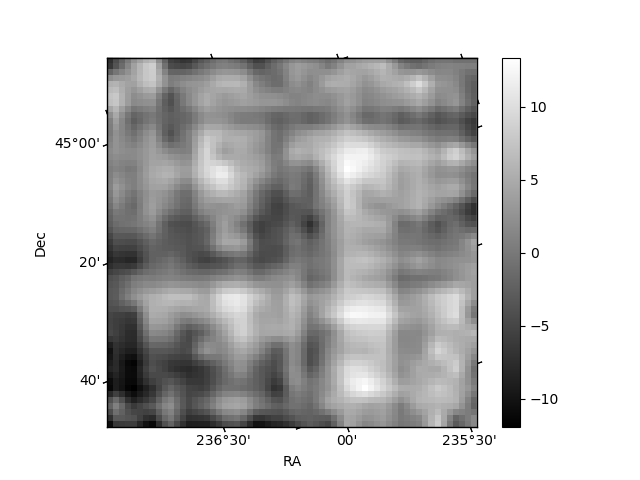
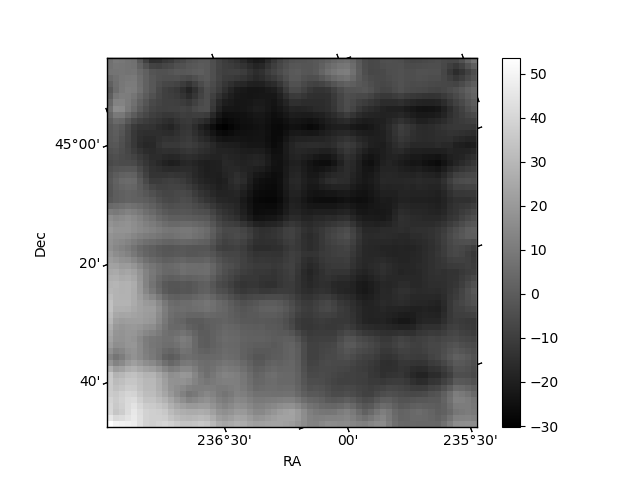
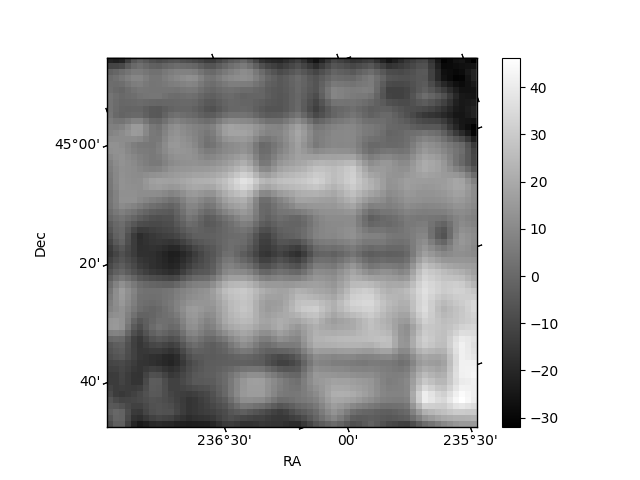
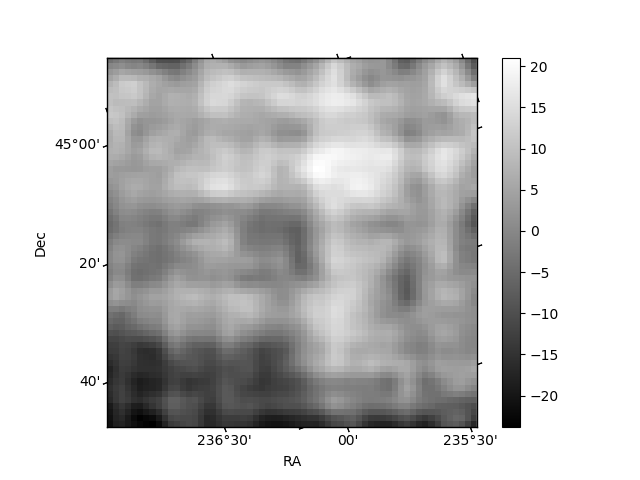
Histogram calculated using DETX and DETY for each event in the final _common_clean file
| Quadrant A | 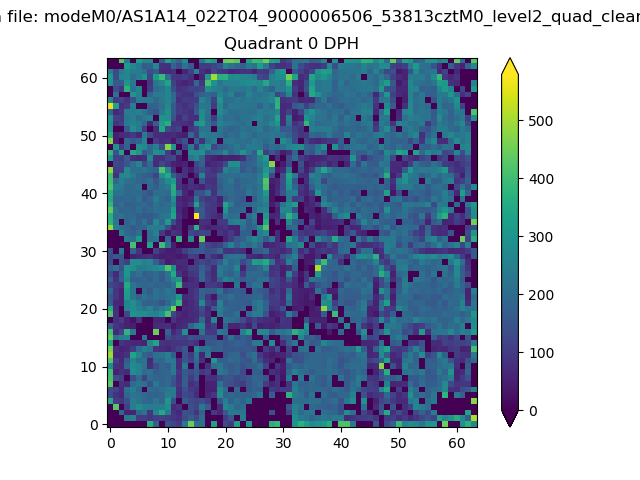 |
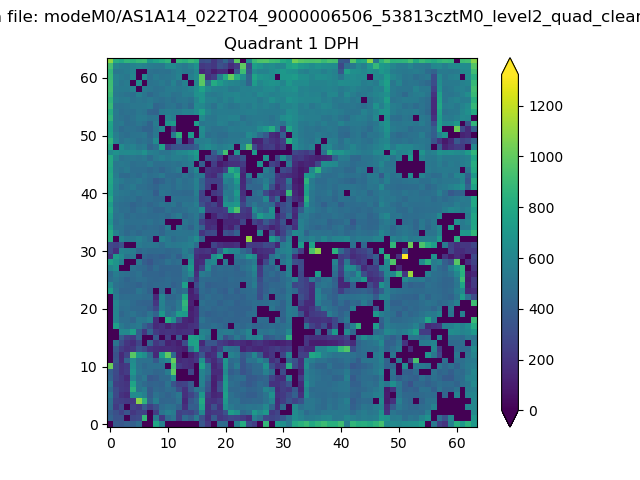 |
Quadrant B |
|---|---|---|---|
| Quadrant D |  |
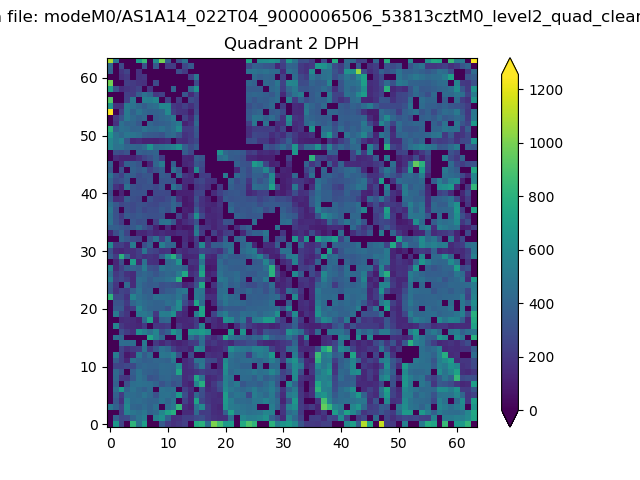 |
Quadrant C |
| Plot type | Count rate plots | Images |
|---|---|---|
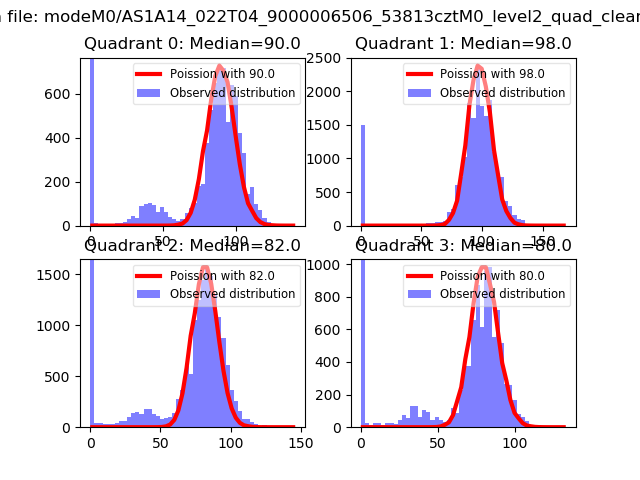
| Comparison with Poisson distribution Blue bars denote a histogram of data divided into 1 sec bins. Red curve is a Poisson curve with rate = median count rate of data. |
 |
 |
| Quadrant-wise count rates Data is divided into 100 sec bins |
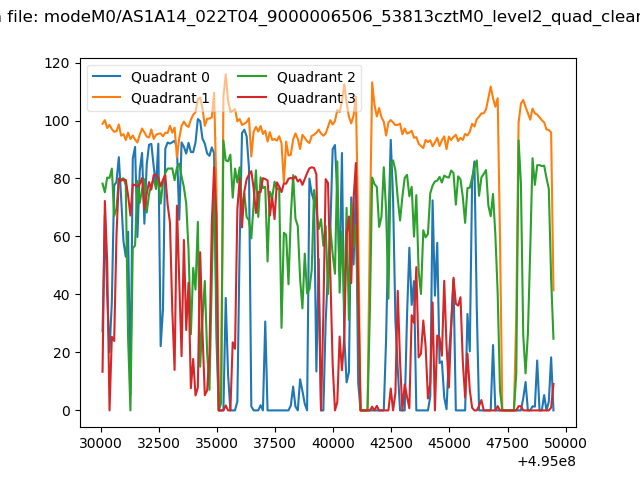 |
|
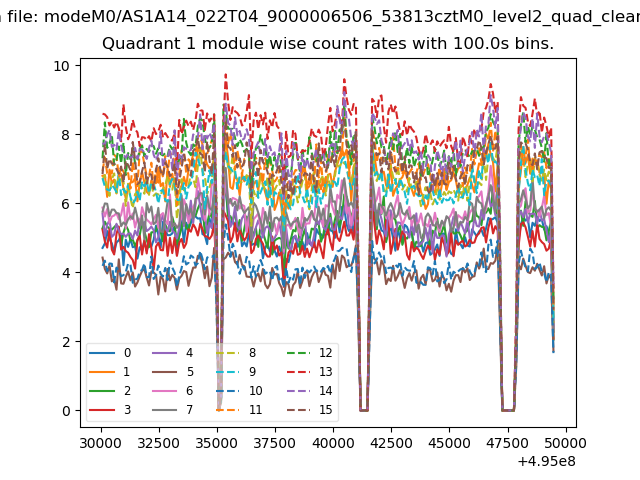
| Module-wise count rates for Quadrant A Data is divided into 100 sec bins |
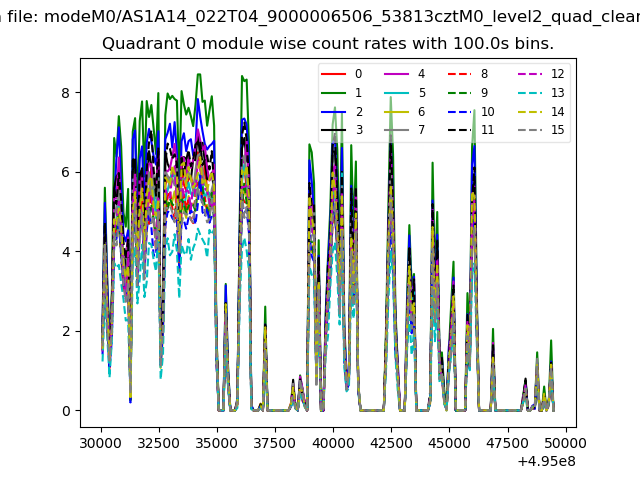 |
 |
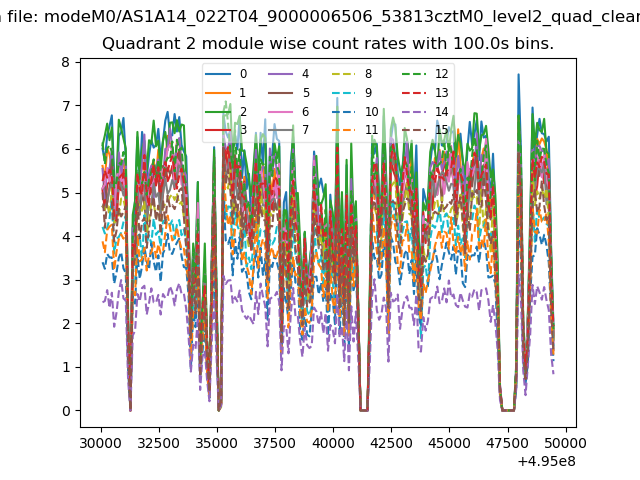
| Module-wise count rates for Quadrant B Data is divided into 100 sec bins |
 |
 |
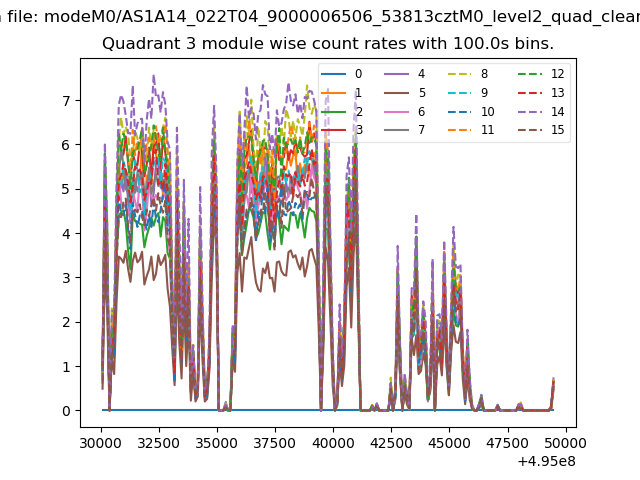
| Module-wise count rates for Quadrant C Data is divided into 100 sec bins |
 |
 |
| Module-wise count rates for Quadrant D Data is divided into 100 sec bins |
 |
 |
| Parameter | Plot |
|---|---|
| CZT HV Monitor | 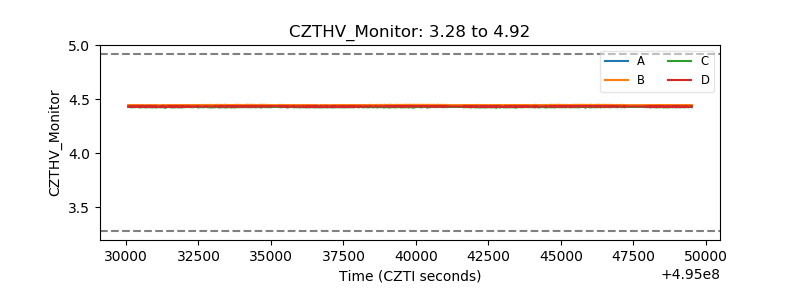 |
| D_VDD | 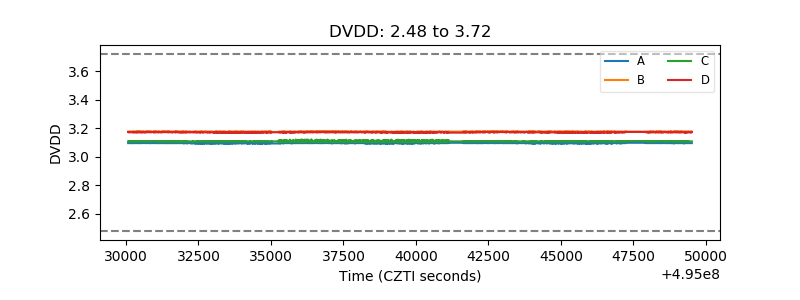 |
| Temperature 1 | 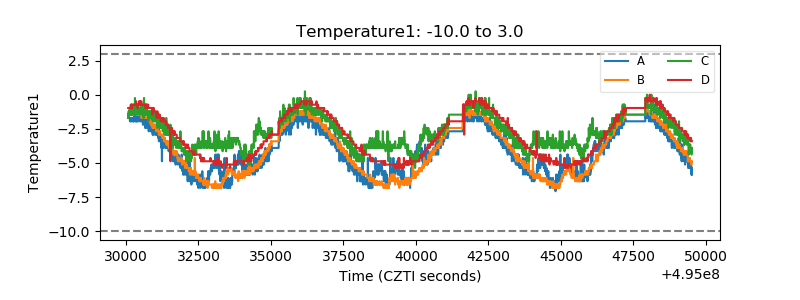 |
| Veto HV Monitor | 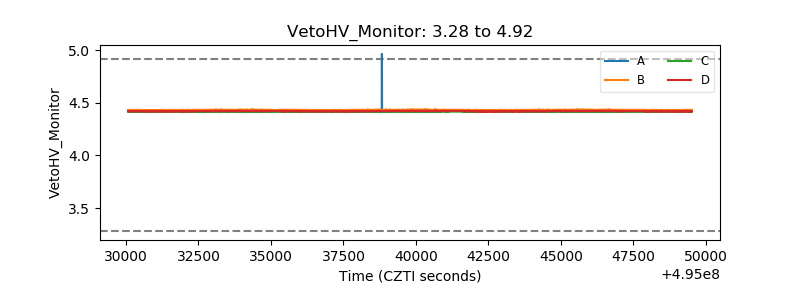 |
| Veto LLD | 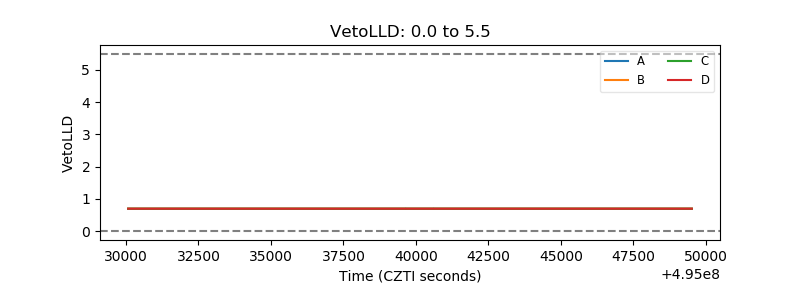 |
| Alpha Counter | 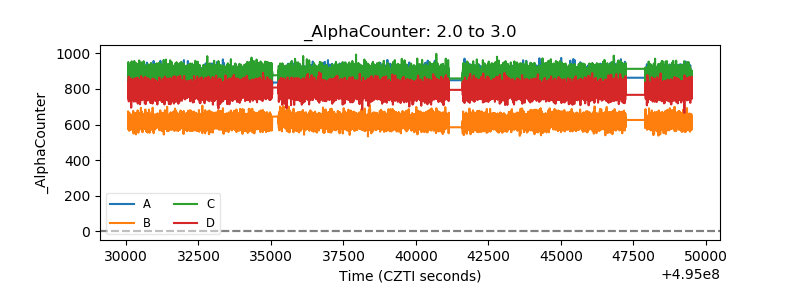 |
| _CPM_Rate | 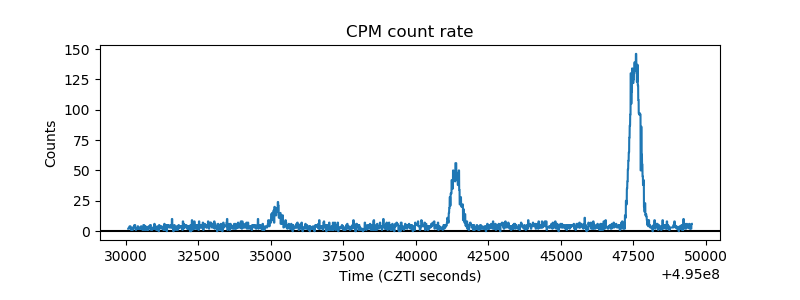 |
| CZT Counter | 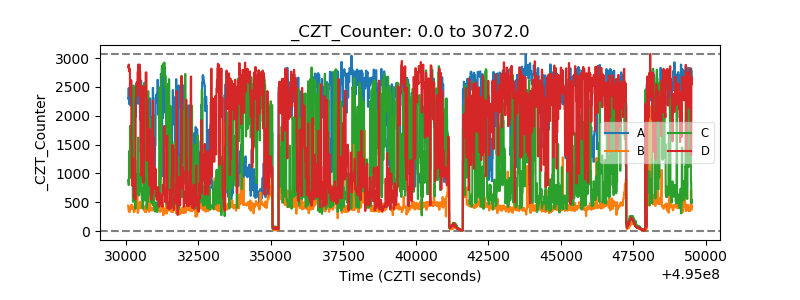 |
| +2.5 Volts monitor | 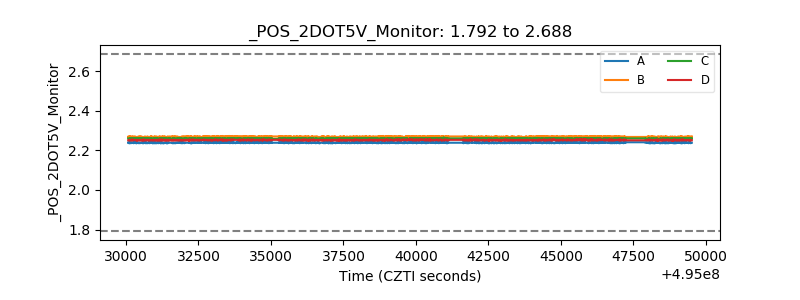 |
| +5 Volts monitor | 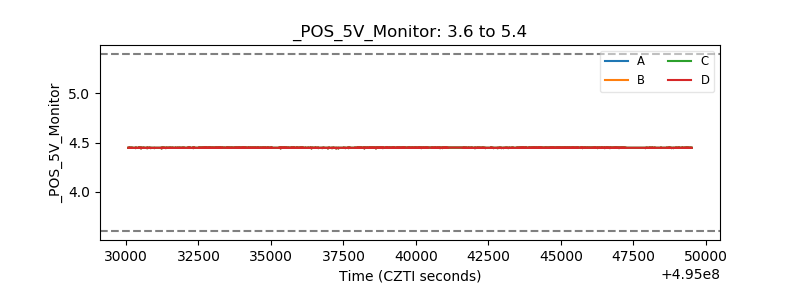 |
| _ROLL_ROT | 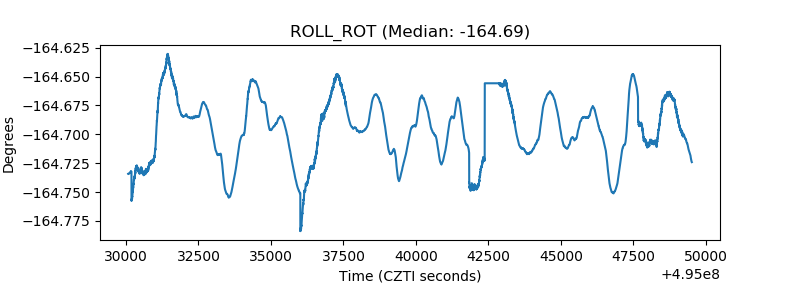 |
| _Roll_DEC | 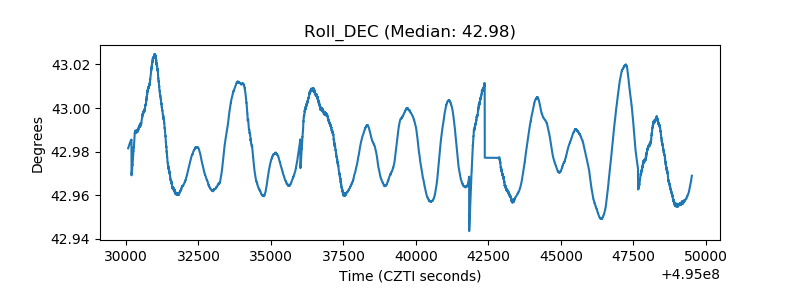 |
| _Roll_RA | 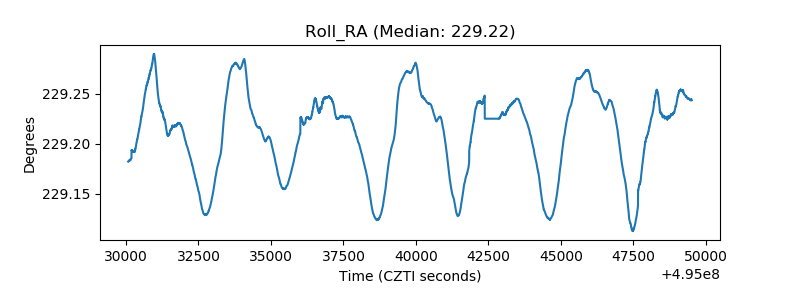 |
| Veto Counter | 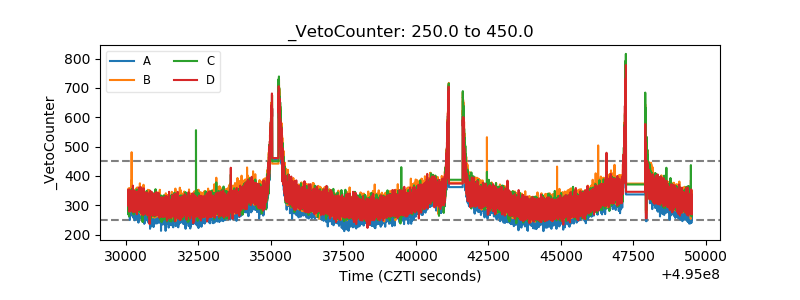 |