| Param | Original file | Final file |
|---|---|---|
| Filename | modeM0/AS1A14_022T04_9000006506_53814cztM0_level2.fits | modeM0/AS1A14_022T04_9000006506_53814cztM0_level2_quad_clean.evt |
| Size (bytes) | 2,829,715,200 | 177,805,440 |
| Size | 2.6 GB | 169.6 MB |
| Events in quadrant A | 36,995,526 | 606,176 |
| Events in quadrant B | 9,160,801 | 1,757,272 |
| Events in quadrant C | 22,284,396 | 1,213,453 |
| Events in quadrant D | 34,940,172 | 579,564 |
| Mode M0 | |||
|---|---|---|---|
| Quadrant | BADHDUFLAG | Total packets | Discarded packets |
| A | 0 | 122322 | 2 |
| B | 0 | 40187 | 4 |
| C | 0 | 78480 | 2 |
| D | 0 | 116052 | 7 |
| Mode SS | |||
|---|---|---|---|
| Quadrant | BADHDUFLAG | Total packets | Discarded packets |
| A | 0 | 360 | 0 |
| B | 0 | 360 | 0 |
| C | 0 | 360 | 0 |
| D | 0 | 360 | 0 |
| Mode M9 | |||
|---|---|---|---|
| Quadrant | BADHDUFLAG | Total packets | Discarded packets |
| A | 0 | 11 | 0 |
| B | 0 | 11 | 0 |
| C | 0 | 11 | 0 |
| D | 0 | 11 | 0 |
| Quadrant | Total seconds | Saturated seconds | Saturation percentage |
|---|---|---|---|
| A | 17780 | 11740 | 66.029246% |
| B | 17779 | 326 | 1.833624% |
| C | 17781 | 4404 | 24.768011% |
| D | 17780 | 11307 | 63.593926% |
Noise dominated data is calculated using 1-second bins in cleaned event files. If a bin has >2000 counts, and if more than 50% of those come from <1% of pixels, then it is considered to be noise-dominated and hence unusable.
| Quadrant | # 1 sec bins | Bins with >0 counts | Bins with >2000 counts | High rate bins dominated by noise | Noise dominated (total time) | Noise dominated (detector-on time) | Marked lightcurve |
|---|---|---|---|---|---|---|---|
| A | 31494 | 17782 | 11174 | 11174 | 35.48% | 62.84% | 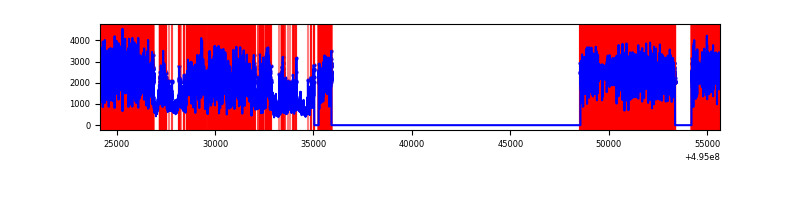 |
| B | 31495 | 17782 | 119 | 119 | 0.38% | 0.67% | 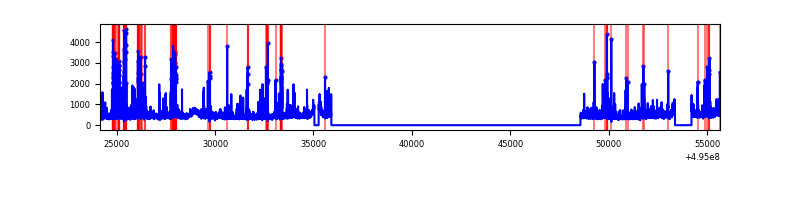 |
| C | 31496 | 17783 | 3769 | 3769 | 11.97% | 21.19% | 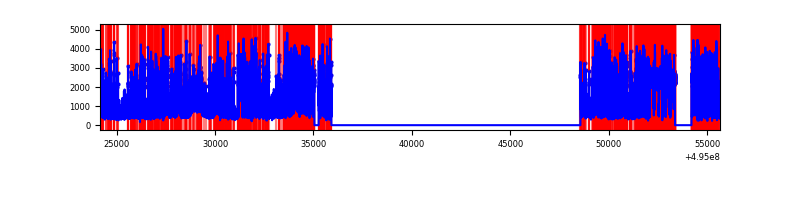 |
| D | 31495 | 17782 | 9957 | 9957 | 31.61% | 55.99% | 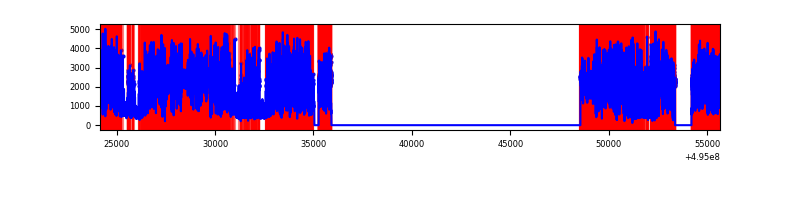 |
Top three noisy pixels from each quadrant. If the there are fewer than three noisy pixels in the level2.evt file, extra rows are filled as -1
| Pixel properties | Quadrant properties | ||||||
|---|---|---|---|---|---|---|---|
| Quadrant | DetID | PixID | Counts | Sigma | Mean | Median | Sigma |
| A | 3 | 63 | 31043987 | 101323.11 | 1241 | 1213 | 306.4 |
| A | 4 | 249 | 417161 | 1357.65 | 1241 | 1213 | 306.4 |
| A | 8 | 249 | 256046 | 831.77 | 1241 | 1213 | 306.4 |
| B | 5 | 185 | 1052913 | 2663.23 | 1863 | 1798 | 394.7 |
| B | 0 | 213 | 145248 | 363.46 | 1863 | 1798 | 394.7 |
| B | 5 | 172 | 102586 | 255.37 | 1863 | 1798 | 394.7 |
| C | 15 | 224 | 7127091 | 16200.98 | 1600 | 1590 | 439.8 |
| C | 1 | 241 | 3921434 | 8912.4 | 1600 | 1590 | 439.8 |
| C | 15 | 157 | 2547116 | 5787.67 | 1600 | 1590 | 439.8 |
| D | 8 | 176 | 24360880 | 80016.32 | 1045 | 1001 | 304.4 |
| D | 2 | 172 | 1701240 | 5584.87 | 1045 | 1001 | 304.4 |
| D | 1 | 241 | 1239719 | 4068.89 | 1045 | 1001 | 304.4 |
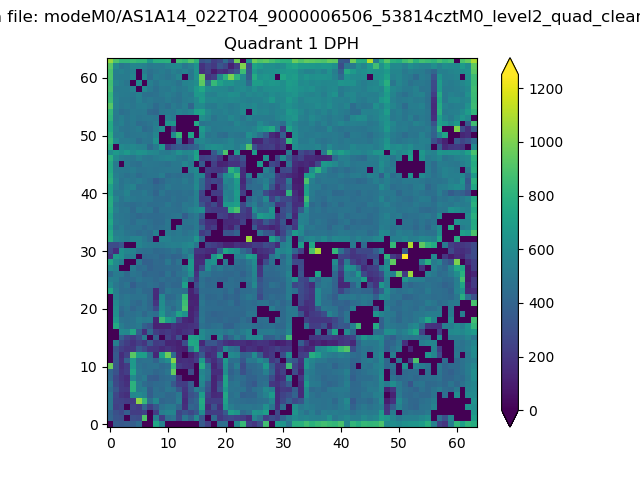
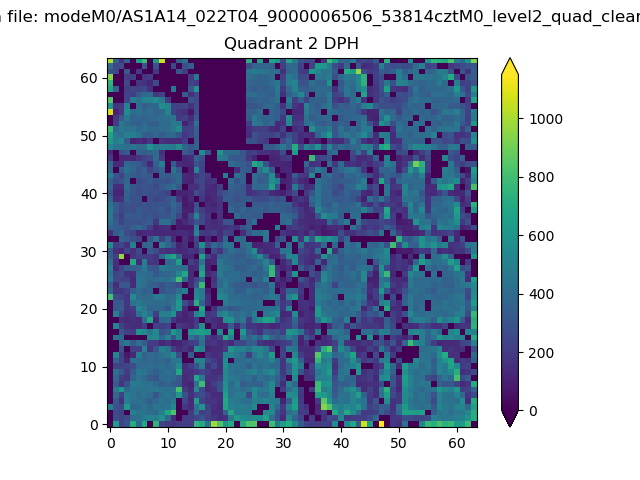
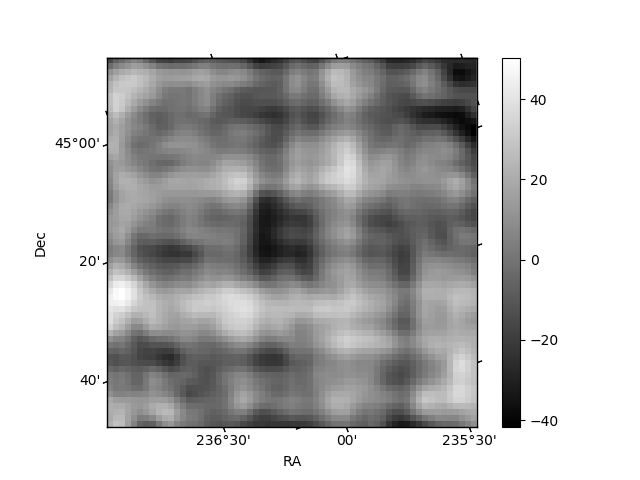
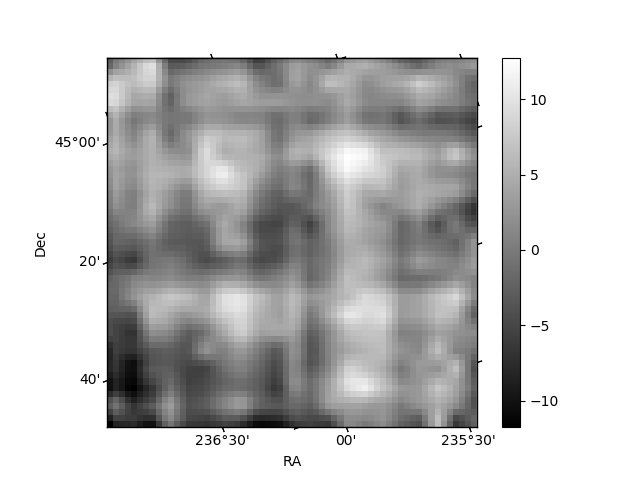
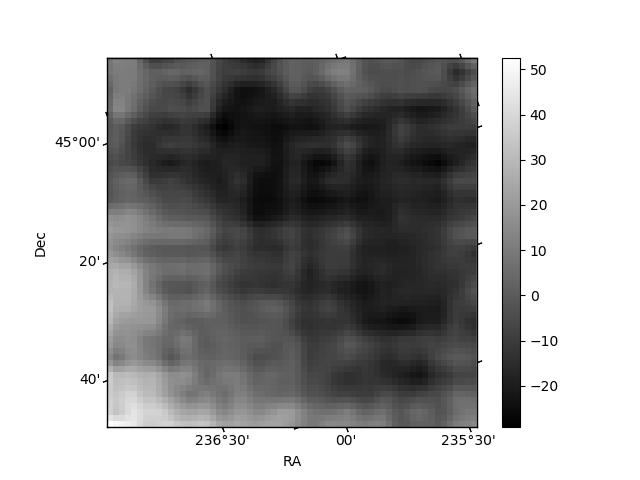
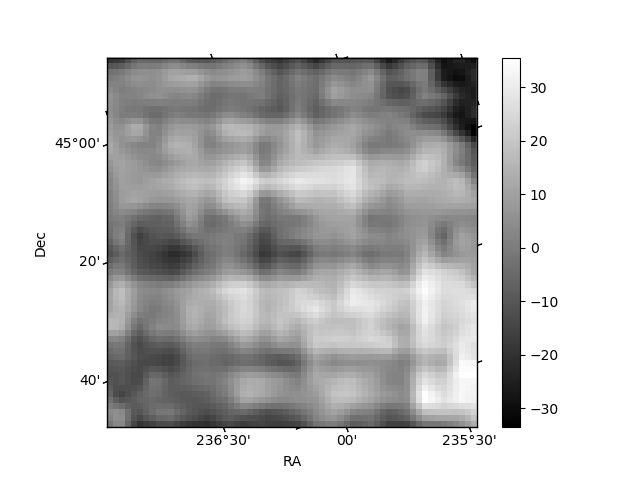
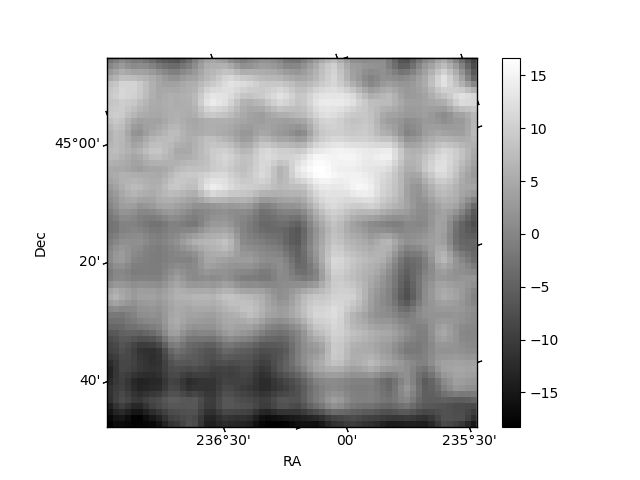
Histogram calculated using DETX and DETY for each event in the final _common_clean file
| Quadrant A |  |
 |
Quadrant B |
|---|---|---|---|
| Quadrant D | 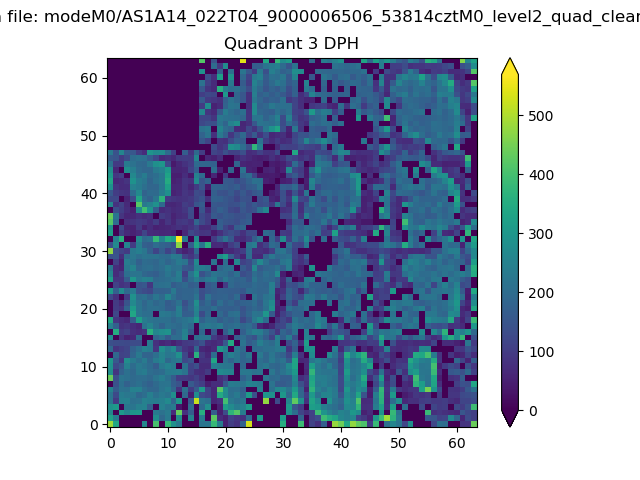 |
 |
Quadrant C |
| Plot type | Count rate plots | Images |
|---|---|---|
| Comparison with Poisson distribution Blue bars denote a histogram of data divided into 1 sec bins. Red curve is a Poisson curve with rate = median count rate of data. |
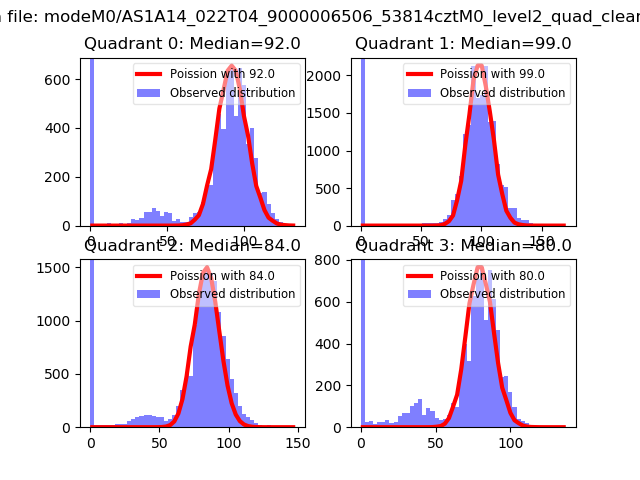 |
 |
| Quadrant-wise count rates Data is divided into 100 sec bins |
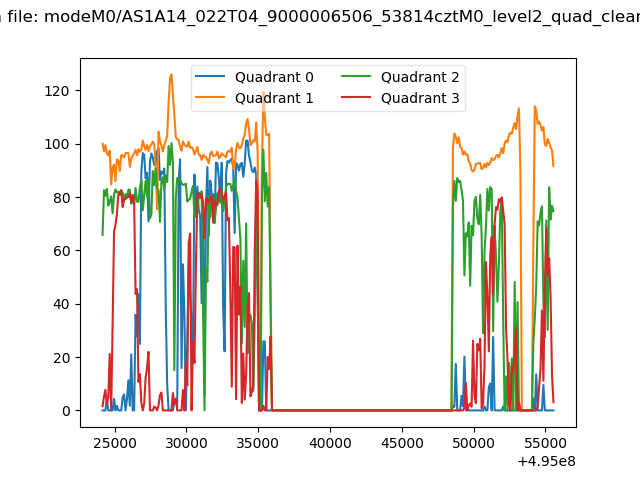 |
|
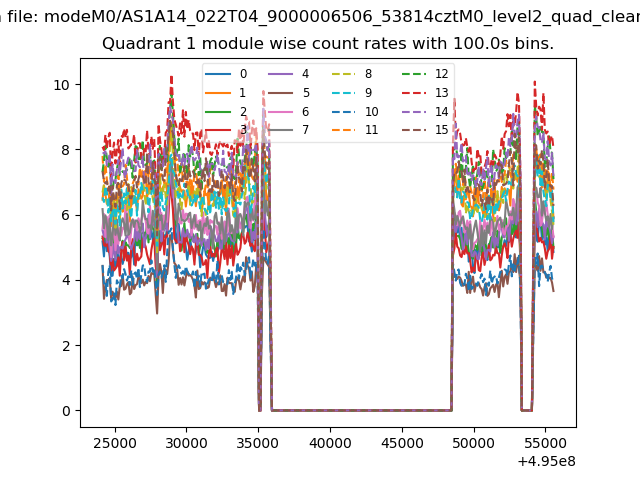
| Module-wise count rates for Quadrant A Data is divided into 100 sec bins |
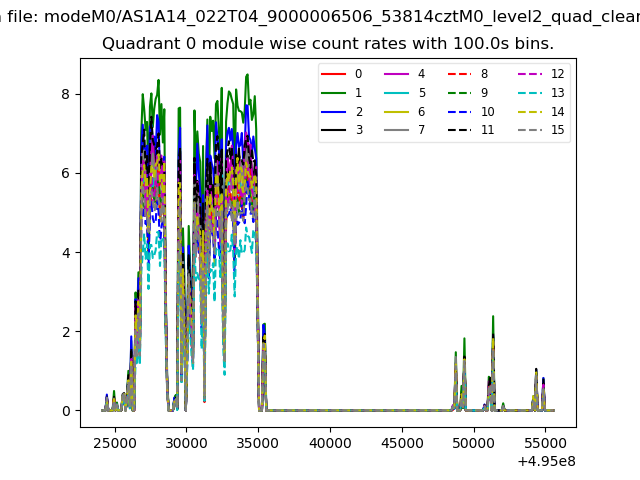 |
 |
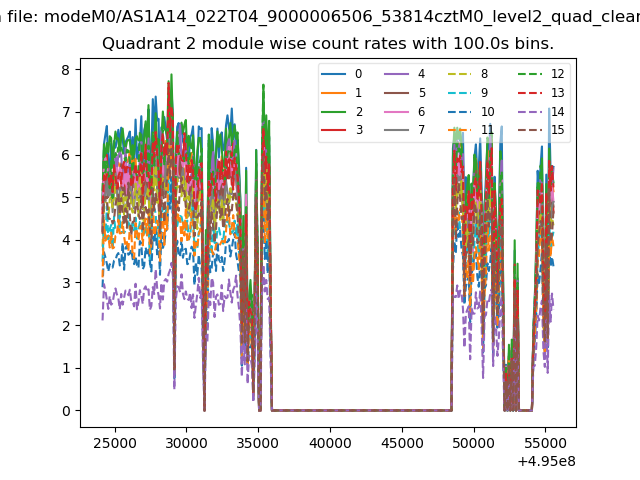
| Module-wise count rates for Quadrant B Data is divided into 100 sec bins |
 |
 |
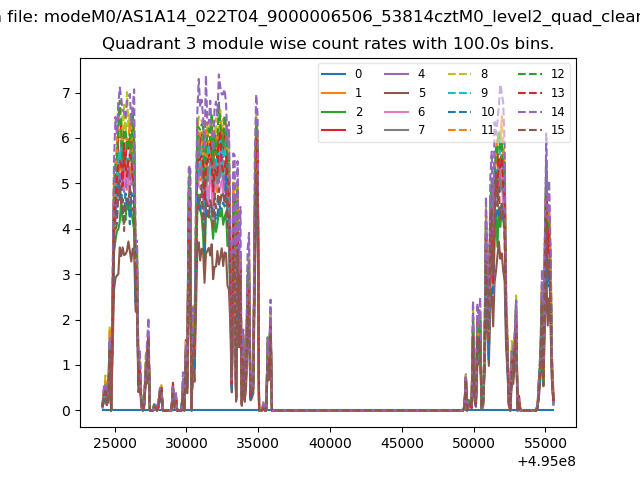
| Module-wise count rates for Quadrant C Data is divided into 100 sec bins |
 |
 |
| Module-wise count rates for Quadrant D Data is divided into 100 sec bins |
 |
 |
| Parameter | Plot |
|---|---|
| CZT HV Monitor | 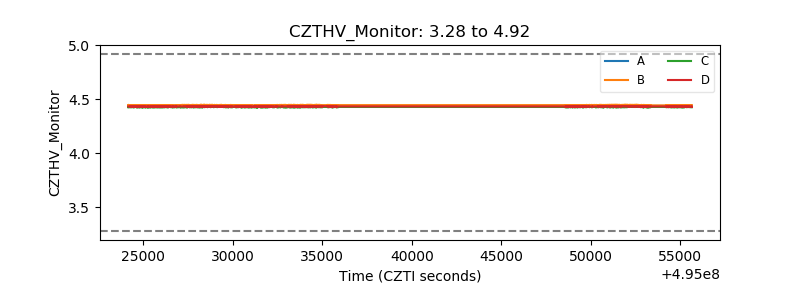 |
| D_VDD | 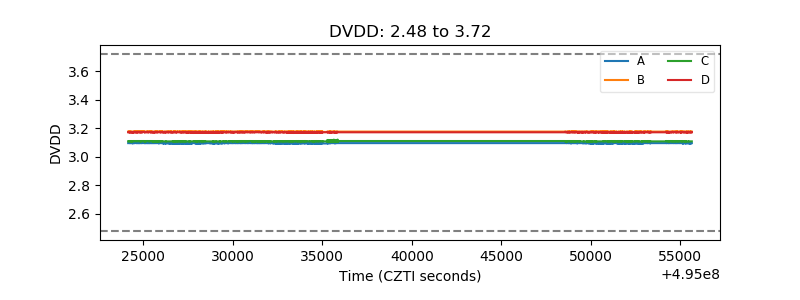 |
| Temperature 1 | 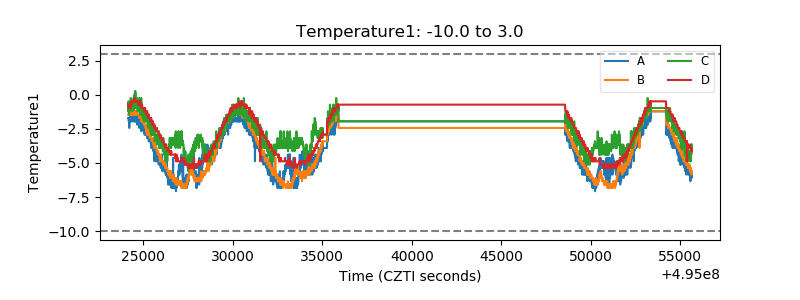 |
| Veto HV Monitor | 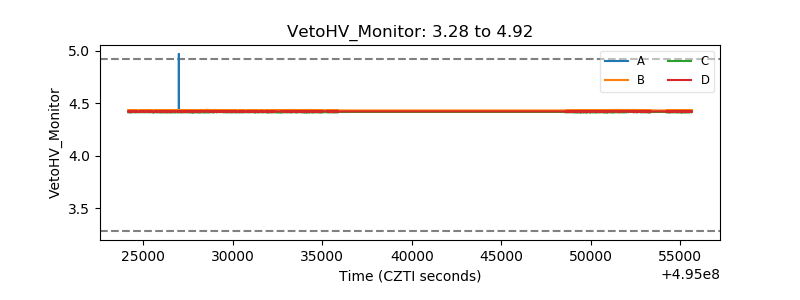 |
| Veto LLD | 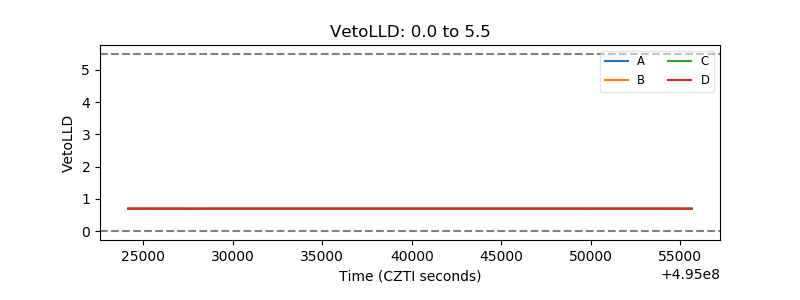 |
| Alpha Counter | 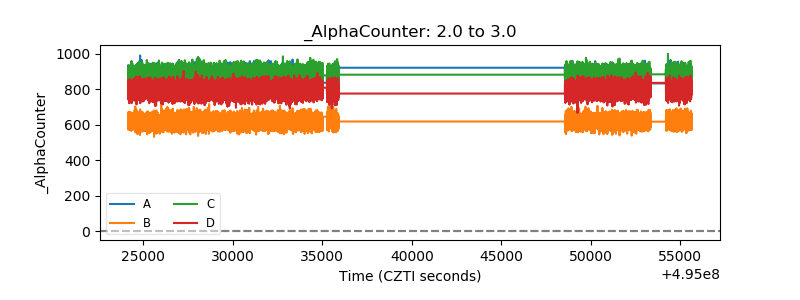 |
| _CPM_Rate | 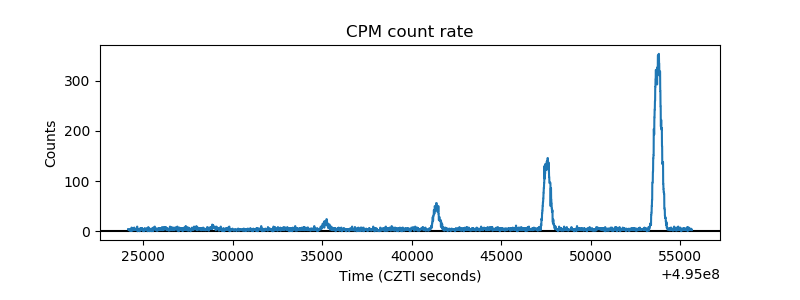 |
| CZT Counter | 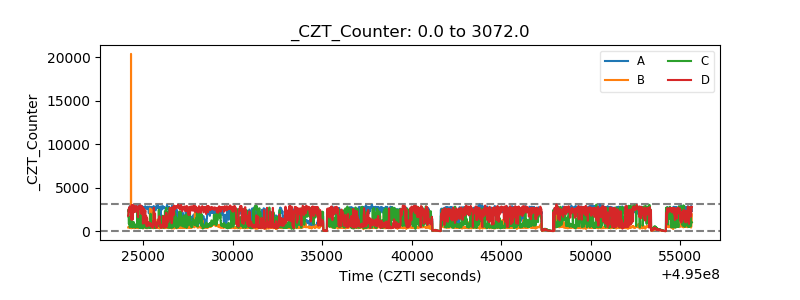 |
| +2.5 Volts monitor |  |
| +5 Volts monitor |  |
| _ROLL_ROT | 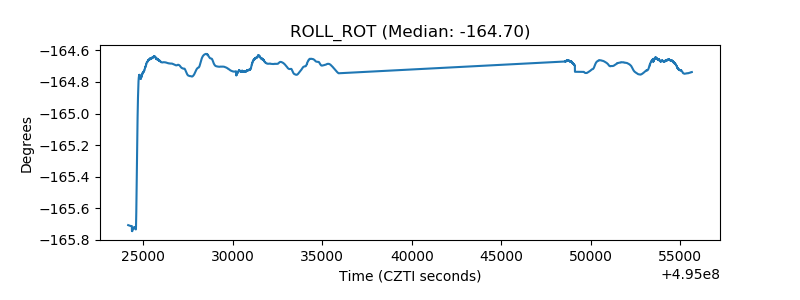 |
| _Roll_DEC | 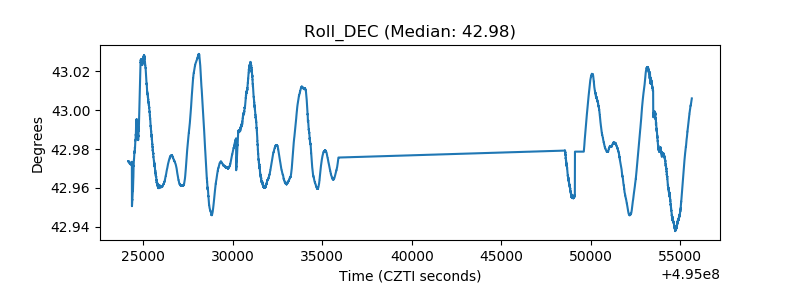 |
| _Roll_RA | 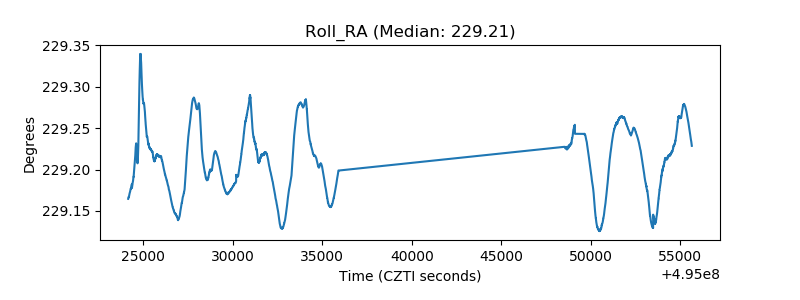 |
| Veto Counter | 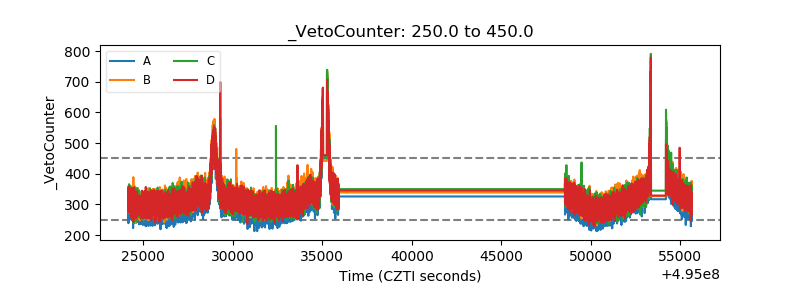 |