| Param | Original file | Final file |
|---|---|---|
| Filename | modeM0/AS1A14_022T04_9000006506_53817cztM0_level2.fits | modeM0/AS1A14_022T04_9000006506_53817cztM0_level2_quad_clean.evt |
| Size (bytes) | 1,076,973,120 | 68,132,160 |
| Size | 1.0 GB | 65.0 MB |
| Events in quadrant A | 15,059,101 | 212,895 |
| Events in quadrant B | 3,930,216 | 686,492 |
| Events in quadrant C | 7,933,860 | 541,378 |
| Events in quadrant D | 12,423,458 | 152,567 |
| Mode M0 | |||
|---|---|---|---|
| Quadrant | BADHDUFLAG | Total packets | Discarded packets |
| A | 0 | 49341 | 2 |
| B | 0 | 16574 | 2 |
| C | 0 | 28256 | 2 |
| D | 0 | 41507 | 2 |
| Mode SS | |||
|---|---|---|---|
| Quadrant | BADHDUFLAG | Total packets | Discarded packets |
| A | 0 | 138 | 0 |
| B | 0 | 138 | 0 |
| C | 0 | 138 | 0 |
| D | 0 | 138 | 0 |
| Mode M9 | |||
|---|---|---|---|
| Quadrant | BADHDUFLAG | Total packets | Discarded packets |
| A | 0 | 15 | 0 |
| B | 0 | 16 | 0 |
| C | 0 | 16 | 0 |
| D | 0 | 16 | 0 |
| Quadrant | Total seconds | Saturated seconds | Saturation percentage |
|---|---|---|---|
| A | 6725 | 4854 | 72.178439% |
| B | 6725 | 218 | 3.241636% |
| C | 6725 | 1194 | 17.754647% |
| D | 6725 | 4974 | 73.962825% |
Noise dominated data is calculated using 1-second bins in cleaned event files. If a bin has >2000 counts, and if more than 50% of those come from <1% of pixels, then it is considered to be noise-dominated and hence unusable.
| Quadrant | # 1 sec bins | Bins with >0 counts | Bins with >2000 counts | High rate bins dominated by noise | Noise dominated (total time) | Noise dominated (detector-on time) | Marked lightcurve |
|---|---|---|---|---|---|---|---|
| A | 7845 | 6725 | 4870 | 4870 | 62.08% | 72.42% | 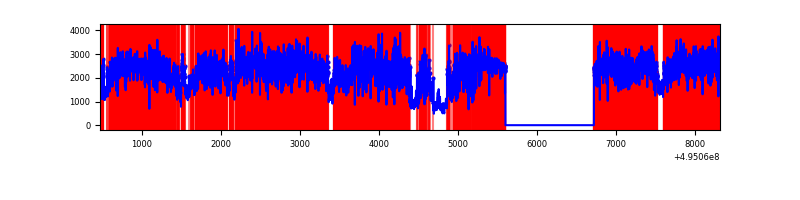 |
| B | 7845 | 6726 | 130 | 130 | 1.66% | 1.93% | 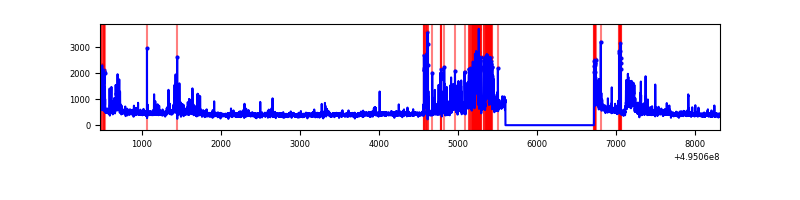 |
| C | 7845 | 6726 | 1021 | 1021 | 13.01% | 15.18% | 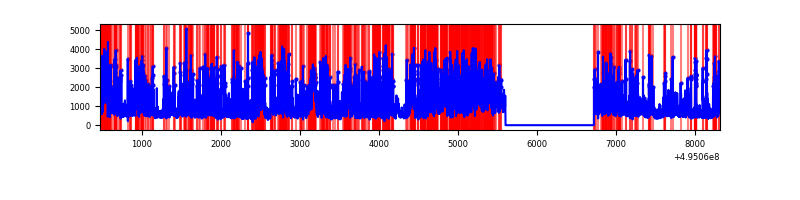 |
| D | 7844 | 6724 | 3483 | 3483 | 44.40% | 51.80% | 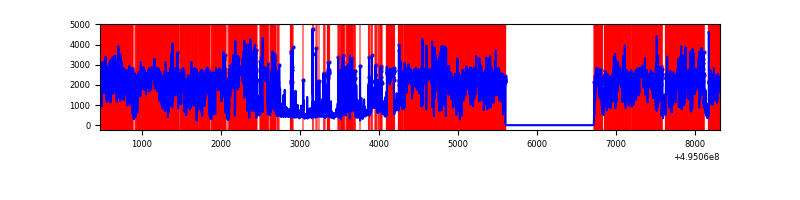 |
Top three noisy pixels from each quadrant. If the there are fewer than three noisy pixels in the level2.evt file, extra rows are filled as -1
| Pixel properties | Quadrant properties | ||||||
|---|---|---|---|---|---|---|---|
| Quadrant | DetID | PixID | Counts | Sigma | Mean | Median | Sigma |
| A | 3 | 63 | 12672510 | 97688.91 | 520 | 509 | 129.7 |
| A | 4 | 249 | 154482 | 1186.98 | 520 | 509 | 129.7 |
| A | 8 | 249 | 95834 | 734.86 | 520 | 509 | 129.7 |
| B | 5 | 172 | 560428 | 3672.7 | 708 | 683 | 152.4 |
| B | 8 | 234 | 194045 | 1268.72 | 708 | 683 | 152.4 |
| B | 7 | 0 | 96934 | 631.54 | 708 | 683 | 152.4 |
| C | 15 | 224 | 4154476 | 22855.3 | 654 | 647 | 181.7 |
| C | 15 | 158 | 305859 | 1679.34 | 654 | 647 | 181.7 |
| C | 1 | 241 | 290303 | 1593.75 | 654 | 647 | 181.7 |
| D | 8 | 176 | 7813911 | 97241.38 | 273 | 259 | 80.4 |
| D | 2 | 172 | 2643391 | 32893.94 | 273 | 259 | 80.4 |
| D | 10 | 172 | 415792 | 5171.33 | 273 | 259 | 80.4 |
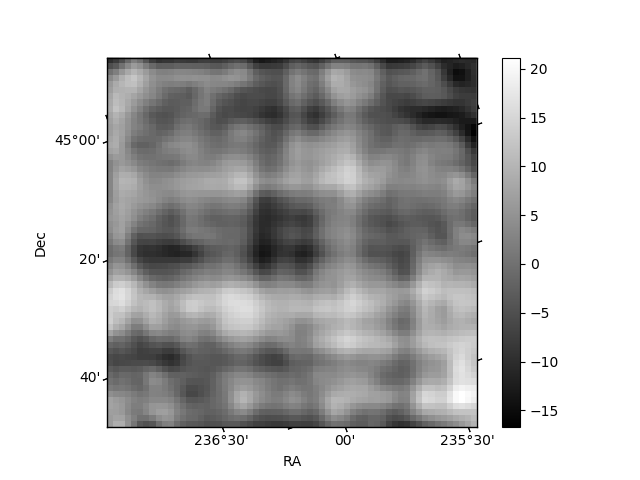
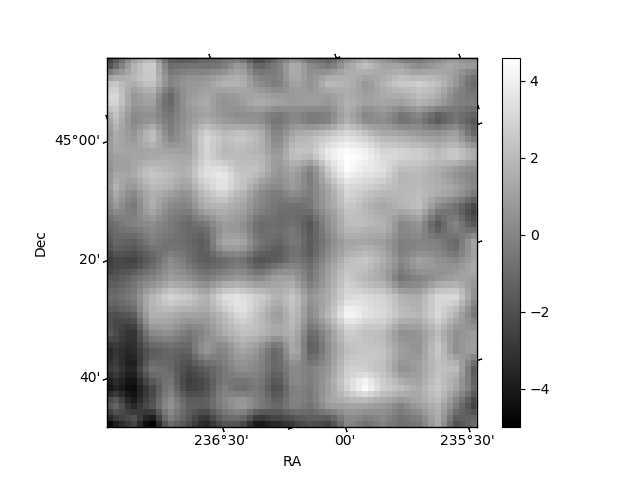
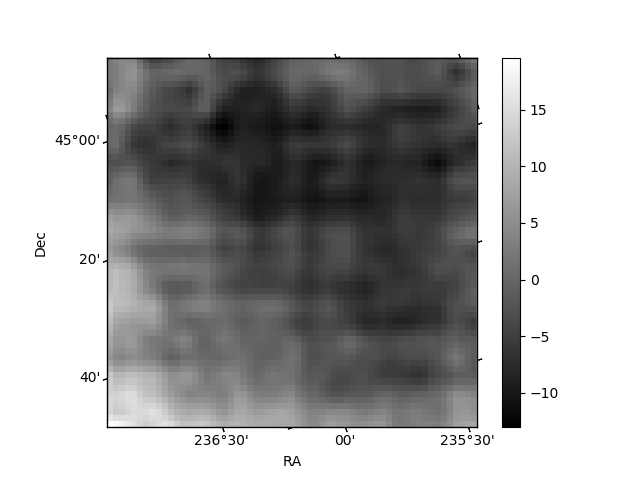
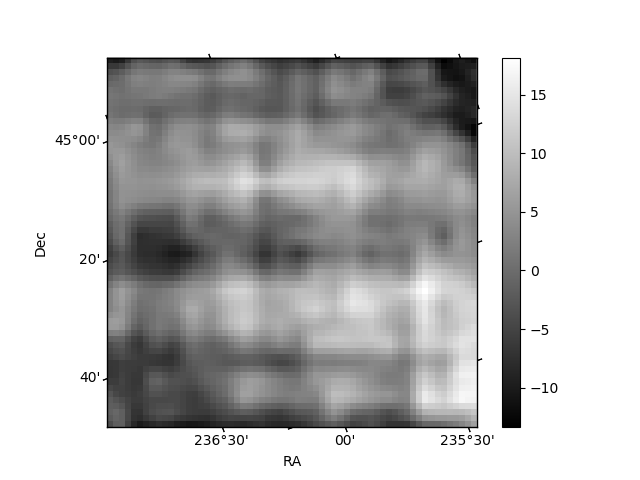
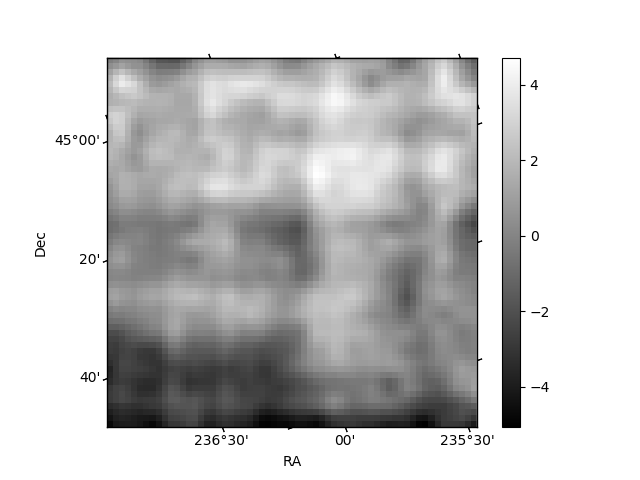
Histogram calculated using DETX and DETY for each event in the final _common_clean file
| Quadrant A | 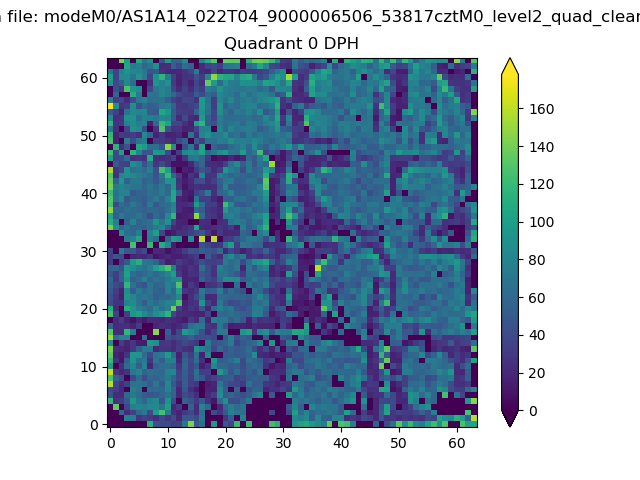 |
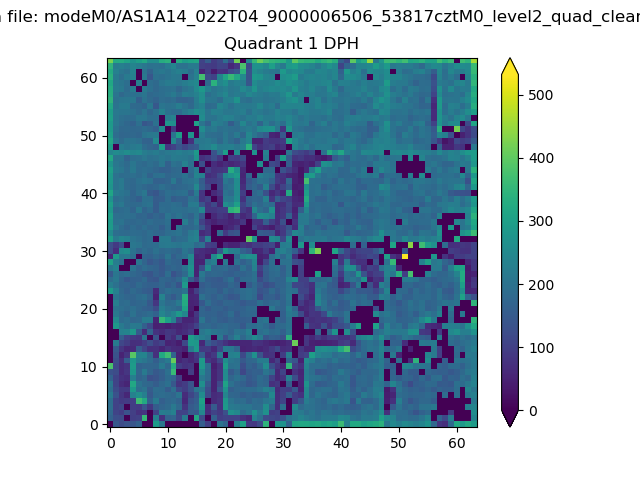 |
Quadrant B |
|---|---|---|---|
| Quadrant D | 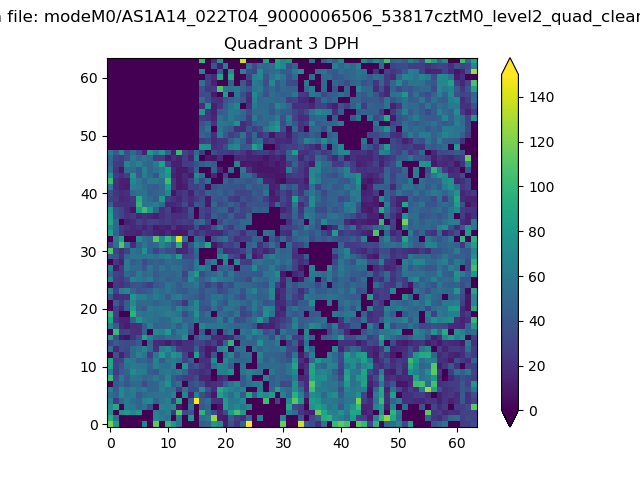 |
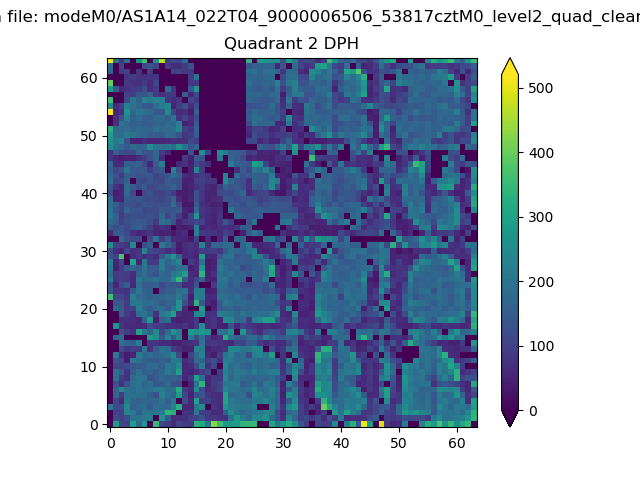 |
Quadrant C |
| Plot type | Count rate plots | Images |
|---|---|---|
| Comparison with Poisson distribution Blue bars denote a histogram of data divided into 1 sec bins. Red curve is a Poisson curve with rate = median count rate of data. |
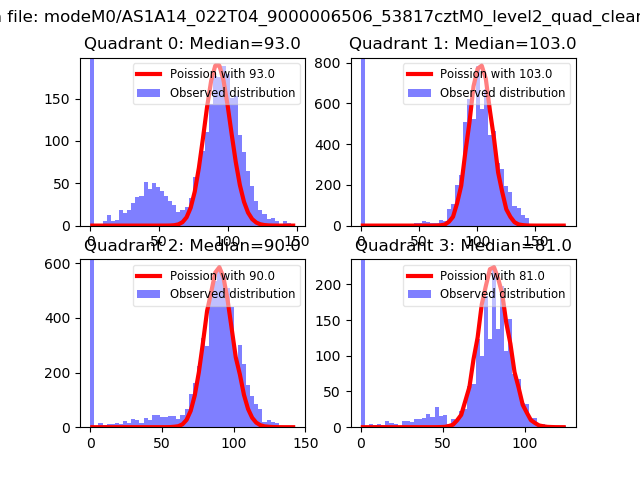 |
 |
| Quadrant-wise count rates Data is divided into 100 sec bins |
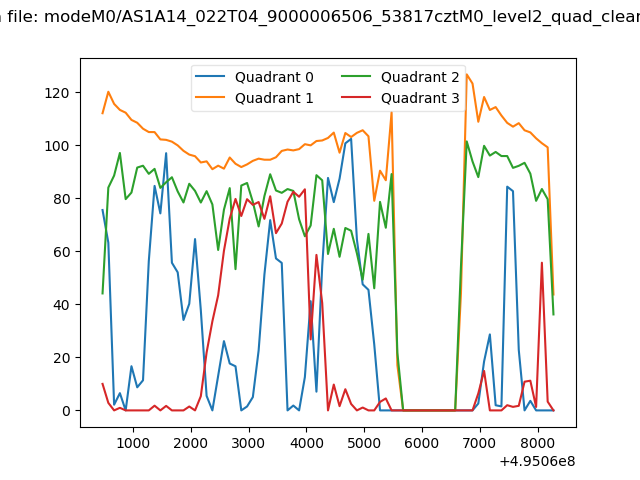 |
|
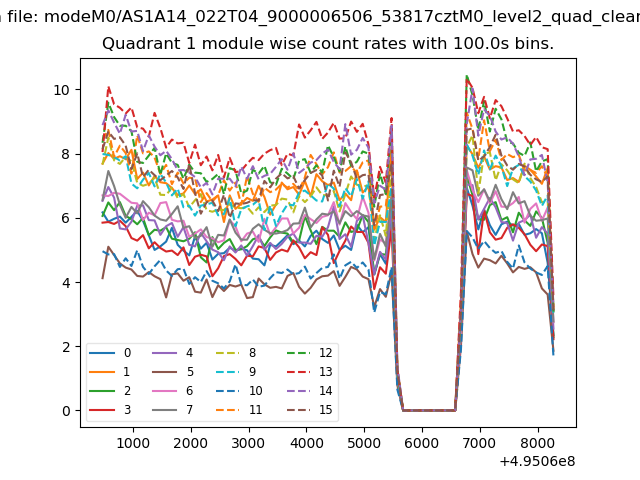
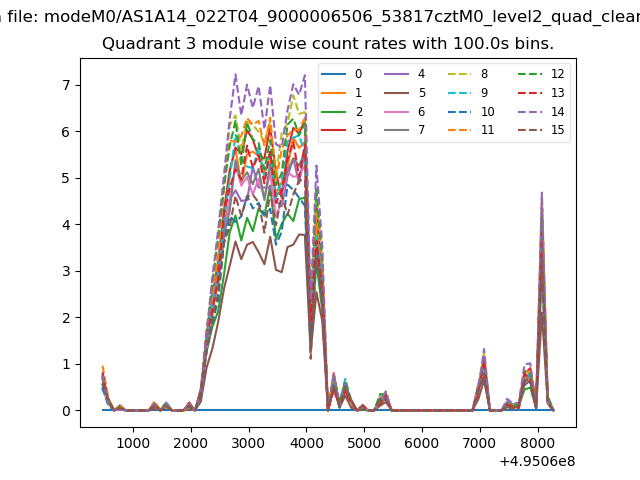
| Module-wise count rates for Quadrant A Data is divided into 100 sec bins |
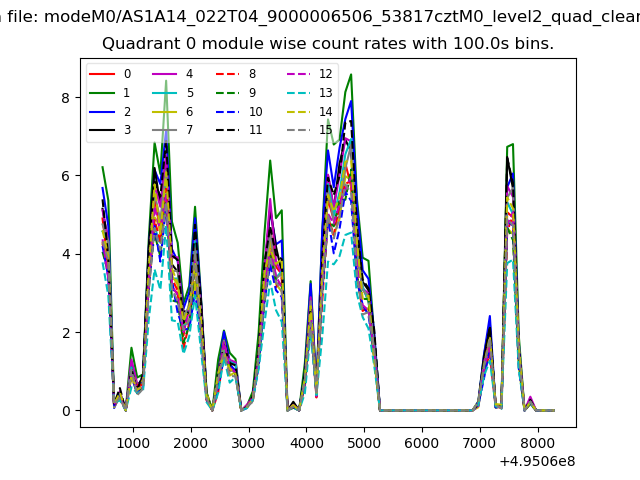 |
 |
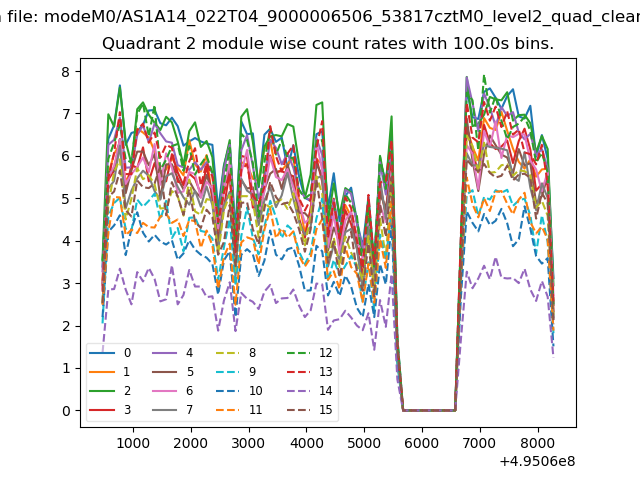
| Module-wise count rates for Quadrant B Data is divided into 100 sec bins |
 |
 |
| Module-wise count rates for Quadrant C Data is divided into 100 sec bins |
 |
 |
| Module-wise count rates for Quadrant D Data is divided into 100 sec bins |
 |
 |
| Parameter | Plot |
|---|---|
| CZT HV Monitor | 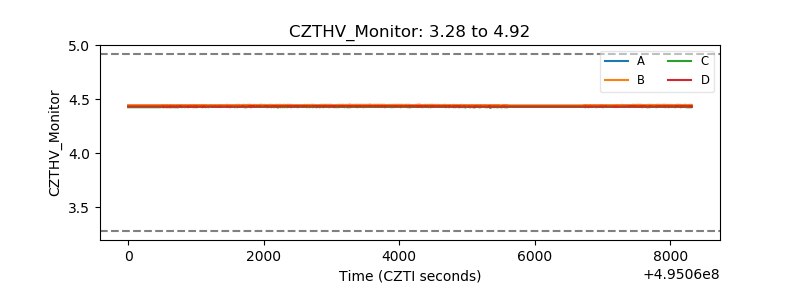 |
| D_VDD | 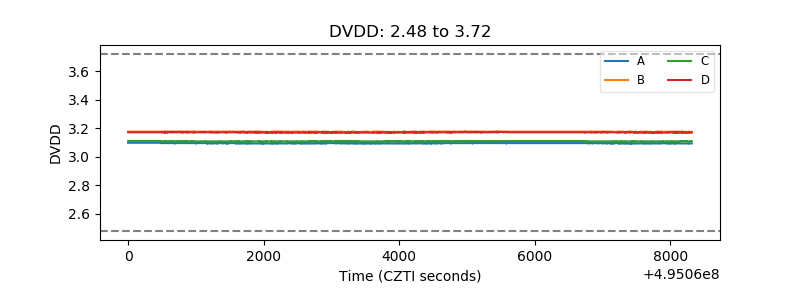 |
| Temperature 1 | 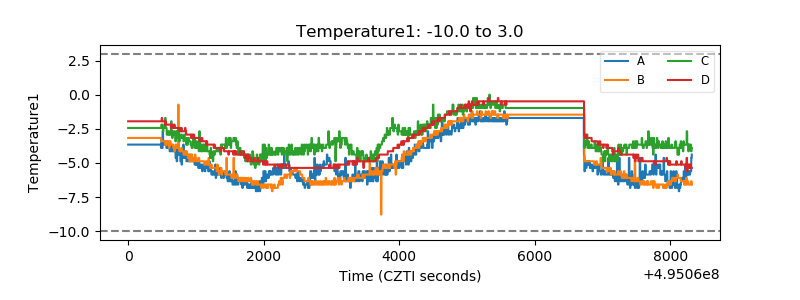 |
| Veto HV Monitor | 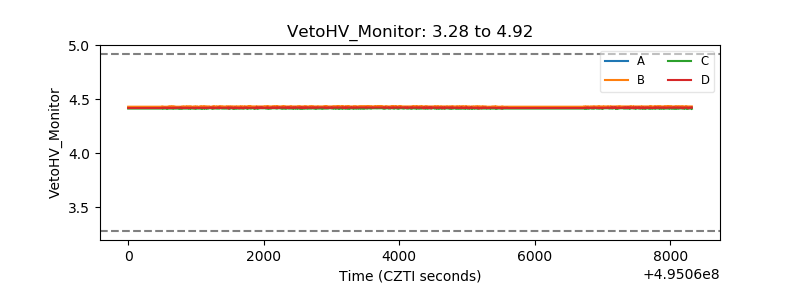 |
| Veto LLD | 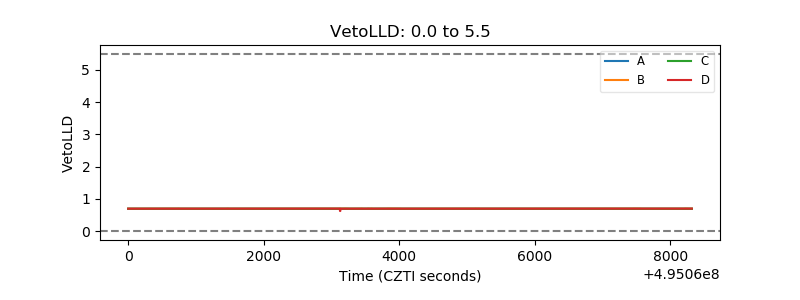 |
| Alpha Counter | 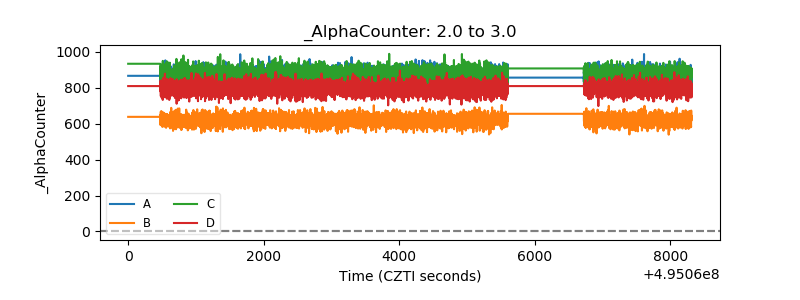 |
| _CPM_Rate | 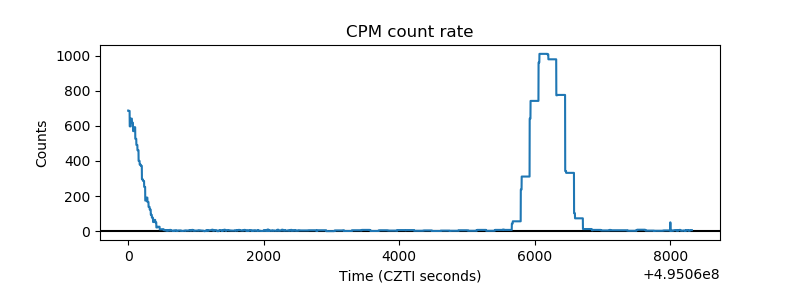 |
| CZT Counter | 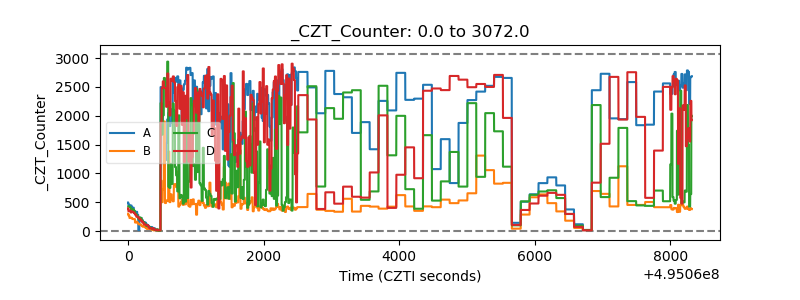 |
| +2.5 Volts monitor | 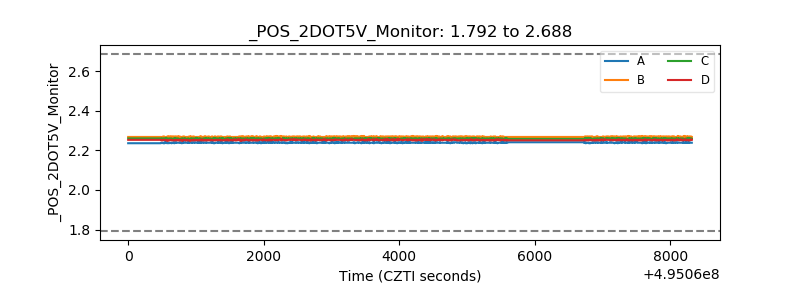 |
| +5 Volts monitor | 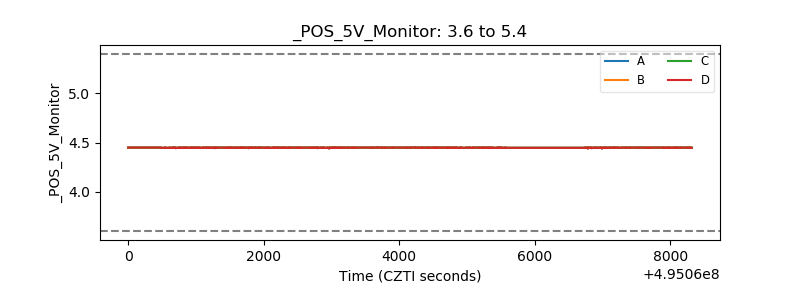 |
| _ROLL_ROT | 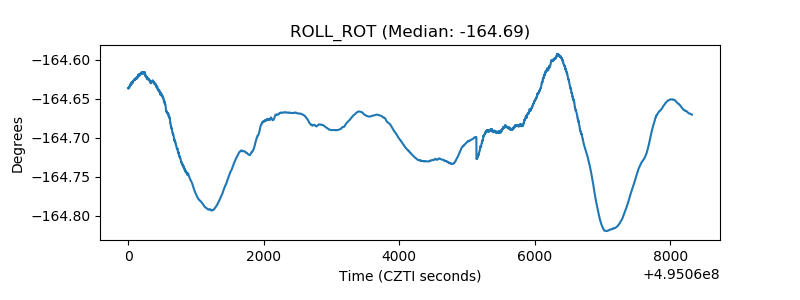 |
| _Roll_DEC | 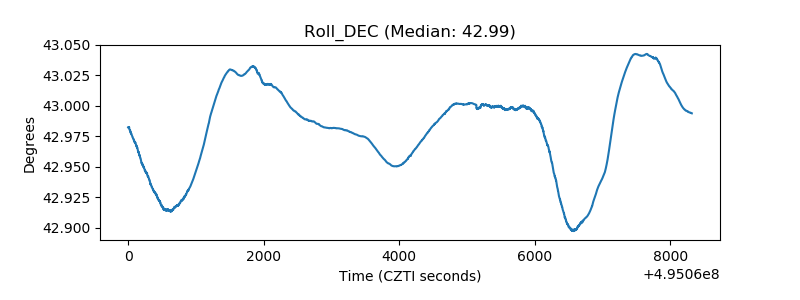 |
| _Roll_RA | 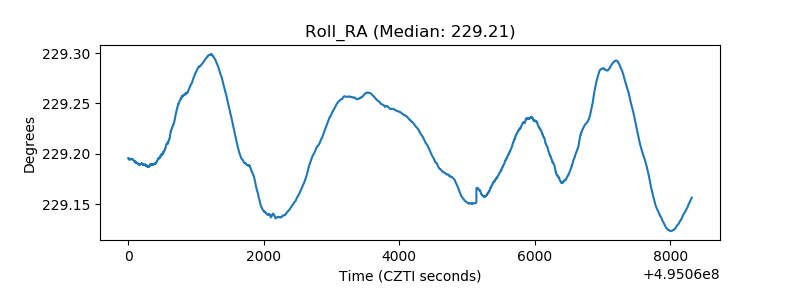 |
| Veto Counter | 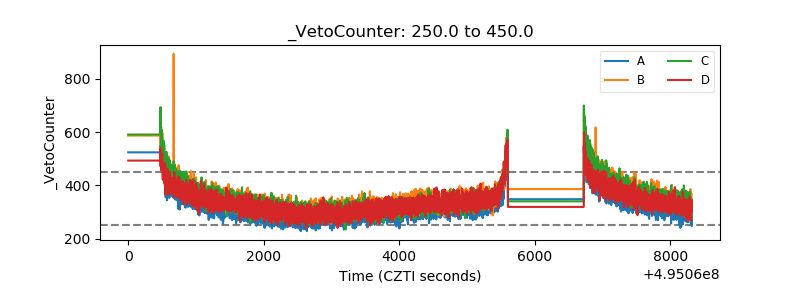 |