| Param | Original file | Final file |
|---|---|---|
| Filename | modeM0/AS1A14_022T04_9000006506_53818cztM0_level2.fits | modeM0/AS1A14_022T04_9000006506_53818cztM0_level2_quad_clean.evt |
| Size (bytes) | 1,044,731,520 | 69,177,600 |
| Size | 996.3 MB | 66.0 MB |
| Events in quadrant A | 14,677,807 | 245,006 |
| Events in quadrant B | 3,309,507 | 707,284 |
| Events in quadrant C | 6,224,570 | 580,244 |
| Events in quadrant D | 13,944,964 | 97,058 |
| Mode M0 | |||
|---|---|---|---|
| Quadrant | BADHDUFLAG | Total packets | Discarded packets |
| A | 0 | 48199 | 2 |
| B | 0 | 14685 | 2 |
| C | 0 | 23094 | 2 |
| D | 0 | 46008 | 2 |
| Mode SS | |||
|---|---|---|---|
| Quadrant | BADHDUFLAG | Total packets | Discarded packets |
| A | 0 | 134 | 0 |
| B | 0 | 134 | 0 |
| C | 0 | 134 | 0 |
| D | 0 | 134 | 0 |
| Mode M9 | |||
|---|---|---|---|
| Quadrant | BADHDUFLAG | Total packets | Discarded packets |
| A | 0 | 12 | 0 |
| B | 0 | 13 | 0 |
| C | 0 | 13 | 0 |
| D | 0 | 13 | 0 |
| Quadrant | Total seconds | Saturated seconds | Saturation percentage |
|---|---|---|---|
| A | 6670 | 4554 | 68.275862% |
| B | 6670 | 94 | 1.409295% |
| C | 6670 | 738 | 11.064468% |
| D | 6670 | 5695 | 85.382309% |
Noise dominated data is calculated using 1-second bins in cleaned event files. If a bin has >2000 counts, and if more than 50% of those come from <1% of pixels, then it is considered to be noise-dominated and hence unusable.
| Quadrant | # 1 sec bins | Bins with >0 counts | Bins with >2000 counts | High rate bins dominated by noise | Noise dominated (total time) | Noise dominated (detector-on time) | Marked lightcurve |
|---|---|---|---|---|---|---|---|
| A | 7835 | 6670 | 4475 | 4475 | 57.12% | 67.09% | 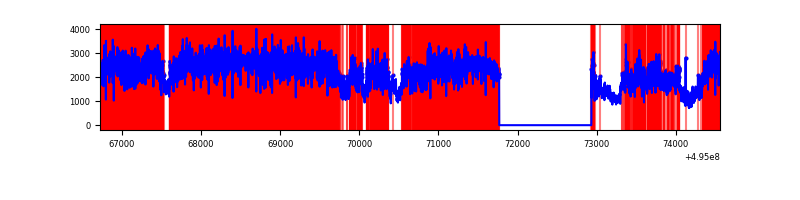 |
| B | 7835 | 6671 | 23 | 23 | 0.29% | 0.34% | 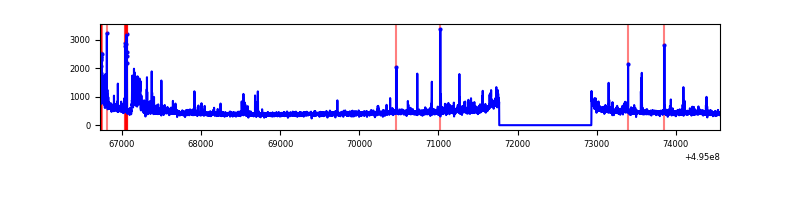 |
| C | 7835 | 6671 | 618 | 618 | 7.89% | 9.26% | 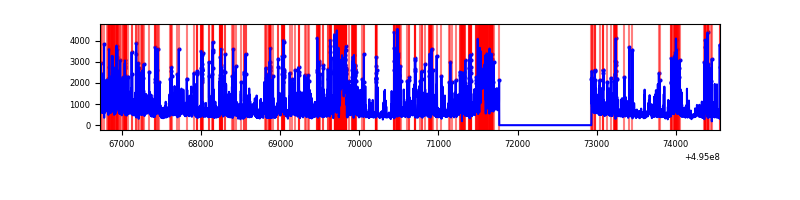 |
| D | 7834 | 6669 | 4146 | 4146 | 52.92% | 62.17% | 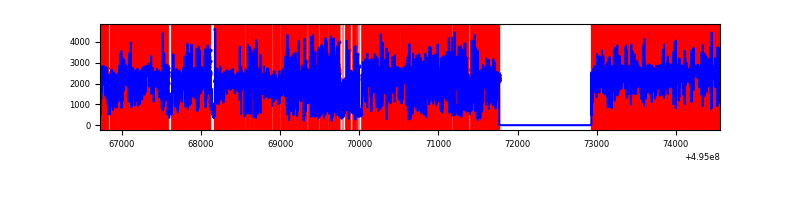 |
Top three noisy pixels from each quadrant. If the there are fewer than three noisy pixels in the level2.evt file, extra rows are filled as -1
| Pixel properties | Quadrant properties | ||||||
|---|---|---|---|---|---|---|---|
| Quadrant | DetID | PixID | Counts | Sigma | Mean | Median | Sigma |
| A | 3 | 63 | 12314500 | 93770.4 | 531 | 520 | 131.3 |
| A | 0 | 8 | 205912 | 1564.05 | 531 | 520 | 131.3 |
| A | 12 | 115 | 22958 | 170.86 | 531 | 520 | 131.3 |
| B | 5 | 172 | 199636 | 1288.98 | 719 | 693 | 154.3 |
| B | 8 | 234 | 73338 | 470.68 | 719 | 693 | 154.3 |
| B | 0 | 213 | 43232 | 275.62 | 719 | 693 | 154.3 |
| C | 15 | 224 | 2840342 | 15323.51 | 675 | 668 | 185.3 |
| C | 1 | 241 | 134964 | 724.69 | 675 | 668 | 185.3 |
| C | 12 | 2 | 96774 | 518.61 | 675 | 668 | 185.3 |
| D | 8 | 176 | 8551011 | 115003.3 | 251 | 239 | 74.4 |
| D | 2 | 172 | 3886015 | 52261.6 | 251 | 239 | 74.4 |
| D | 2 | 153 | 176827 | 2375.01 | 251 | 239 | 74.4 |
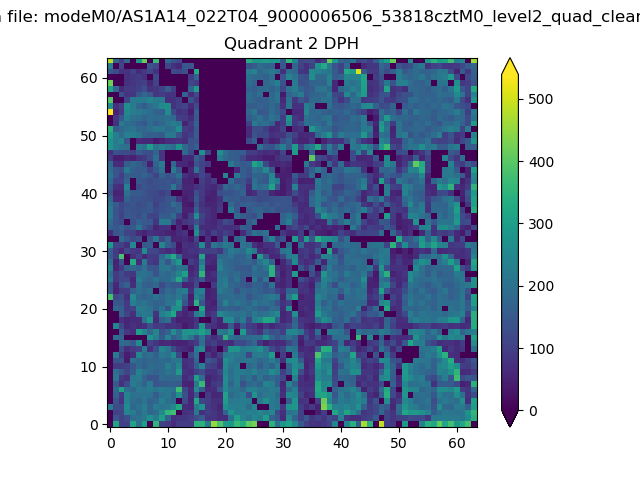
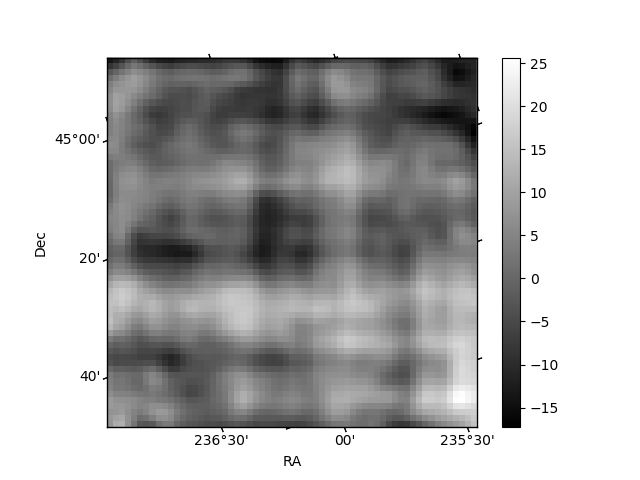
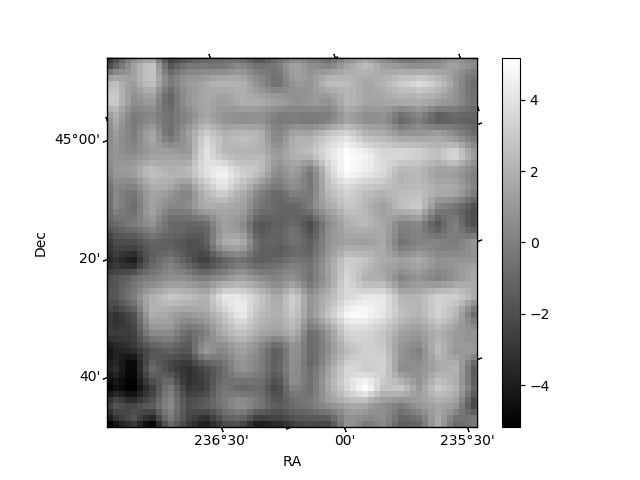
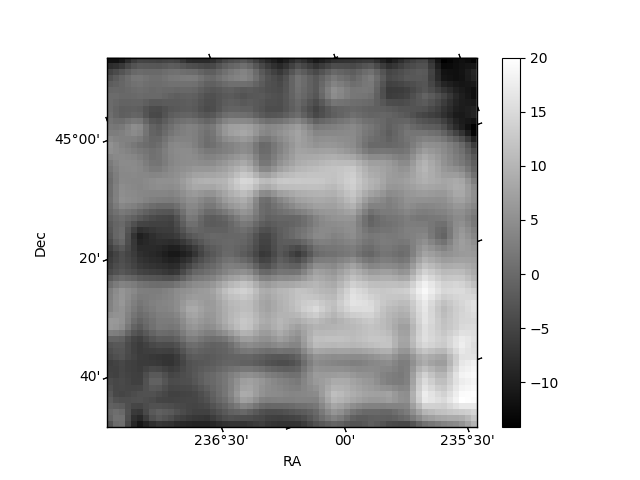
Histogram calculated using DETX and DETY for each event in the final _common_clean file
| Quadrant A | 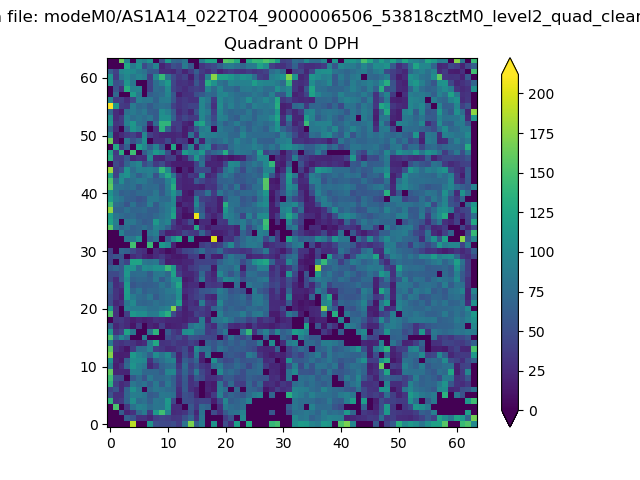 |
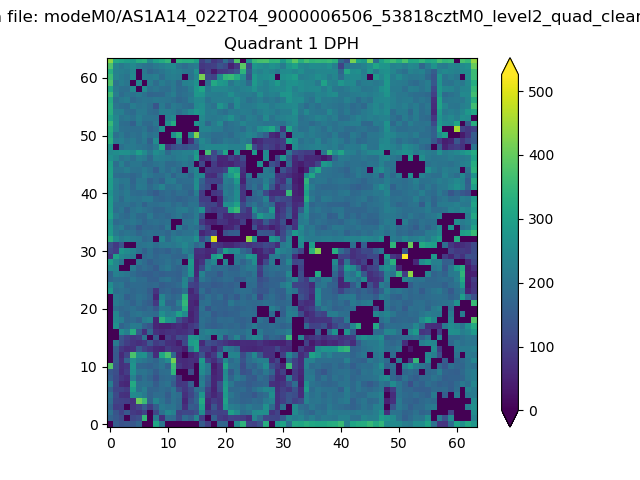 |
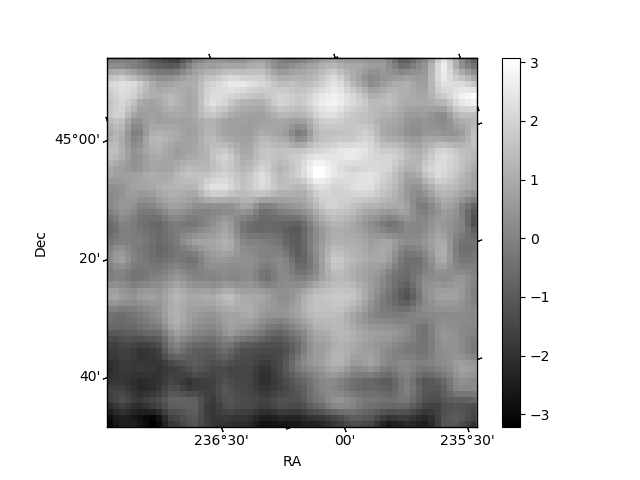
Quadrant B |
|---|---|---|---|
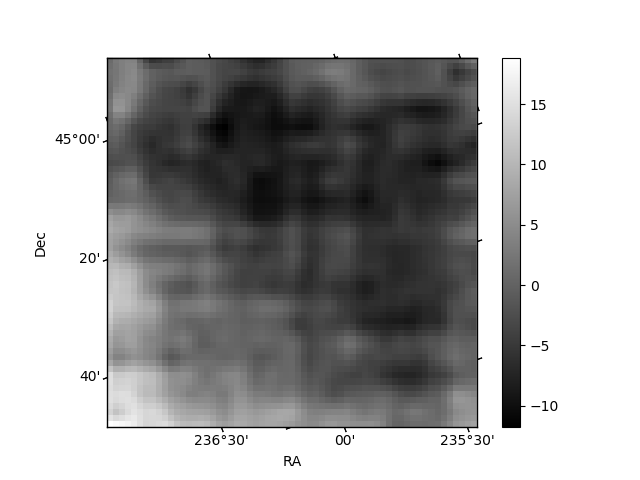
| Quadrant D | 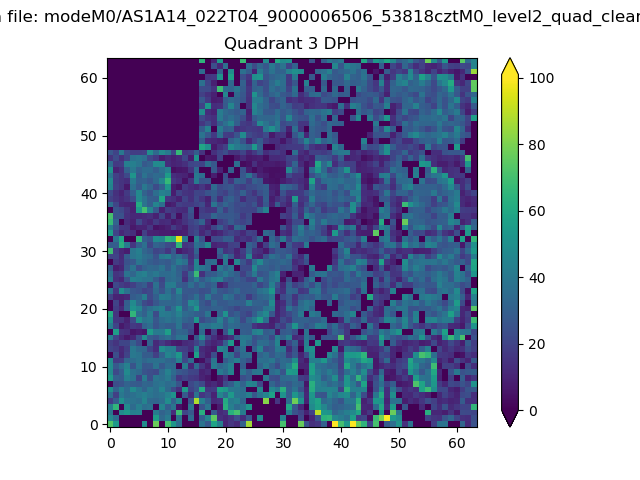 |
 |
Quadrant C |
| Plot type | Count rate plots | Images |
|---|---|---|
| Comparison with Poisson distribution Blue bars denote a histogram of data divided into 1 sec bins. Red curve is a Poisson curve with rate = median count rate of data. |
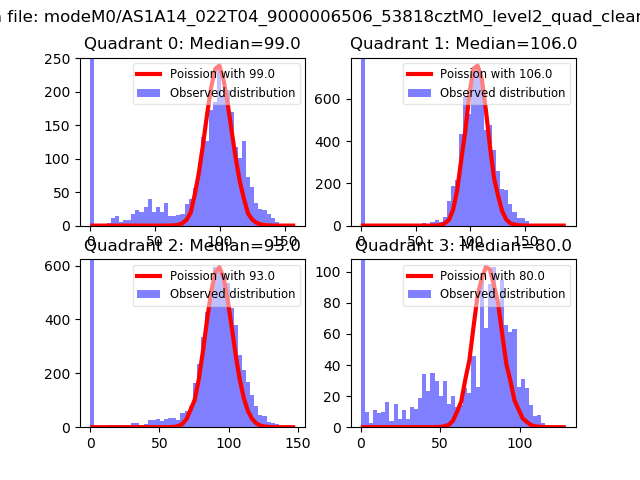 |
 |
| Quadrant-wise count rates Data is divided into 100 sec bins |
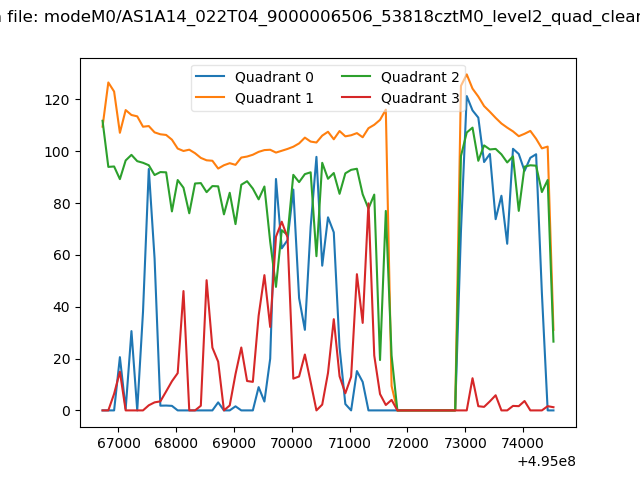 |
|
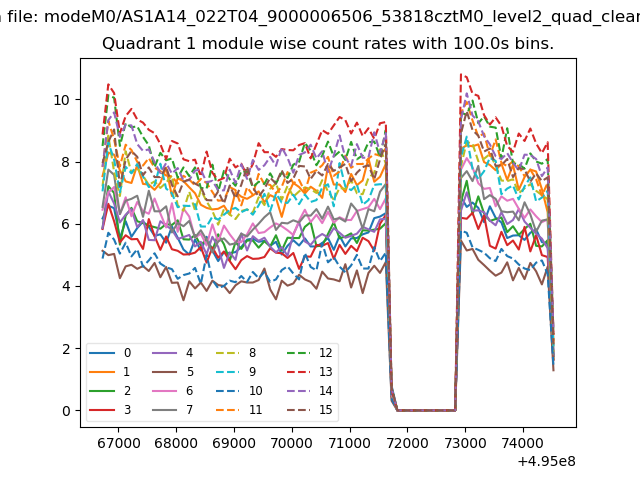
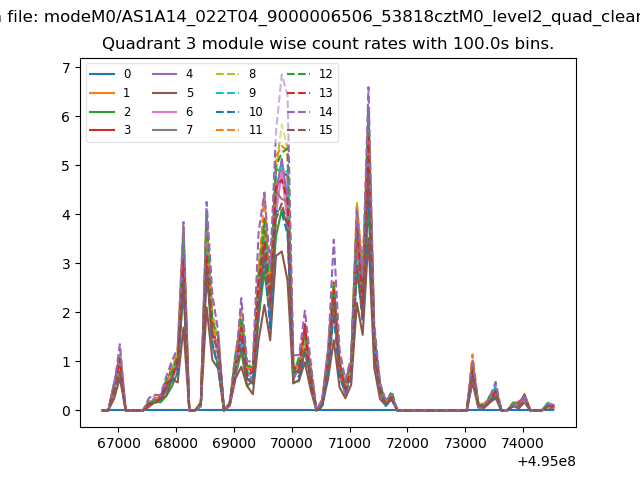
| Module-wise count rates for Quadrant A Data is divided into 100 sec bins |
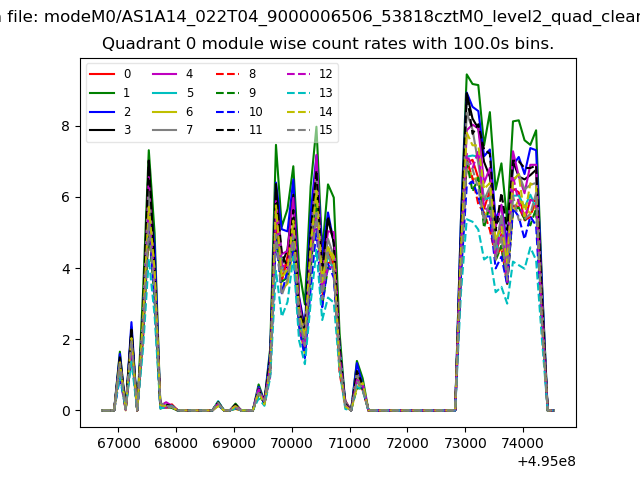 |
 |
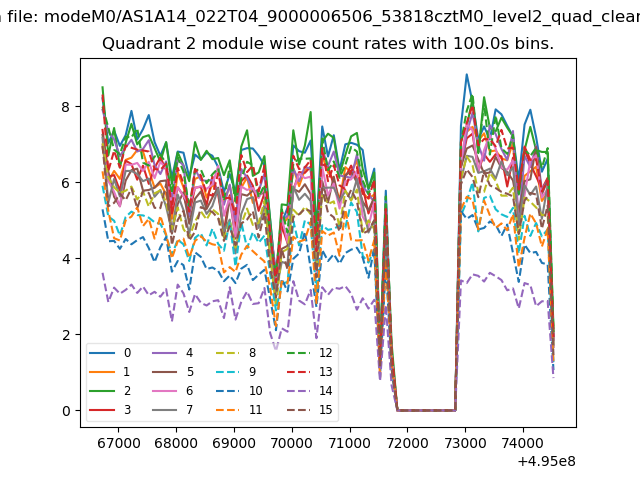
| Module-wise count rates for Quadrant B Data is divided into 100 sec bins |
 |
 |
| Module-wise count rates for Quadrant C Data is divided into 100 sec bins |
 |
 |
| Module-wise count rates for Quadrant D Data is divided into 100 sec bins |
 |
 |
| Parameter | Plot |
|---|---|
| CZT HV Monitor | 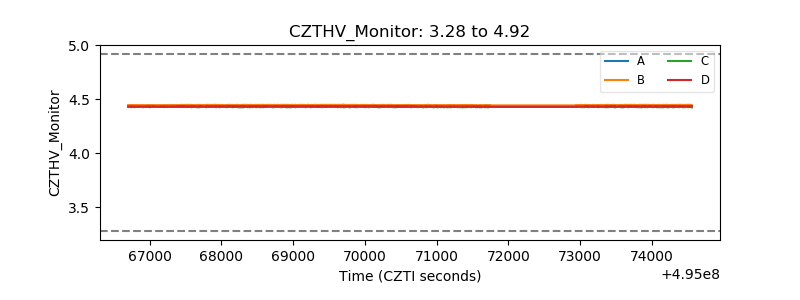 |
| D_VDD | 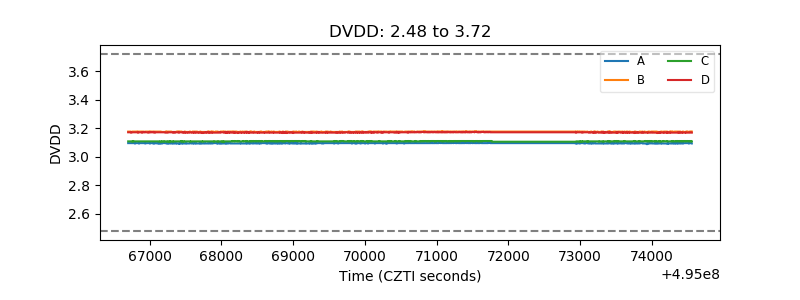 |
| Temperature 1 | 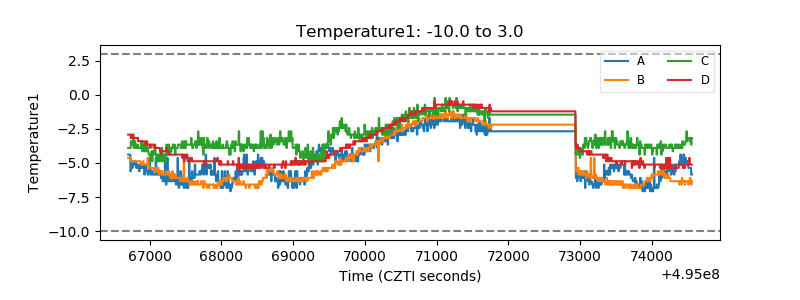 |
| Veto HV Monitor | 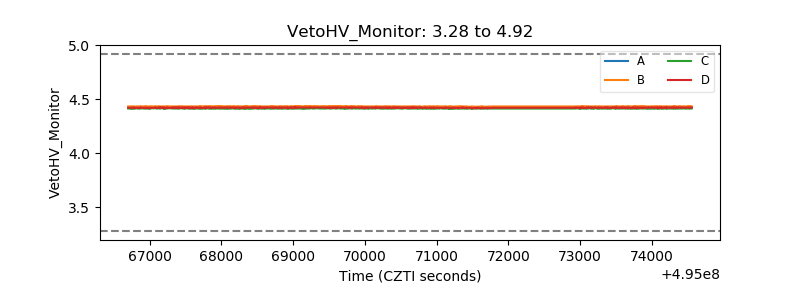 |
| Veto LLD | 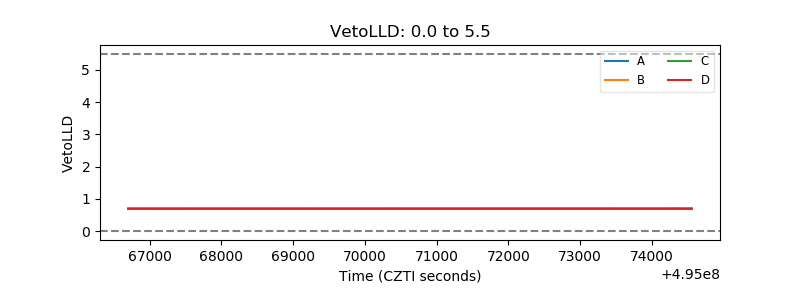 |
| Alpha Counter | 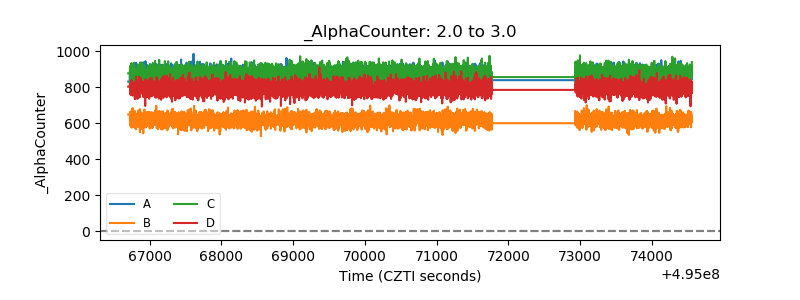 |
| _CPM_Rate | 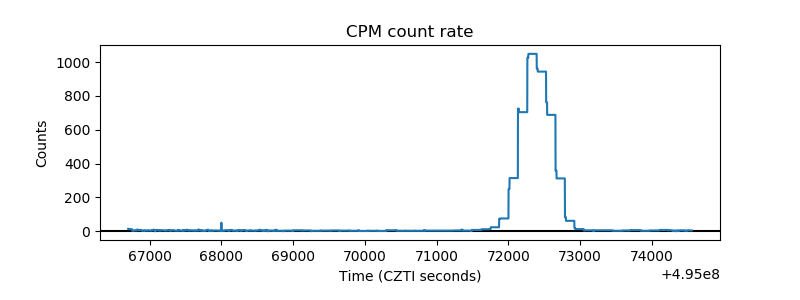 |
| CZT Counter | 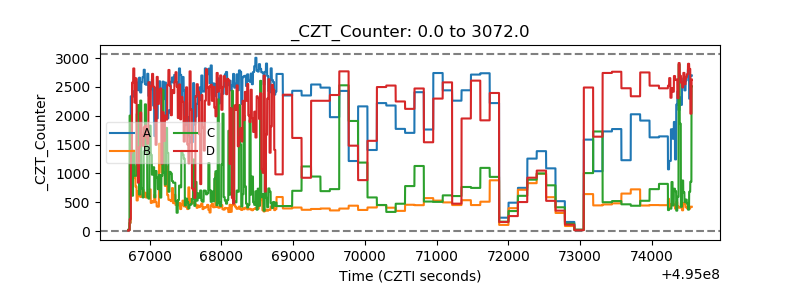 |
| +2.5 Volts monitor | 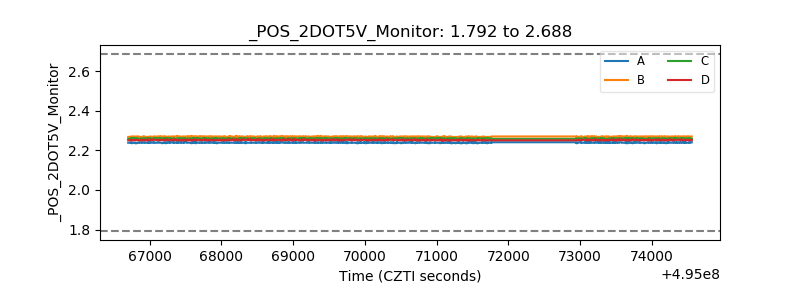 |
| +5 Volts monitor | 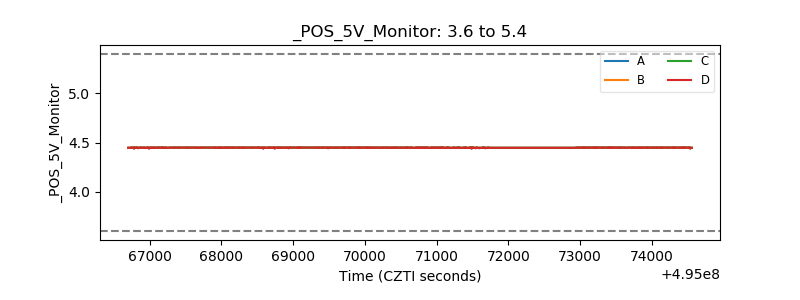 |
| _ROLL_ROT | 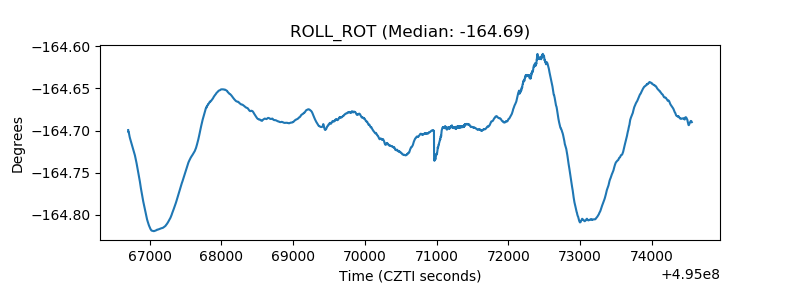 |
| _Roll_DEC | 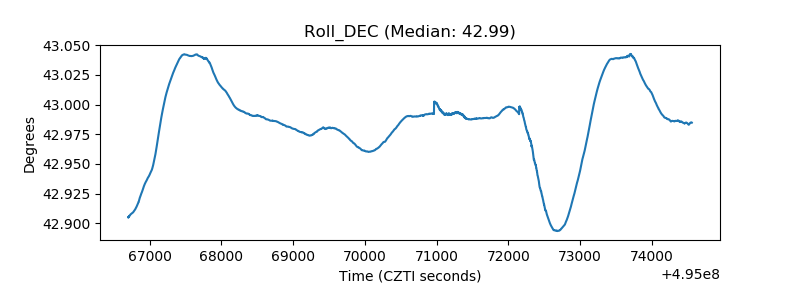 |
| _Roll_RA | 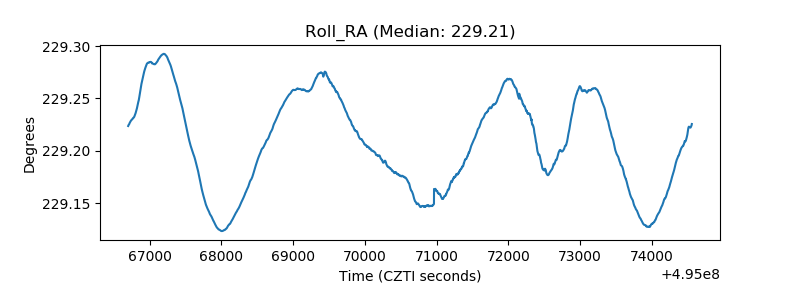 |
| Veto Counter | 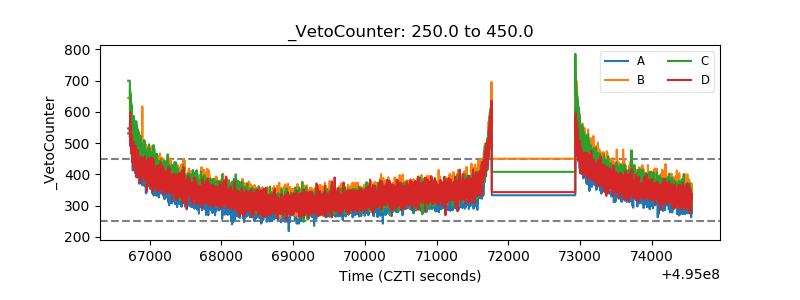 |