| Param | Original file | Final file |
|---|---|---|
| Filename | modeM0/AS1A14_022T04_9000006506_53819cztM0_level2.fits | modeM0/AS1A14_022T04_9000006506_53819cztM0_level2_quad_clean.evt |
| Size (bytes) | 978,125,760 | 64,719,360 |
| Size | 932.8 MB | 61.7 MB |
| Events in quadrant A | 14,324,365 | 159,005 |
| Events in quadrant B | 2,927,941 | 659,399 |
| Events in quadrant C | 5,108,897 | 557,568 |
| Events in quadrant D | 13,368,234 | 152,146 |
| Mode M0 | |||
|---|---|---|---|
| Quadrant | BADHDUFLAG | Total packets | Discarded packets |
| A | 0 | 46817 | 1 |
| B | 0 | 12940 | 1 |
| C | 0 | 19457 | 1 |
| D | 0 | 43940 | 1 |
| Mode SS | |||
|---|---|---|---|
| Quadrant | BADHDUFLAG | Total packets | Discarded packets |
| A | 0 | 126 | 0 |
| B | 0 | 126 | 0 |
| C | 0 | 126 | 0 |
| D | 0 | 126 | 0 |
| Mode M9 | |||
|---|---|---|---|
| Quadrant | BADHDUFLAG | Total packets | Discarded packets |
| A | 0 | 12 | 0 |
| B | 0 | 12 | 0 |
| C | 0 | 12 | 0 |
| D | 0 | 12 | 0 |
| Quadrant | Total seconds | Saturated seconds | Saturation percentage |
|---|---|---|---|
| A | 6176 | 4864 | 78.756477% |
| B | 6177 | 31 | 0.501862% |
| C | 6177 | 453 | 7.333657% |
| D | 6176 | 4724 | 76.489637% |
Noise dominated data is calculated using 1-second bins in cleaned event files. If a bin has >2000 counts, and if more than 50% of those come from <1% of pixels, then it is considered to be noise-dominated and hence unusable.
| Quadrant | # 1 sec bins | Bins with >0 counts | Bins with >2000 counts | High rate bins dominated by noise | Noise dominated (total time) | Noise dominated (detector-on time) | Marked lightcurve |
|---|---|---|---|---|---|---|---|
| A | 7396 | 6176 | 4771 | 4771 | 64.51% | 77.25% | 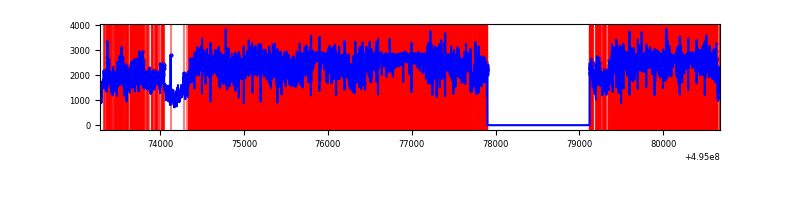 |
| B | 7397 | 6178 | 3 | 3 | 0.04% | 0.05% | 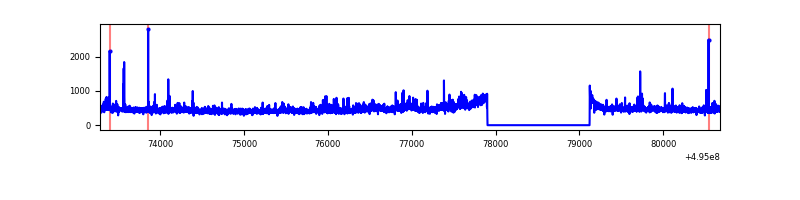 |
| C | 7397 | 6178 | 351 | 351 | 4.75% | 5.68% | 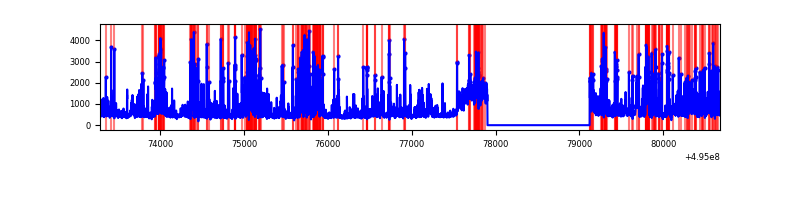 |
| D | 7396 | 6177 | 4060 | 4060 | 54.89% | 65.73% | 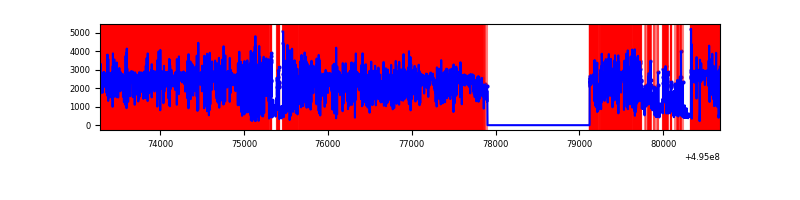 |
Top three noisy pixels from each quadrant. If the there are fewer than three noisy pixels in the level2.evt file, extra rows are filled as -1
| Pixel properties | Quadrant properties | ||||||
|---|---|---|---|---|---|---|---|
| Quadrant | DetID | PixID | Counts | Sigma | Mean | Median | Sigma |
| A | 3 | 63 | 12427805 | 110755.75 | 446 | 435 | 112.2 |
| A | 4 | 249 | 34666 | 305.08 | 446 | 435 | 112.2 |
| A | 8 | 249 | 29940 | 262.96 | 446 | 435 | 112.2 |
| B | 4 | 81 | 95992 | 675.17 | 664 | 640 | 141.2 |
| B | 7 | 0 | 65153 | 456.8 | 664 | 640 | 141.2 |
| B | 8 | 234 | 35183 | 244.59 | 664 | 640 | 141.2 |
| C | 15 | 224 | 1646305 | 9473.98 | 632 | 626 | 173.7 |
| C | 15 | 158 | 379886 | 2183.36 | 632 | 626 | 173.7 |
| C | 5 | 10 | 291120 | 1672.34 | 632 | 626 | 173.7 |
| D | 8 | 176 | 8057404 | 82738.81 | 334 | 319 | 97.4 |
| D | 2 | 172 | 3115267 | 31987.64 | 334 | 319 | 97.4 |
| D | 10 | 172 | 598759 | 6145.43 | 334 | 319 | 97.4 |
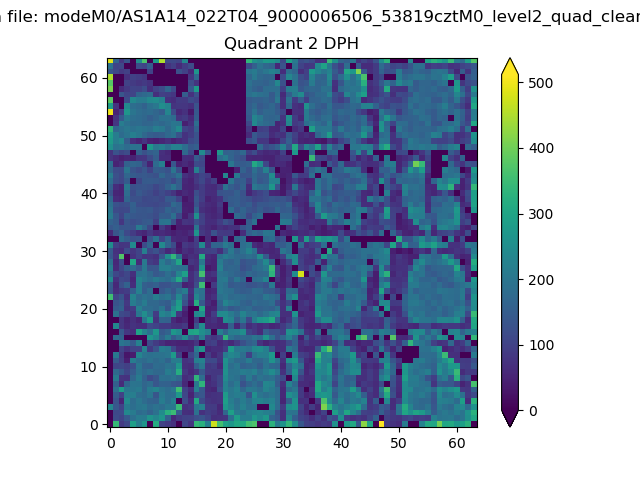
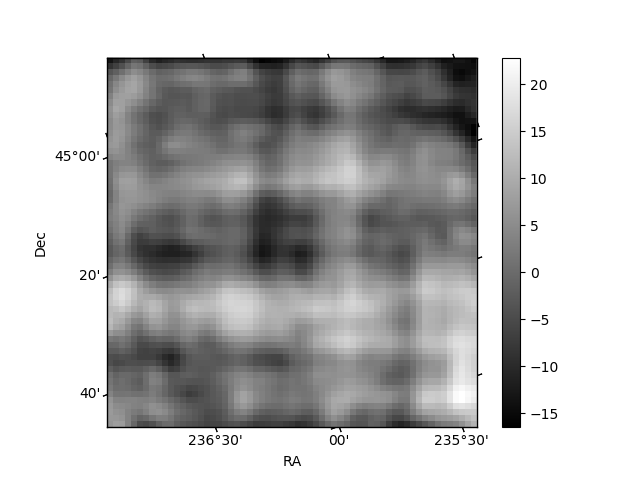
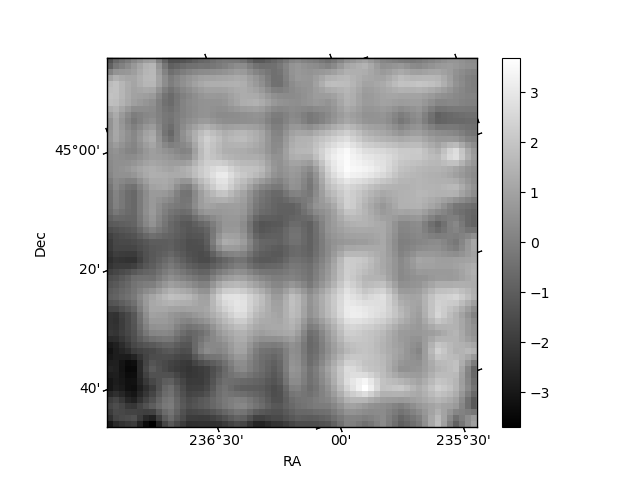
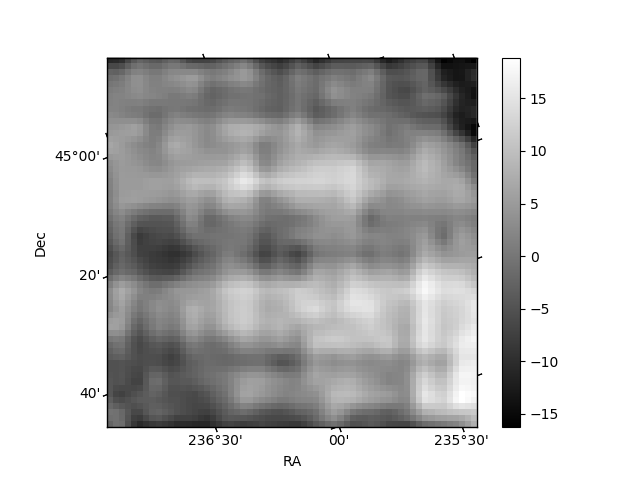
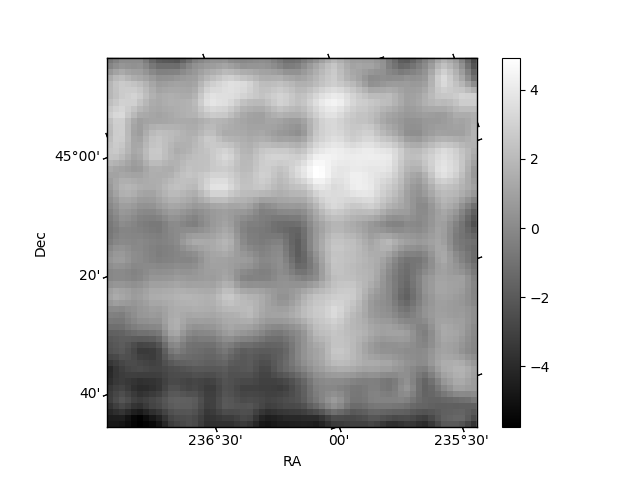
Histogram calculated using DETX and DETY for each event in the final _common_clean file
| Quadrant A | 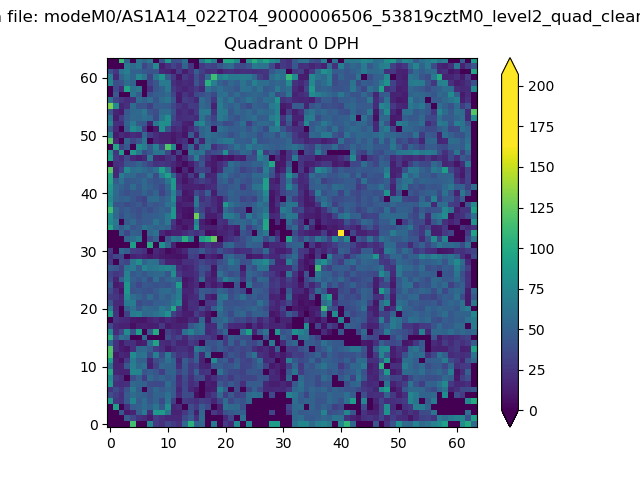 |
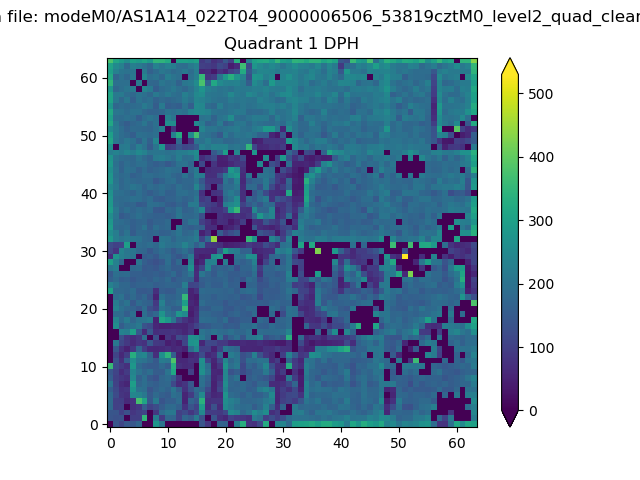 |
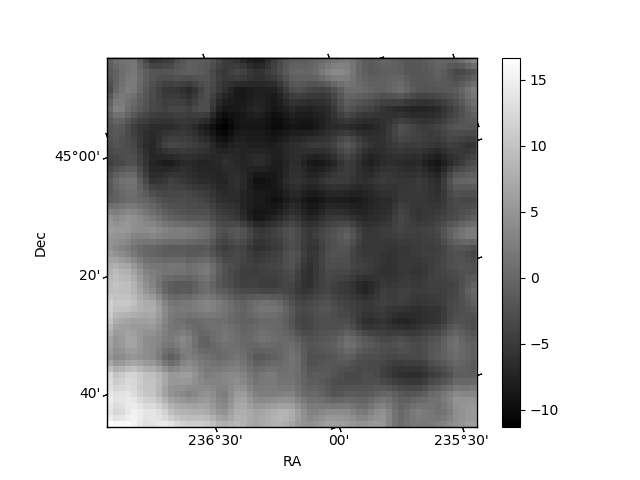
Quadrant B |
|---|---|---|---|
| Quadrant D | 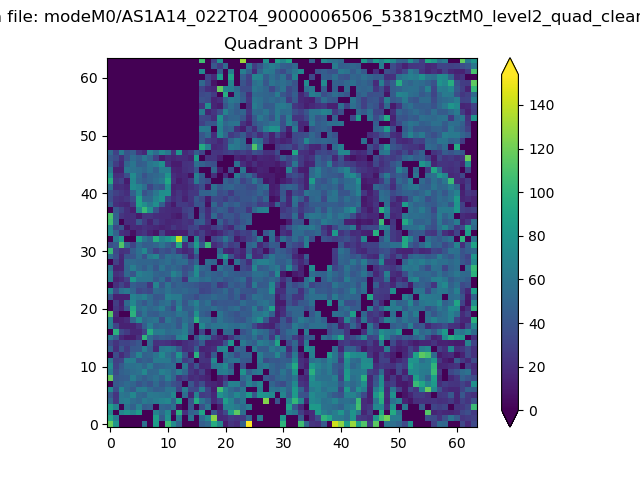 |
 |
Quadrant C |
| Plot type | Count rate plots | Images |
|---|---|---|
| Comparison with Poisson distribution Blue bars denote a histogram of data divided into 1 sec bins. Red curve is a Poisson curve with rate = median count rate of data. |
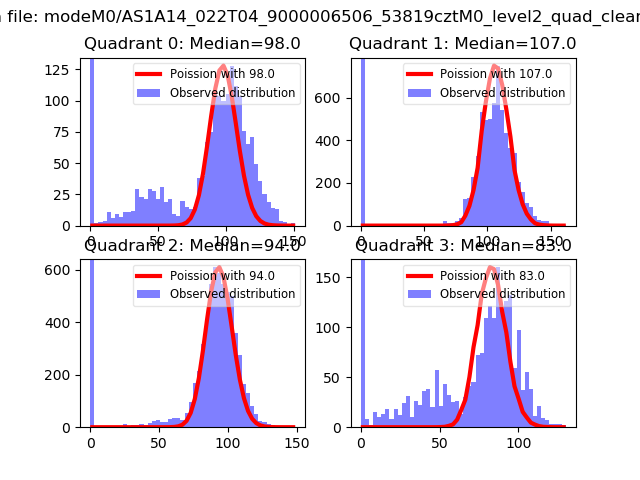 |
 |
| Quadrant-wise count rates Data is divided into 100 sec bins |
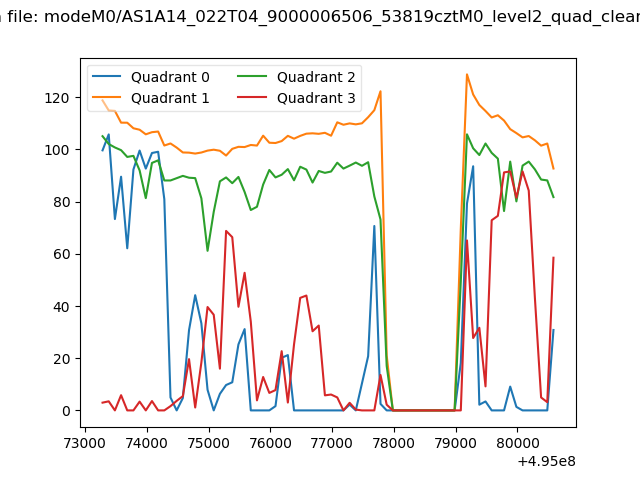 |
|
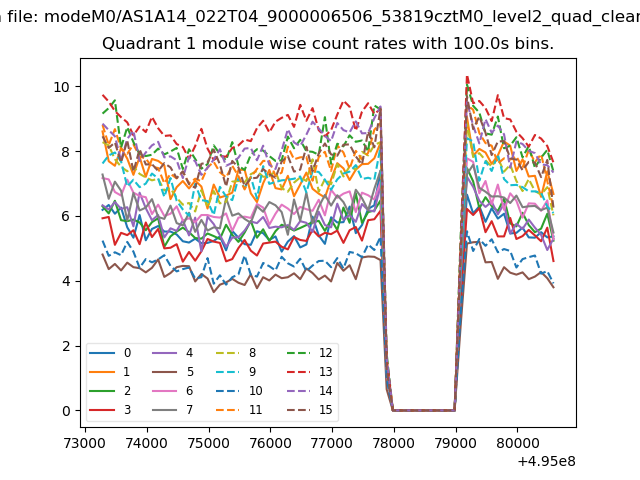
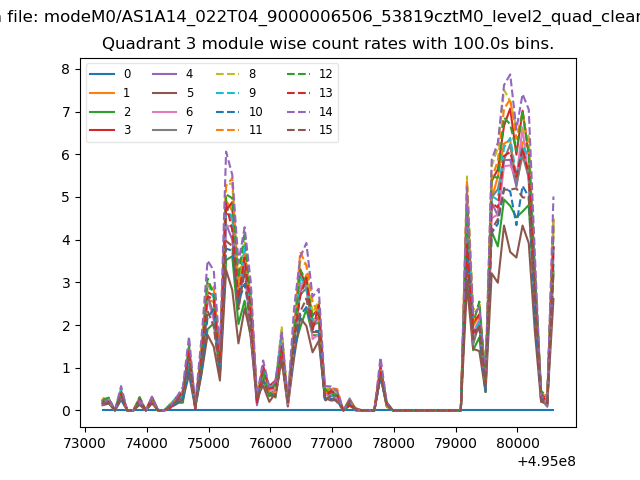
| Module-wise count rates for Quadrant A Data is divided into 100 sec bins |
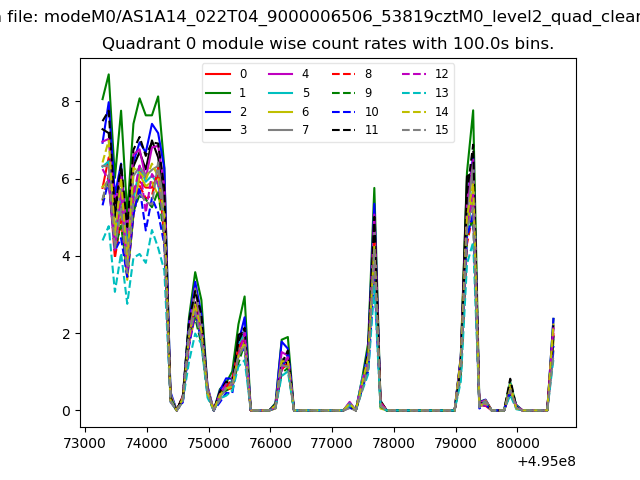 |
 |
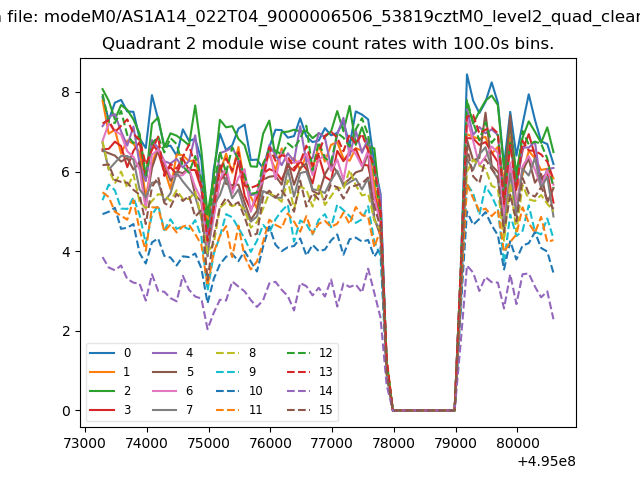
| Module-wise count rates for Quadrant B Data is divided into 100 sec bins |
 |
 |
| Module-wise count rates for Quadrant C Data is divided into 100 sec bins |
 |
 |
| Module-wise count rates for Quadrant D Data is divided into 100 sec bins |
 |
 |
| Parameter | Plot |
|---|---|
| CZT HV Monitor | 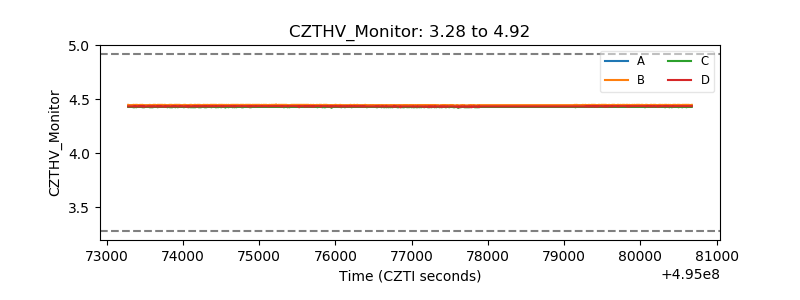 |
| D_VDD | 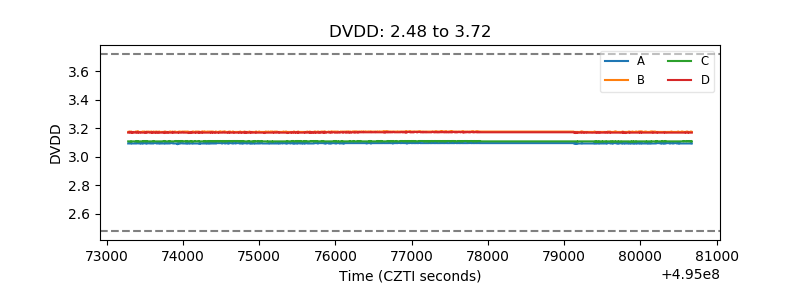 |
| Temperature 1 | 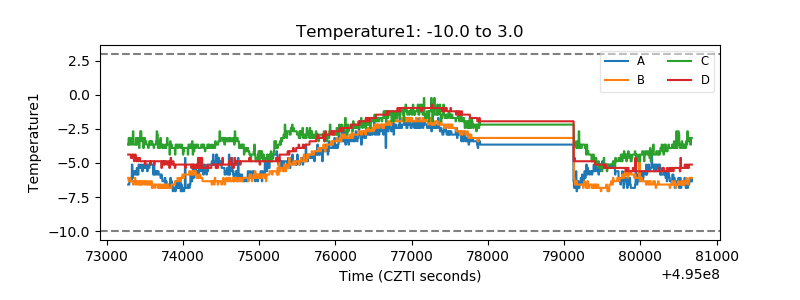 |
| Veto HV Monitor | 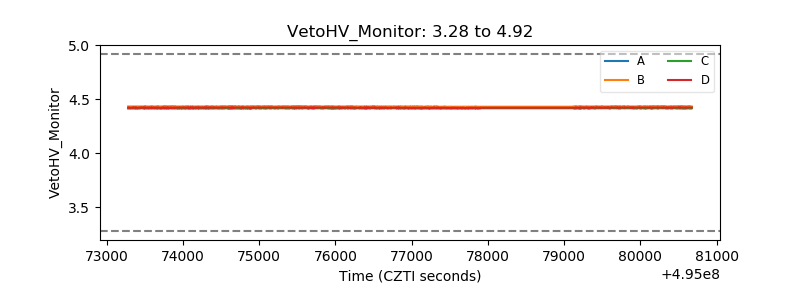 |
| Veto LLD | 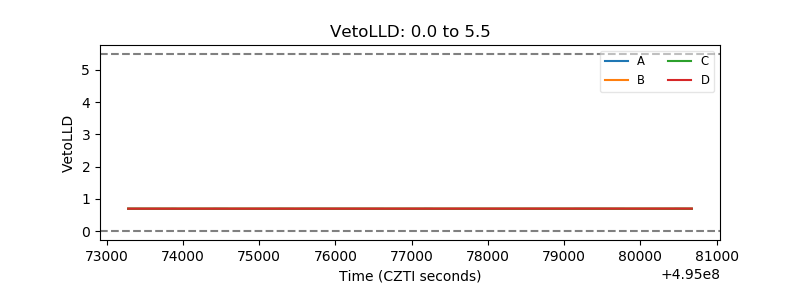 |
| Alpha Counter | 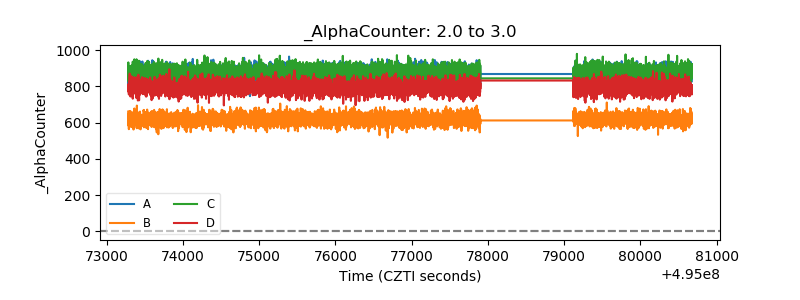 |
| _CPM_Rate | 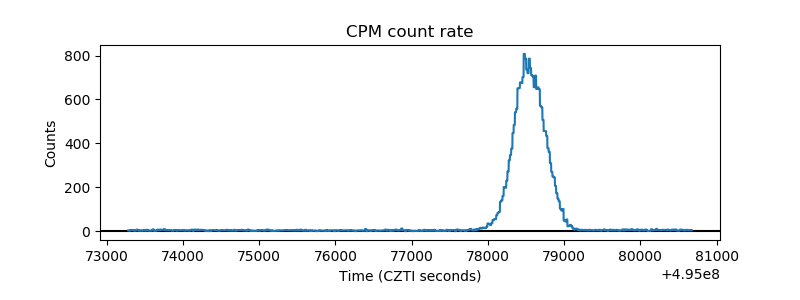 |
| CZT Counter | 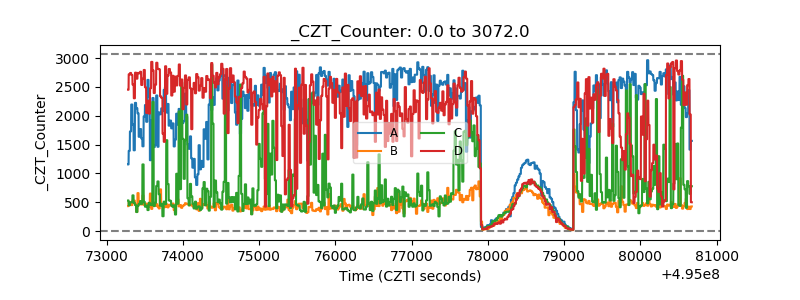 |
| +2.5 Volts monitor | 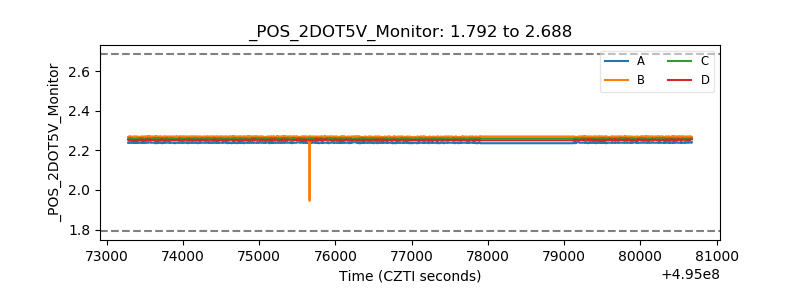 |
| +5 Volts monitor | 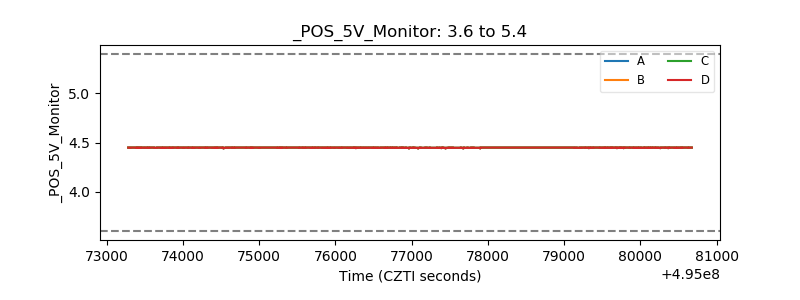 |
| _ROLL_ROT | 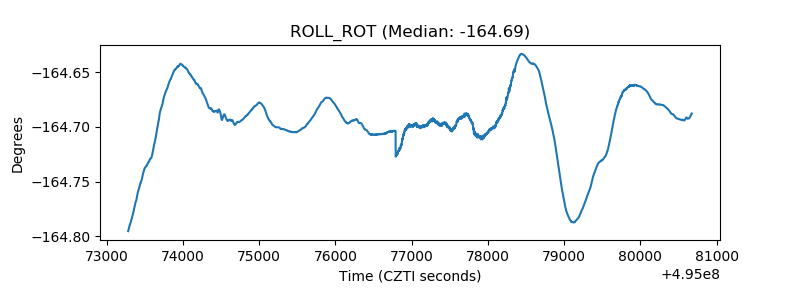 |
| _Roll_DEC | 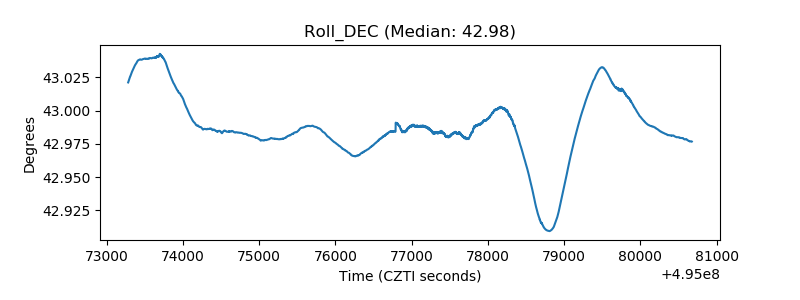 |
| _Roll_RA | 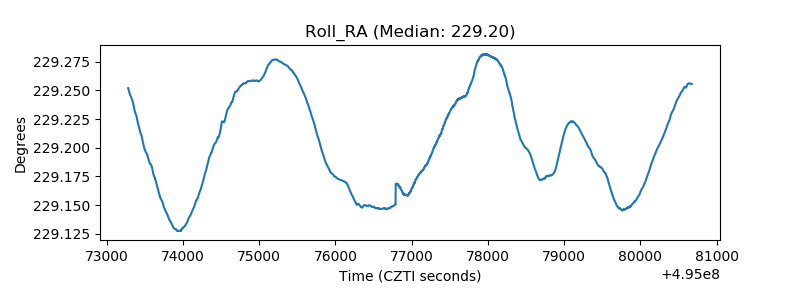 |
| Veto Counter | 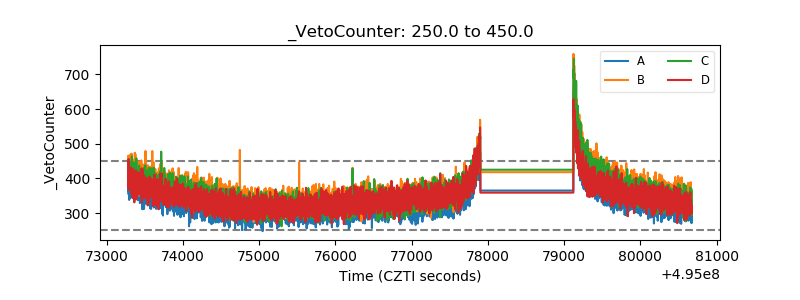 |