| Param | Original file | Final file |
|---|---|---|
| Filename | modeM0/AS1A14_022T04_9000006506_53820cztM0_level2.fits | modeM0/AS1A14_022T04_9000006506_53820cztM0_level2_quad_clean.evt |
| Size (bytes) | 978,094,080 | 66,839,040 |
| Size | 932.8 MB | 63.7 MB |
| Events in quadrant A | 14,380,304 | 163,479 |
| Events in quadrant B | 3,304,916 | 642,373 |
| Events in quadrant C | 5,517,613 | 540,788 |
| Events in quadrant D | 12,518,015 | 239,070 |
| Mode M0 | |||
|---|---|---|---|
| Quadrant | BADHDUFLAG | Total packets | Discarded packets |
| A | 0 | 47042 | 4 |
| B | 0 | 14008 | 1 |
| C | 0 | 20799 | 1 |
| D | 0 | 41528 | 6 |
| Mode SS | |||
|---|---|---|---|
| Quadrant | BADHDUFLAG | Total packets | Discarded packets |
| A | 0 | 126 | 0 |
| B | 0 | 126 | 0 |
| C | 0 | 126 | 0 |
| D | 0 | 126 | 0 |
| Mode M9 | |||
|---|---|---|---|
| Quadrant | BADHDUFLAG | Total packets | Discarded packets |
| A | 0 | 11 | 0 |
| B | 0 | 11 | 0 |
| C | 0 | 11 | 0 |
| D | 0 | 11 | 0 |
| Quadrant | Total seconds | Saturated seconds | Saturation percentage |
|---|---|---|---|
| A | 6276 | 4871 | 77.613129% |
| B | 6279 | 195 | 3.105590% |
| C | 6279 | 639 | 10.176780% |
| D | 6278 | 3746 | 59.668684% |
Noise dominated data is calculated using 1-second bins in cleaned event files. If a bin has >2000 counts, and if more than 50% of those come from <1% of pixels, then it is considered to be noise-dominated and hence unusable.
| Quadrant | # 1 sec bins | Bins with >0 counts | Bins with >2000 counts | High rate bins dominated by noise | Noise dominated (total time) | Noise dominated (detector-on time) | Marked lightcurve |
|---|---|---|---|---|---|---|---|
| A | 7361 | 6276 | 4727 | 4727 | 64.22% | 75.32% | 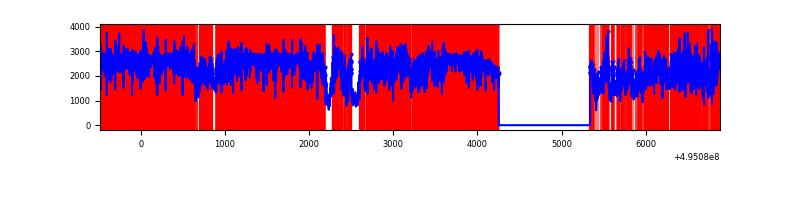 |
| B | 7364 | 6280 | 56 | 56 | 0.76% | 0.89% | 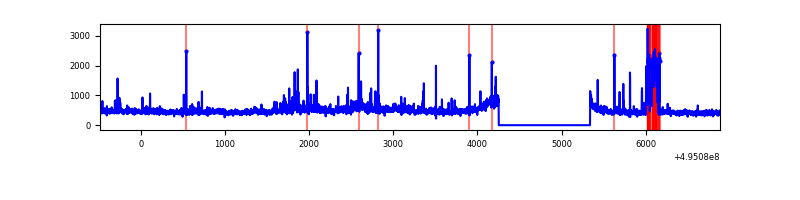 |
| C | 7364 | 6280 | 535 | 535 | 7.27% | 8.52% | 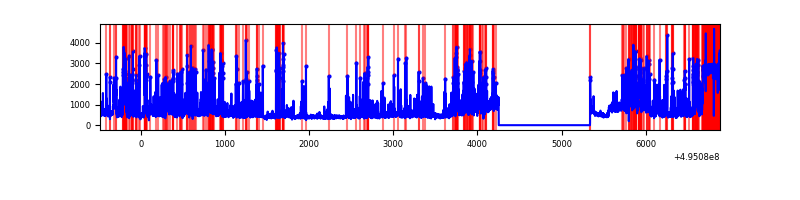 |
| D | 7362 | 6277 | 3527 | 3527 | 47.91% | 56.19% | 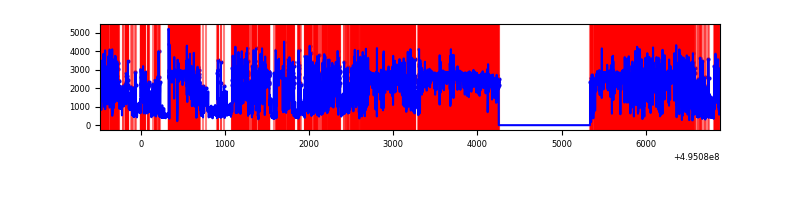 |
Top three noisy pixels from each quadrant. If the there are fewer than three noisy pixels in the level2.evt file, extra rows are filled as -1
| Pixel properties | Quadrant properties | ||||||
|---|---|---|---|---|---|---|---|
| Quadrant | DetID | PixID | Counts | Sigma | Mean | Median | Sigma |
| A | 3 | 63 | 12347165 | 110112.79 | 454 | 444 | 112.1 |
| A | 4 | 13 | 101276 | 899.26 | 454 | 444 | 112.1 |
| A | 0 | 8 | 59874 | 530.02 | 454 | 444 | 112.1 |
| B | 5 | 172 | 212677 | 1474.15 | 674 | 651 | 143.8 |
| B | 7 | 0 | 202290 | 1401.93 | 674 | 651 | 143.8 |
| B | 0 | 197 | 72934 | 502.56 | 674 | 651 | 143.8 |
| C | 15 | 224 | 1387737 | 7913.21 | 635 | 629 | 175.3 |
| C | 1 | 241 | 716289 | 4082.71 | 635 | 629 | 175.3 |
| C | 5 | 10 | 265916 | 1513.42 | 635 | 629 | 175.3 |
| D | 8 | 176 | 9136036 | 80940.58 | 394 | 377 | 112.9 |
| D | 2 | 172 | 904950 | 8014.38 | 394 | 377 | 112.9 |
| D | 3 | 12 | 314080 | 2779.36 | 394 | 377 | 112.9 |
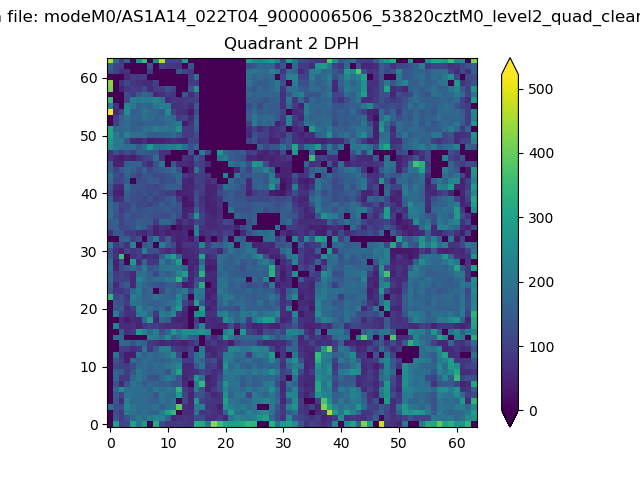
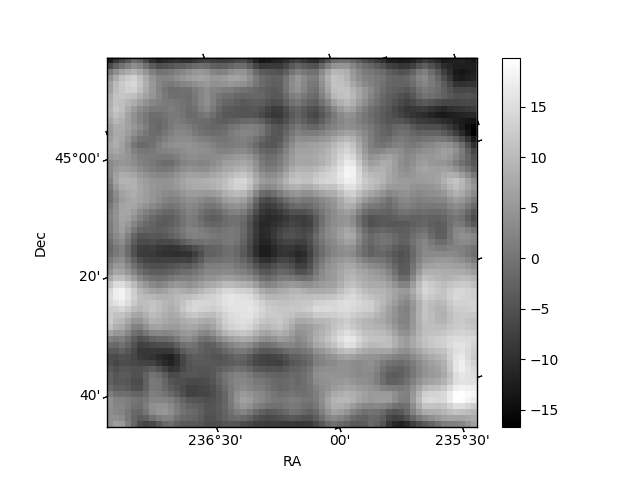
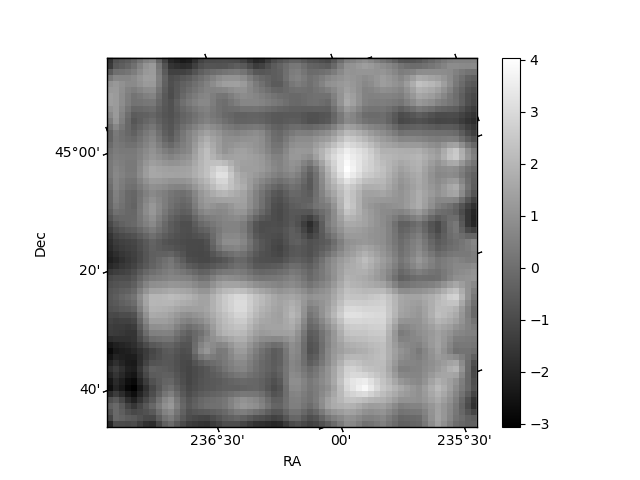
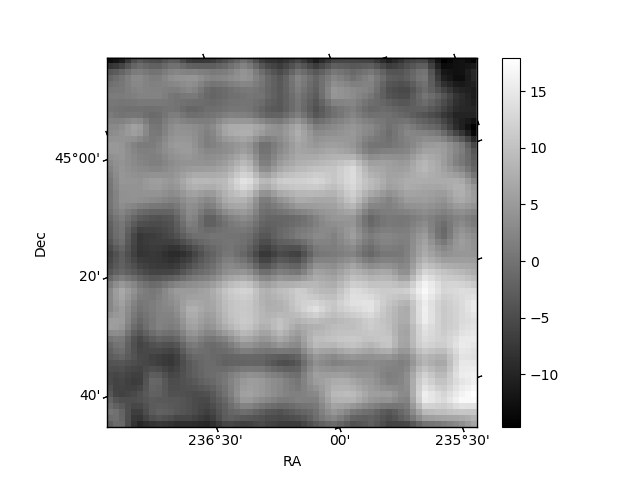
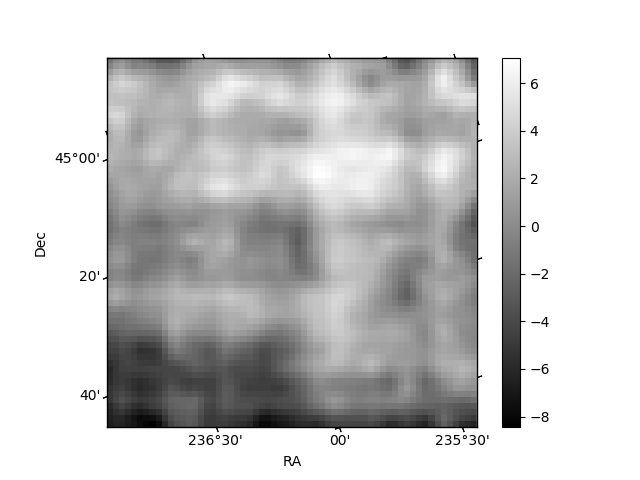
Histogram calculated using DETX and DETY for each event in the final _common_clean file
| Quadrant A | 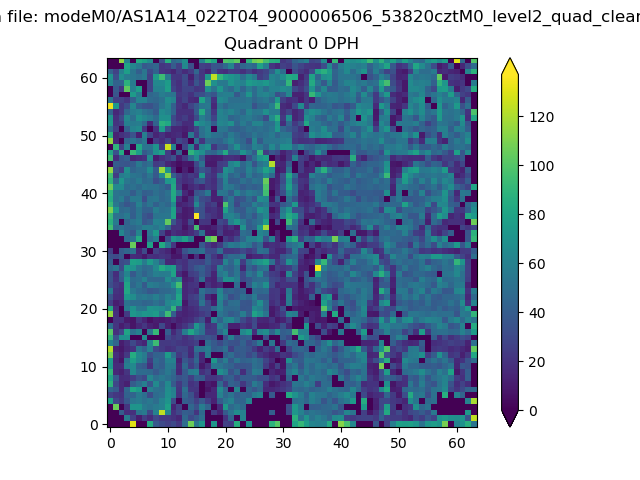 |
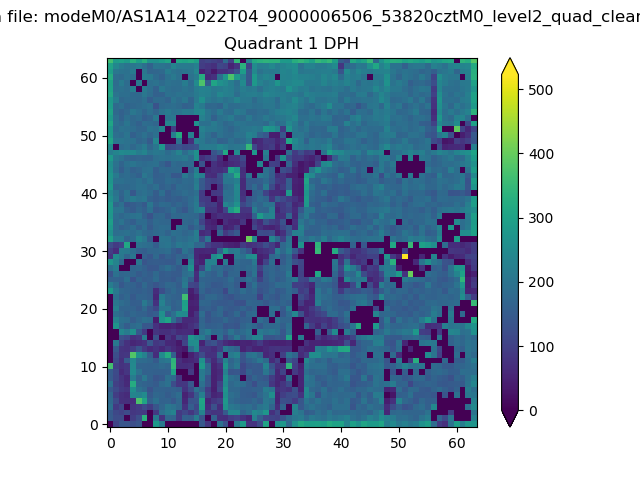 |
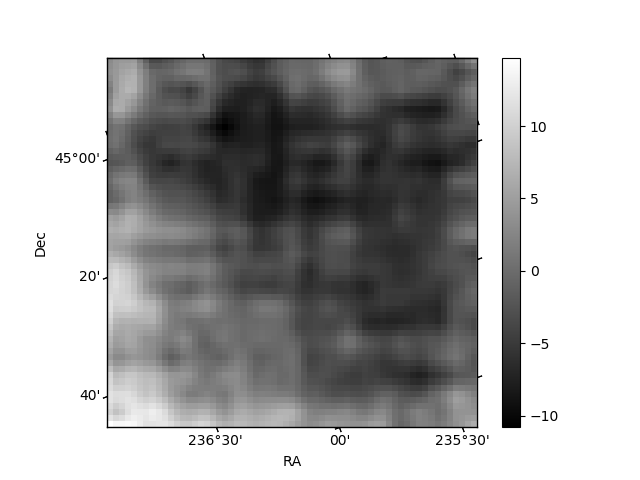
Quadrant B |
|---|---|---|---|
| Quadrant D | 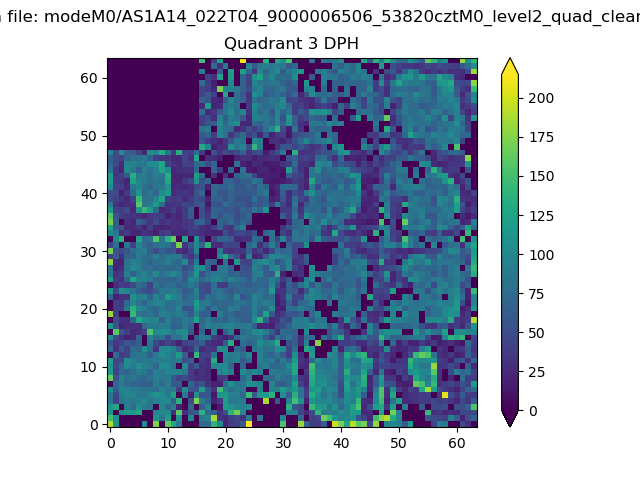 |
 |
Quadrant C |
| Plot type | Count rate plots | Images |
|---|---|---|
| Comparison with Poisson distribution Blue bars denote a histogram of data divided into 1 sec bins. Red curve is a Poisson curve with rate = median count rate of data. |
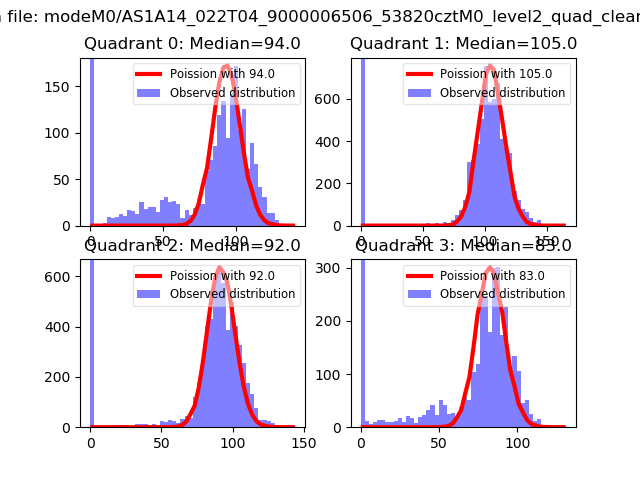 |
 |
| Quadrant-wise count rates Data is divided into 100 sec bins |
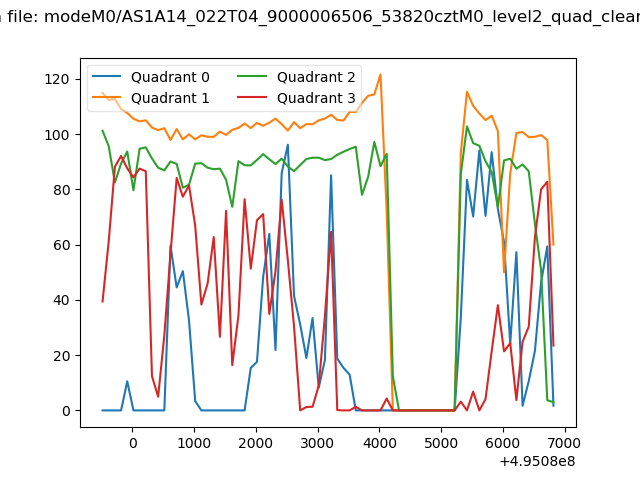 |
|
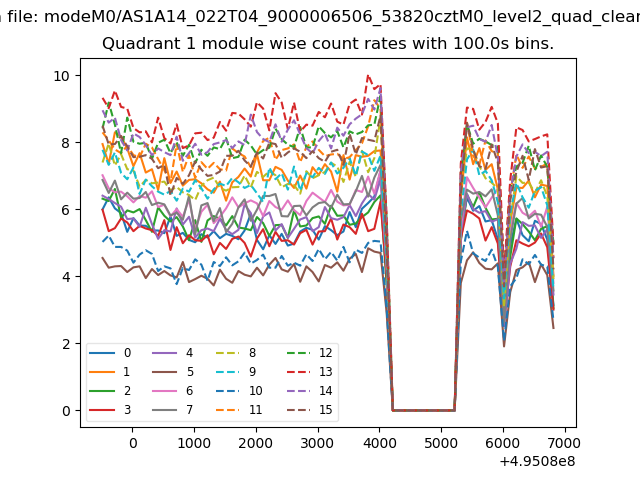
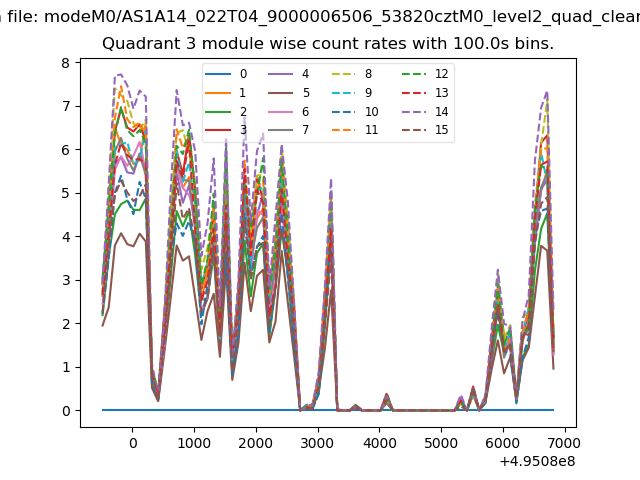
| Module-wise count rates for Quadrant A Data is divided into 100 sec bins |
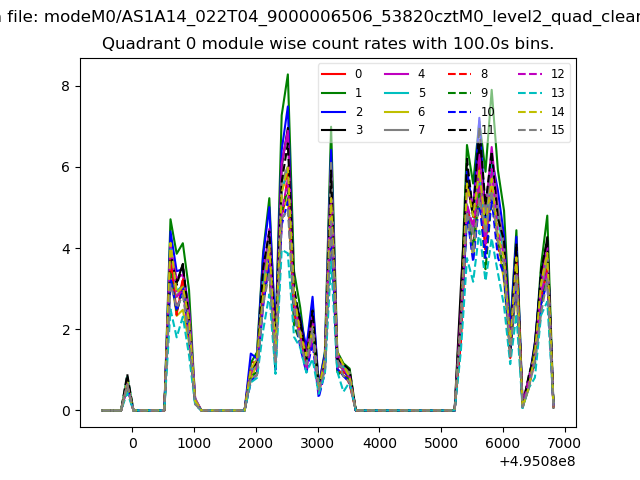 |
 |
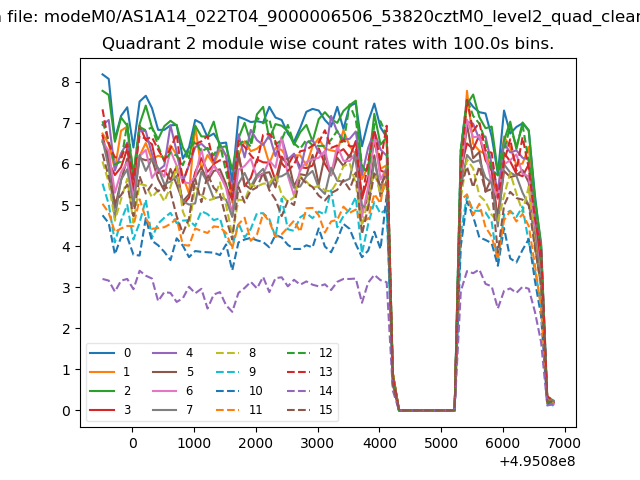
| Module-wise count rates for Quadrant B Data is divided into 100 sec bins |
 |
 |
| Module-wise count rates for Quadrant C Data is divided into 100 sec bins |
 |
 |
| Module-wise count rates for Quadrant D Data is divided into 100 sec bins |
 |
 |
| Parameter | Plot |
|---|---|
| CZT HV Monitor | 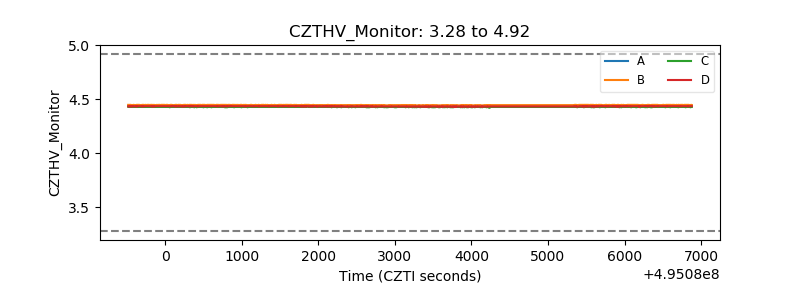 |
| D_VDD | 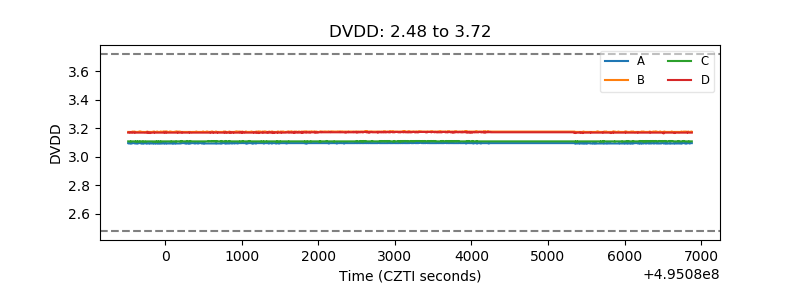 |
| Temperature 1 | 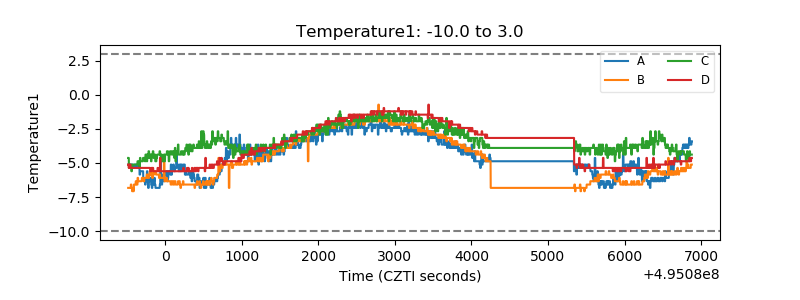 |
| Veto HV Monitor | 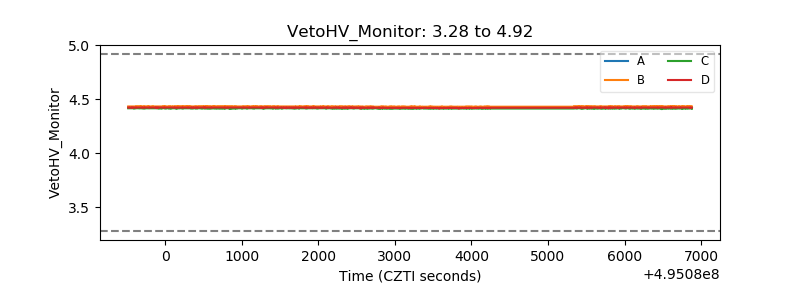 |
| Veto LLD | 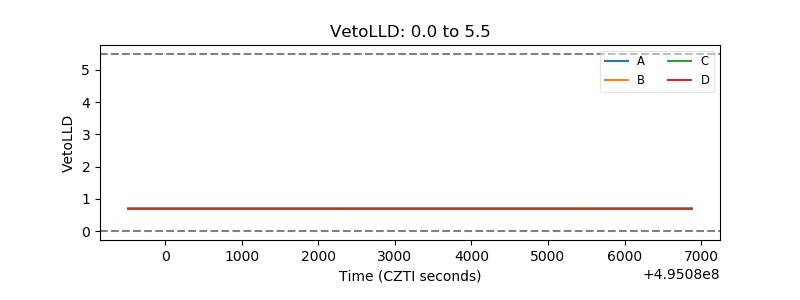 |
| Alpha Counter | 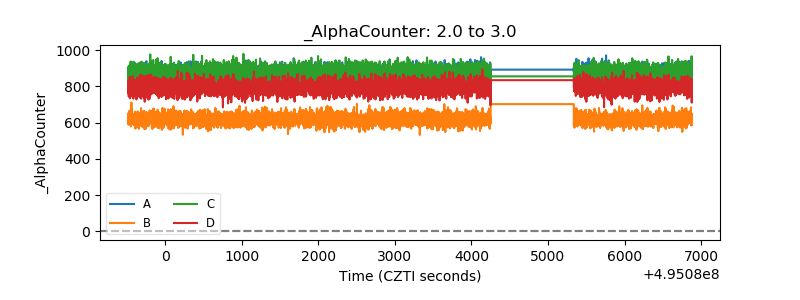 |
| _CPM_Rate | 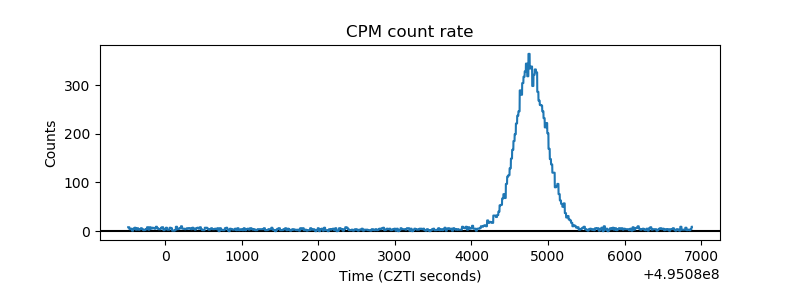 |
| CZT Counter | 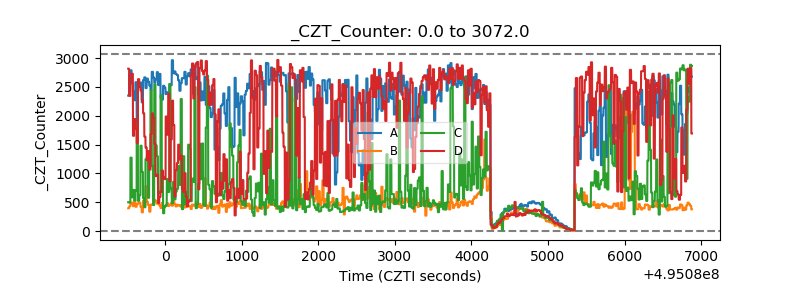 |
| +2.5 Volts monitor |  |
| +5 Volts monitor |  |
| _ROLL_ROT | 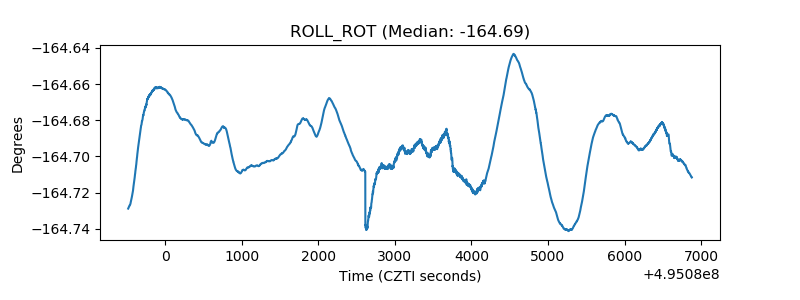 |
| _Roll_DEC | 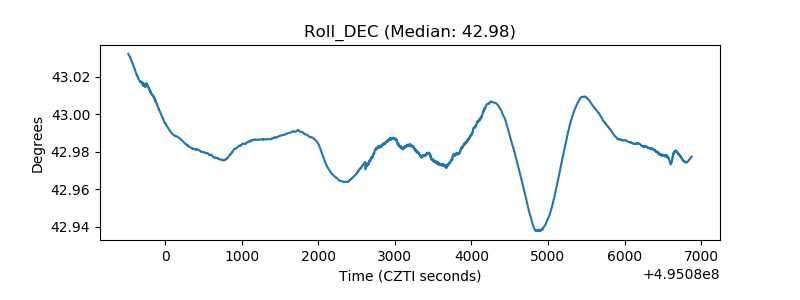 |
| _Roll_RA | 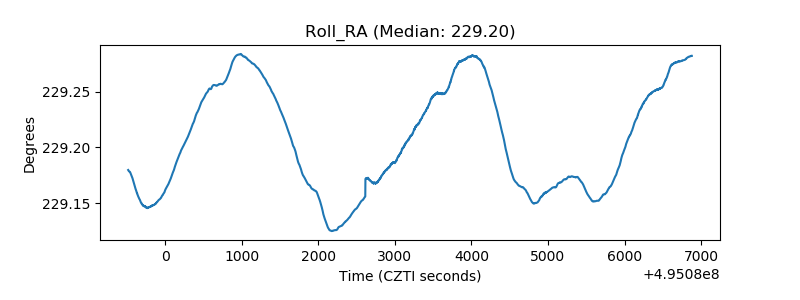 |
| Veto Counter | 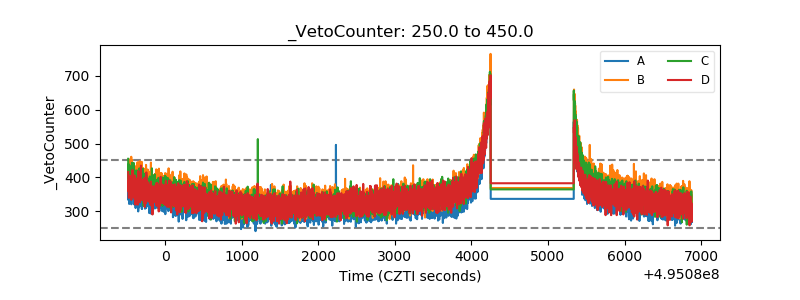 |