| Param | Original file | Final file |
|---|---|---|
| Filename | modeM0/AS1A14_022T04_9000006506_53821cztM0_level2.fits | modeM0/AS1A14_022T04_9000006506_53821cztM0_level2_quad_clean.evt |
| Size (bytes) | 792,642,240 | 75,052,800 |
| Size | 755.9 MB | 71.6 MB |
| Events in quadrant A | 4,809,905 | 521,829 |
| Events in quadrant B | 3,441,547 | 627,516 |
| Events in quadrant C | 8,216,380 | 421,152 |
| Events in quadrant D | 12,387,136 | 263,708 |
| Mode M0 | |||
|---|---|---|---|
| Quadrant | BADHDUFLAG | Total packets | Discarded packets |
| A | 0 | 18902 | 4 |
| B | 0 | 14707 | 1 |
| C | 0 | 28728 | 1 |
| D | 0 | 41141 | 1 |
| Mode SS | |||
|---|---|---|---|
| Quadrant | BADHDUFLAG | Total packets | Discarded packets |
| A | 0 | 128 | 0 |
| B | 0 | 128 | 0 |
| C | 0 | 128 | 0 |
| D | 0 | 128 | 0 |
| Mode M9 | |||
|---|---|---|---|
| Quadrant | BADHDUFLAG | Total packets | Discarded packets |
| A | 0 | 9 | 0 |
| B | 0 | 9 | 0 |
| C | 0 | 9 | 0 |
| D | 0 | 9 | 0 |
| Quadrant | Total seconds | Saturated seconds | Saturation percentage |
|---|---|---|---|
| A | 6167 | 819 | 13.280363% |
| B | 6313 | 224 | 3.548234% |
| C | 6314 | 1849 | 29.284131% |
| D | 6314 | 3599 | 57.000317% |
Noise dominated data is calculated using 1-second bins in cleaned event files. If a bin has >2000 counts, and if more than 50% of those come from <1% of pixels, then it is considered to be noise-dominated and hence unusable.
| Quadrant | # 1 sec bins | Bins with >0 counts | Bins with >2000 counts | High rate bins dominated by noise | Noise dominated (total time) | Noise dominated (detector-on time) | Marked lightcurve |
|---|---|---|---|---|---|---|---|
| A | 7188 | 6169 | 703 | 703 | 9.78% | 11.40% | 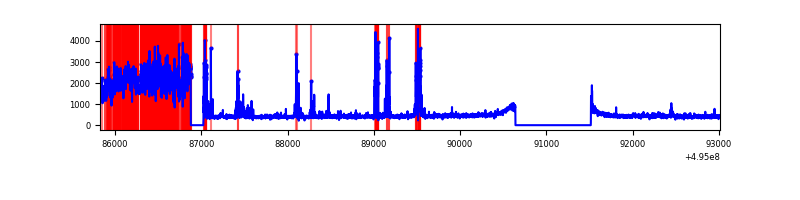 |
| B | 7188 | 6314 | 74 | 74 | 1.03% | 1.17% | 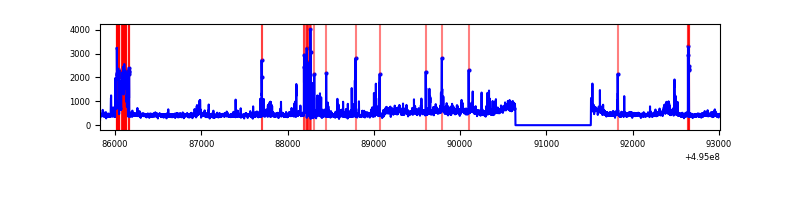 |
| C | 7189 | 6315 | 1701 | 1701 | 23.66% | 26.94% | 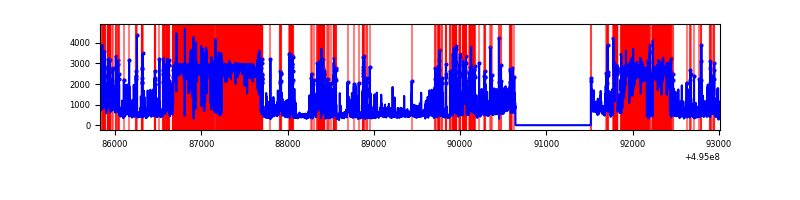 |
| D | 7189 | 6314 | 3201 | 3201 | 44.53% | 50.70% | 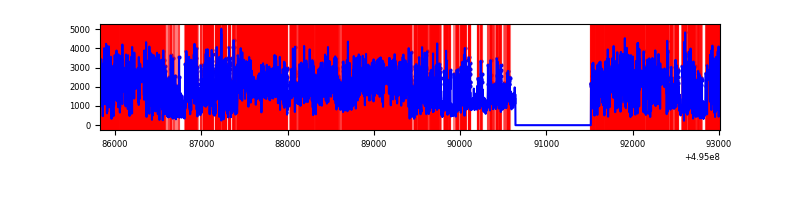 |
Top three noisy pixels from each quadrant. If the there are fewer than three noisy pixels in the level2.evt file, extra rows are filled as -1
| Pixel properties | Quadrant properties | ||||||
|---|---|---|---|---|---|---|---|
| Quadrant | DetID | PixID | Counts | Sigma | Mean | Median | Sigma |
| A | 3 | 63 | 1713391 | 10896.96 | 642 | 627 | 157.2 |
| A | 0 | 8 | 291327 | 1849.49 | 642 | 627 | 157.2 |
| A | 4 | 13 | 190544 | 1208.29 | 642 | 627 | 157.2 |
| B | 5 | 172 | 232909 | 1624.37 | 666 | 643 | 143.0 |
| B | 7 | 0 | 163464 | 1138.7 | 666 | 643 | 143.0 |
| B | 0 | 213 | 126455 | 879.88 | 666 | 643 | 143.0 |
| C | 1 | 241 | 3569212 | 22949.04 | 561 | 556 | 155.5 |
| C | 15 | 224 | 1998501 | 12848.23 | 561 | 556 | 155.5 |
| C | 12 | 252 | 107136 | 685.38 | 561 | 556 | 155.5 |
| D | 8 | 176 | 7213157 | 52501.53 | 483 | 461 | 137.4 |
| D | 2 | 172 | 2640062 | 19213.77 | 483 | 461 | 137.4 |
| D | 3 | 12 | 176491 | 1281.33 | 483 | 461 | 137.4 |
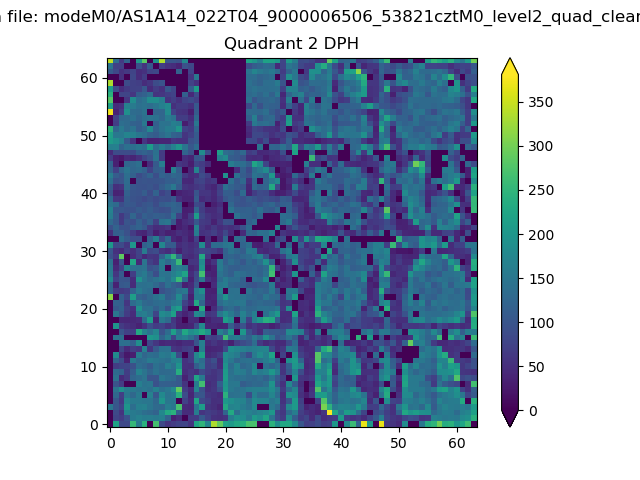
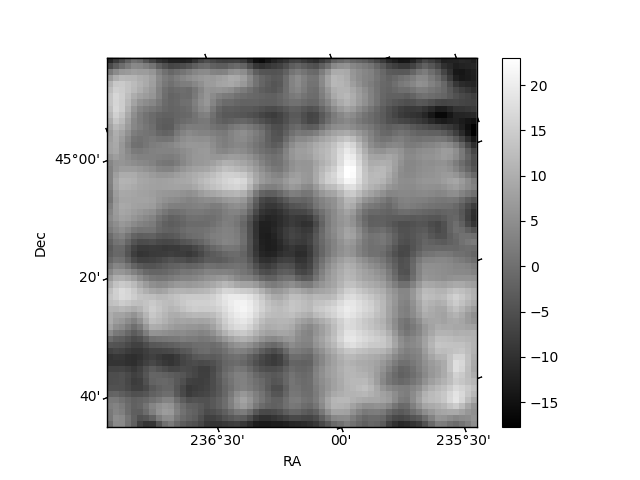
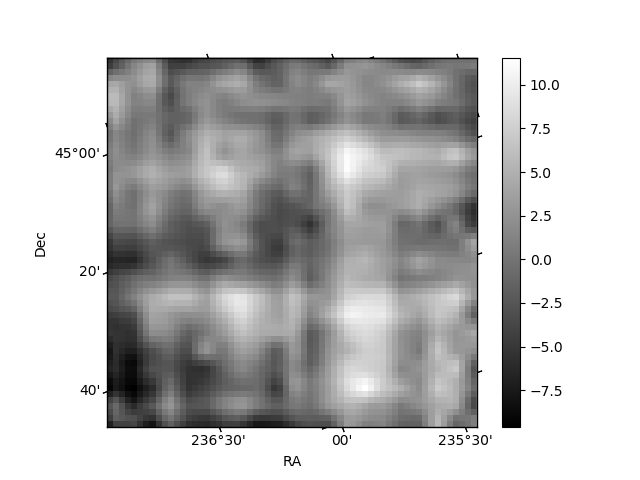
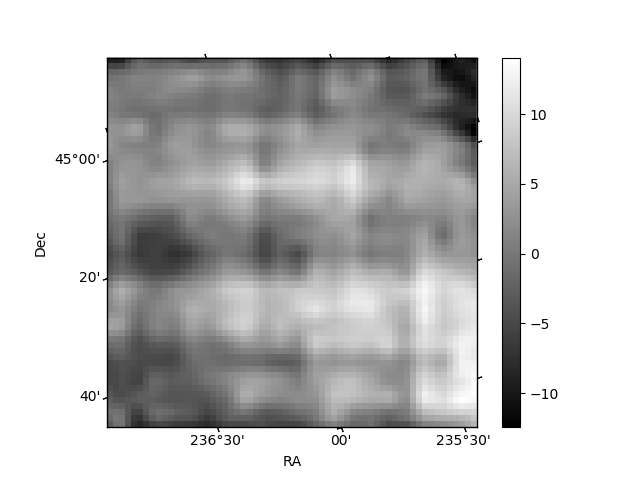
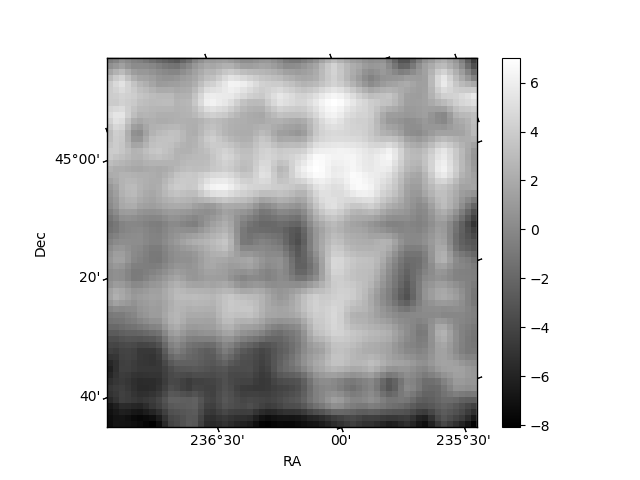
Histogram calculated using DETX and DETY for each event in the final _common_clean file
| Quadrant A | 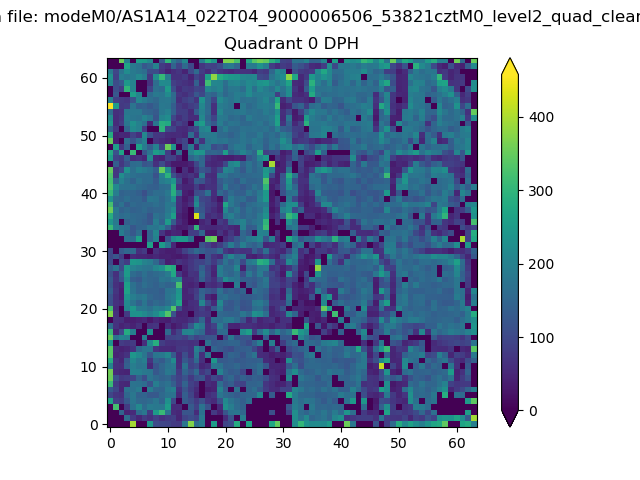 |
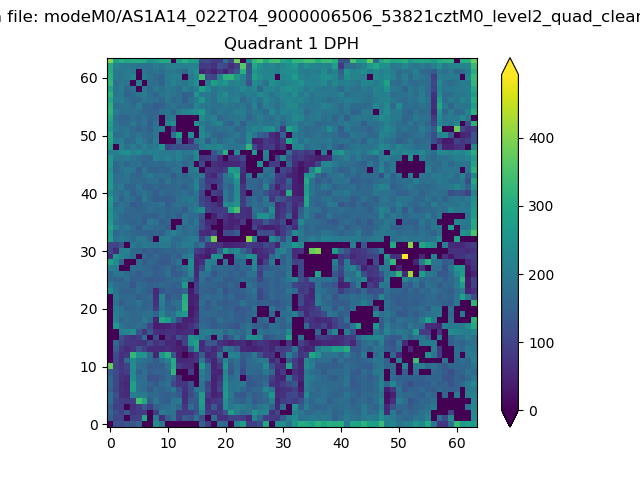 |
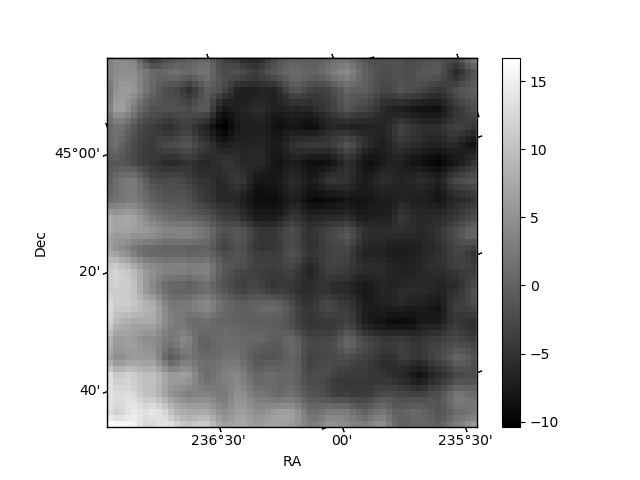
Quadrant B |
|---|---|---|---|
| Quadrant D | 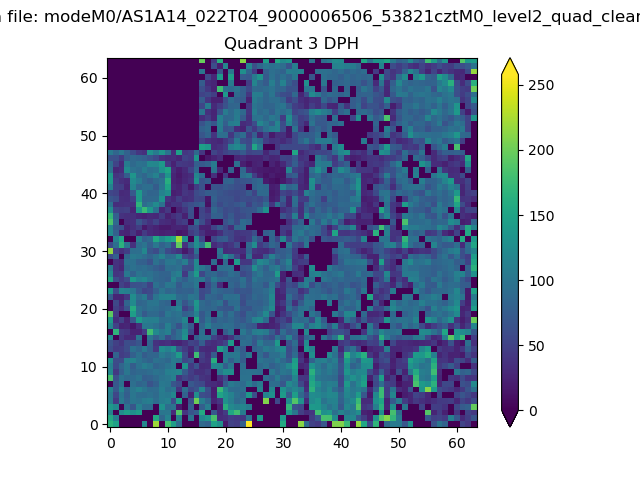 |
 |
Quadrant C |
| Plot type | Count rate plots | Images |
|---|---|---|
| Comparison with Poisson distribution Blue bars denote a histogram of data divided into 1 sec bins. Red curve is a Poisson curve with rate = median count rate of data. |
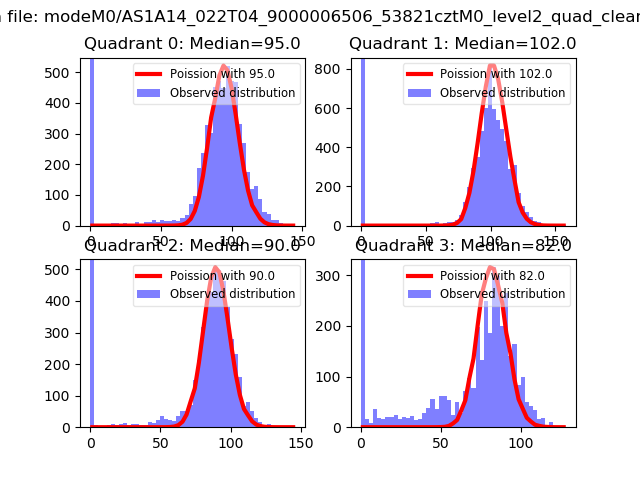 |
 |
| Quadrant-wise count rates Data is divided into 100 sec bins |
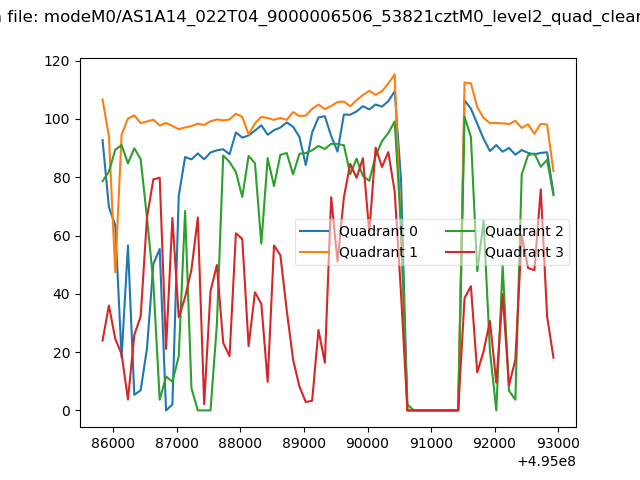 |
|
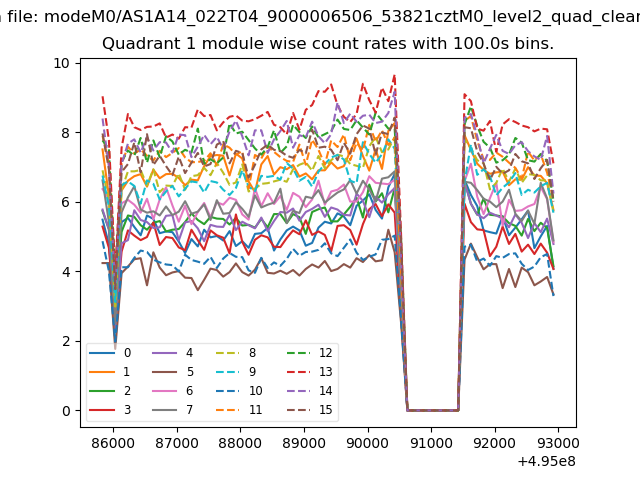
| Module-wise count rates for Quadrant A Data is divided into 100 sec bins |
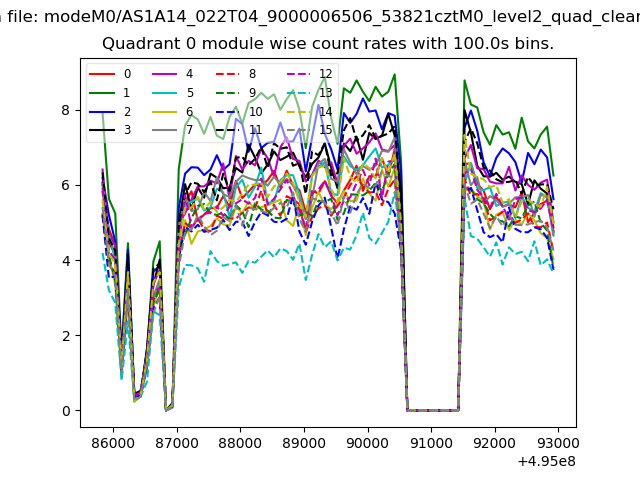 |
 |
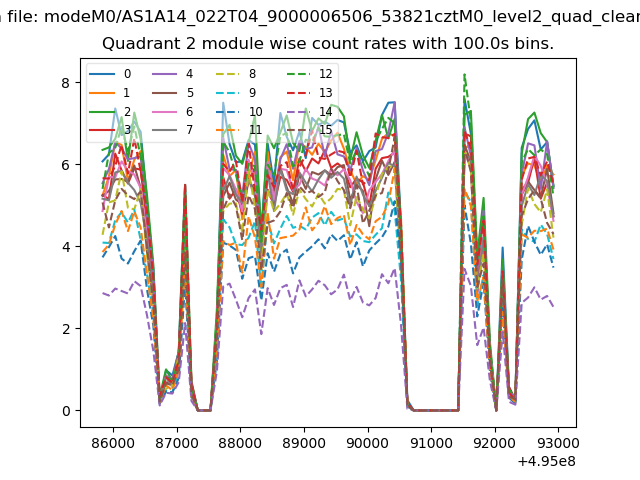
| Module-wise count rates for Quadrant B Data is divided into 100 sec bins |
 |
 |
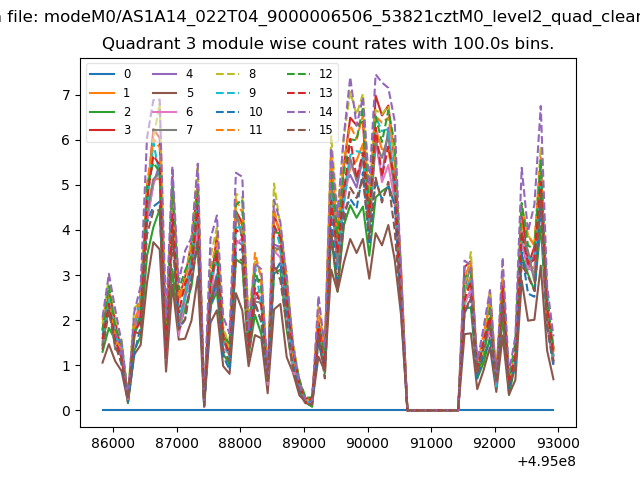
| Module-wise count rates for Quadrant C Data is divided into 100 sec bins |
 |
 |
| Module-wise count rates for Quadrant D Data is divided into 100 sec bins |
 |
 |
| Parameter | Plot |
|---|---|
| CZT HV Monitor | 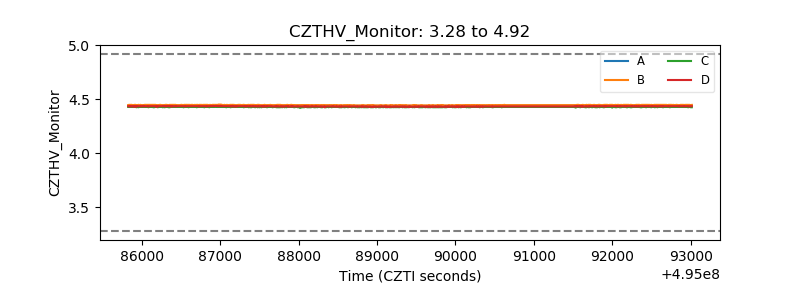 |
| D_VDD |  |
| Temperature 1 | 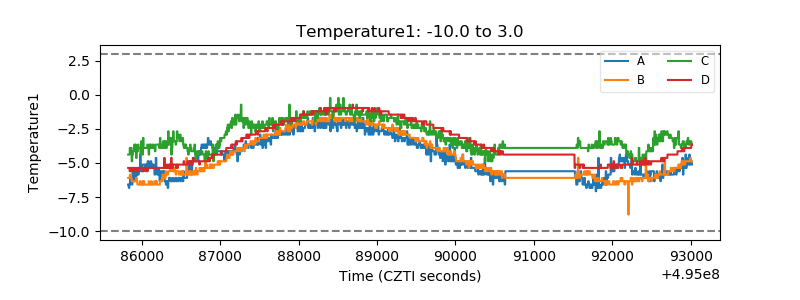 |
| Veto HV Monitor | 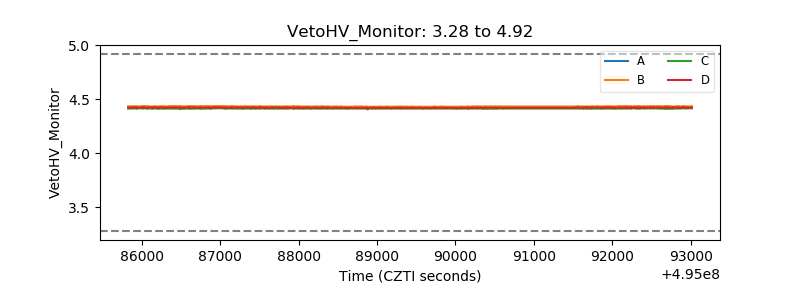 |
| Veto LLD | 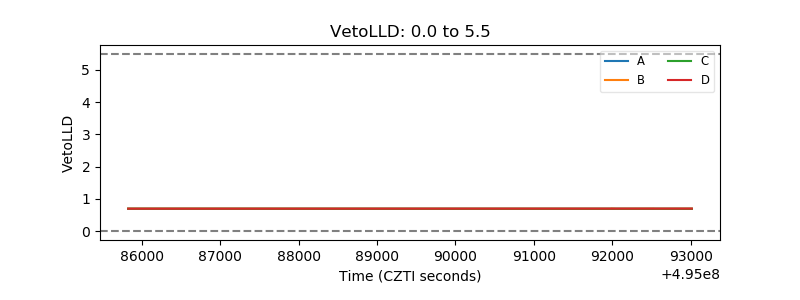 |
| Alpha Counter | 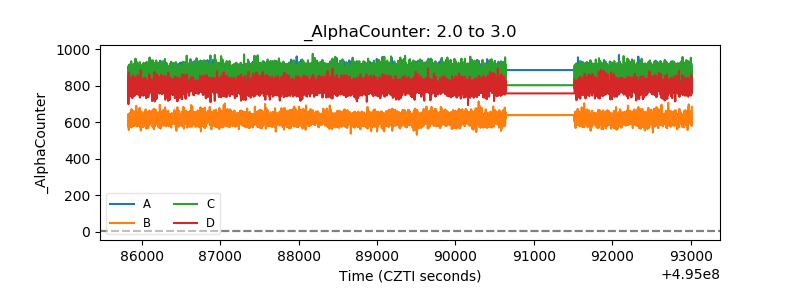 |
| _CPM_Rate | 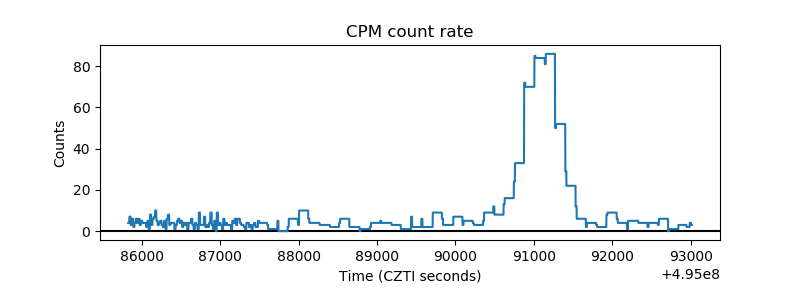 |
| CZT Counter | 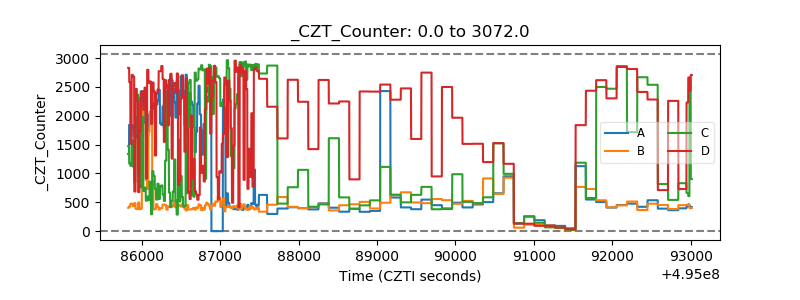 |
| +2.5 Volts monitor |  |
| +5 Volts monitor |  |
| _ROLL_ROT | 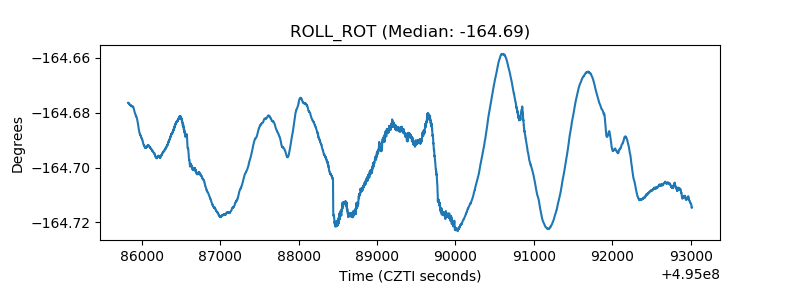 |
| _Roll_DEC | 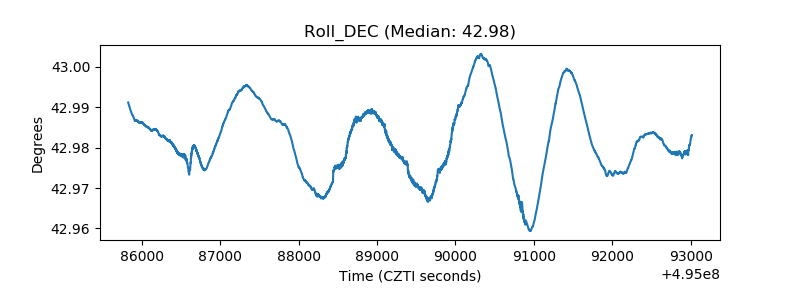 |
| _Roll_RA | 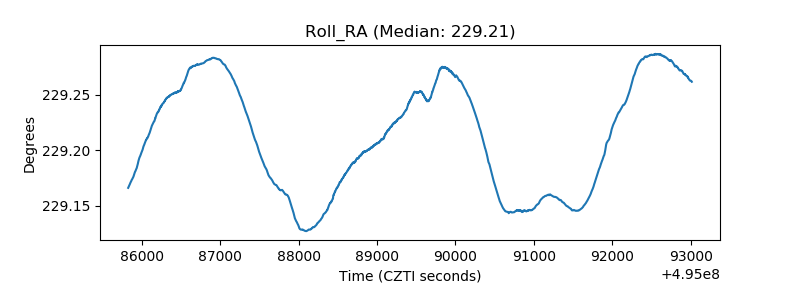 |
| Veto Counter | 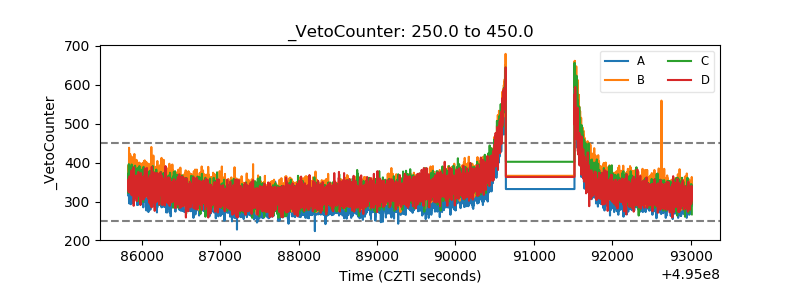 |