| Param | Original file | Final file |
|---|---|---|
| Filename | modeM0/AS1A14_022T04_9000006506_53823cztM0_level2.fits | modeM0/AS1A14_022T04_9000006506_53823cztM0_level2_quad_clean.evt |
| Size (bytes) | 608,814,720 | 111,363,840 |
| Size | 580.6 MB | 106.2 MB |
| Events in quadrant A | 4,176,180 | 737,540 |
| Events in quadrant B | 4,315,787 | 790,772 |
| Events in quadrant C | 5,899,997 | 681,847 |
| Events in quadrant D | 7,528,948 | 610,415 |
| Mode M0 | |||
|---|---|---|---|
| Quadrant | BADHDUFLAG | Total packets | Discarded packets |
| A | 0 | 18273 | 1 |
| B | 0 | 18520 | 1 |
| C | 0 | 23151 | 1 |
| D | 0 | 27860 | 1 |
| Mode SS | |||
|---|---|---|---|
| Quadrant | BADHDUFLAG | Total packets | Discarded packets |
| A | 0 | 158 | 0 |
| B | 0 | 158 | 0 |
| C | 0 | 158 | 0 |
| D | 0 | 158 | 0 |
| Quadrant | Total seconds | Saturated seconds | Saturation percentage |
|---|---|---|---|
| A | 7934 | 223 | 2.810688% |
| B | 7934 | 194 | 2.445173% |
| C | 7934 | 487 | 6.138140% |
| D | 7934 | 981 | 12.364507% |
Noise dominated data is calculated using 1-second bins in cleaned event files. If a bin has >2000 counts, and if more than 50% of those come from <1% of pixels, then it is considered to be noise-dominated and hence unusable.
| Quadrant | # 1 sec bins | Bins with >0 counts | Bins with >2000 counts | High rate bins dominated by noise | Noise dominated (total time) | Noise dominated (detector-on time) | Marked lightcurve |
|---|---|---|---|---|---|---|---|
| A | 7949 | 7935 | 139 | 139 | 1.75% | 1.75% | 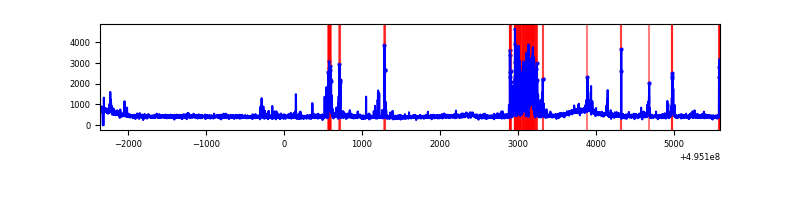 |
| B | 7949 | 7935 | 63 | 63 | 0.79% | 0.79% | 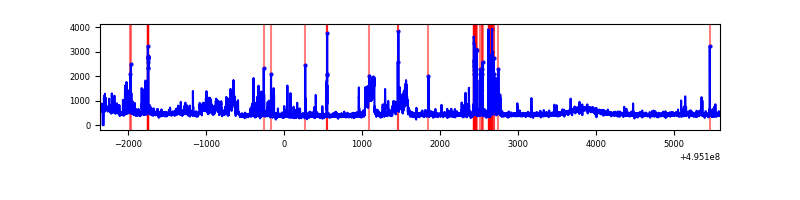 |
| C | 7949 | 7935 | 386 | 386 | 4.86% | 4.86% | 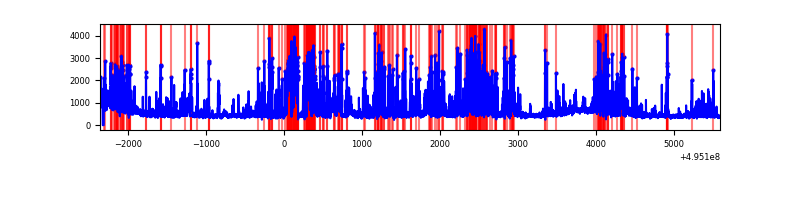 |
| D | 7949 | 7935 | 939 | 939 | 11.81% | 11.83% | 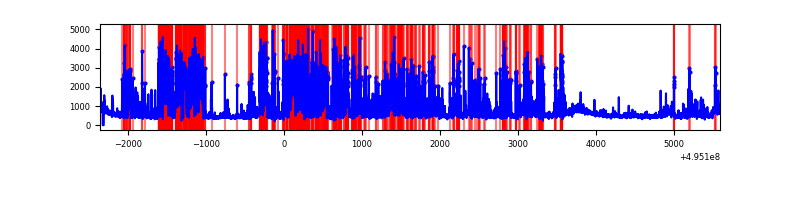 |
Top three noisy pixels from each quadrant. If the there are fewer than three noisy pixels in the level2.evt file, extra rows are filled as -1
| Pixel properties | Quadrant properties | ||||||
|---|---|---|---|---|---|---|---|
| Quadrant | DetID | PixID | Counts | Sigma | Mean | Median | Sigma |
| A | 0 | 8 | 567485 | 2720.99 | 852 | 830 | 208.3 |
| A | 5 | 243 | 120017 | 572.32 | 852 | 830 | 208.3 |
| A | 8 | 249 | 75414 | 358.14 | 852 | 830 | 208.3 |
| B | 10 | 254 | 412223 | 2276.67 | 843 | 813 | 180.7 |
| B | 5 | 185 | 257047 | 1417.95 | 843 | 813 | 180.7 |
| B | 5 | 250 | 66523 | 363.63 | 843 | 813 | 180.7 |
| C | 15 | 224 | 1873883 | 8425.74 | 810 | 799 | 222.3 |
| C | 1 | 241 | 370261 | 1661.96 | 810 | 799 | 222.3 |
| C | 7 | 64 | 162999 | 729.63 | 810 | 799 | 222.3 |
| D | 8 | 176 | 3371413 | 15094.23 | 791 | 755 | 223.3 |
| D | 2 | 172 | 203790 | 909.22 | 791 | 755 | 223.3 |
| D | 3 | 144 | 173910 | 775.41 | 791 | 755 | 223.3 |
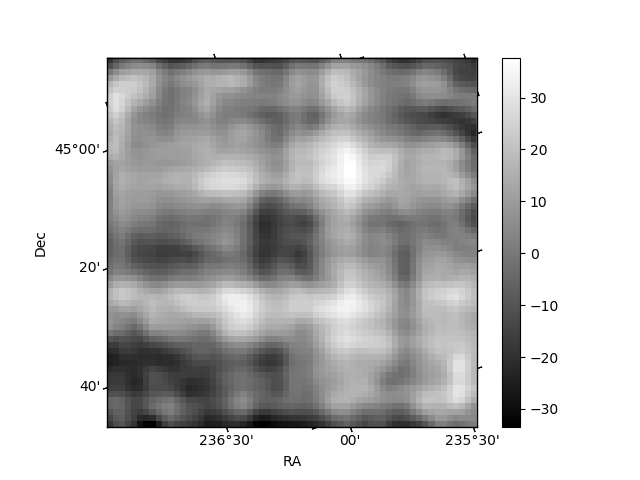
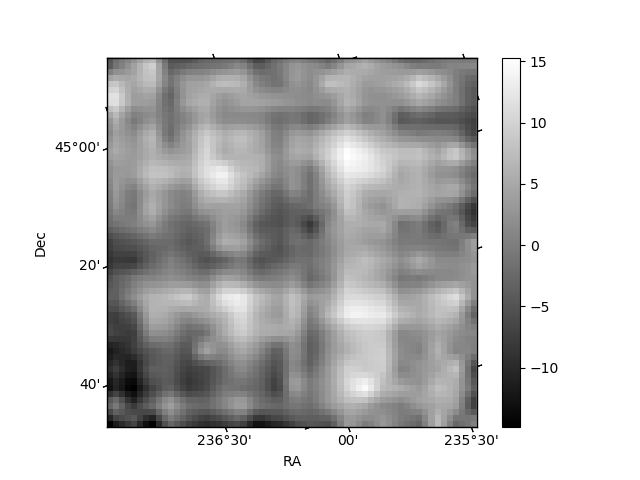
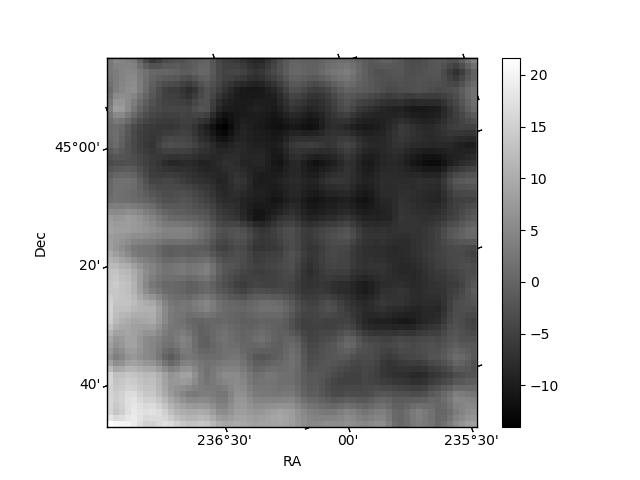
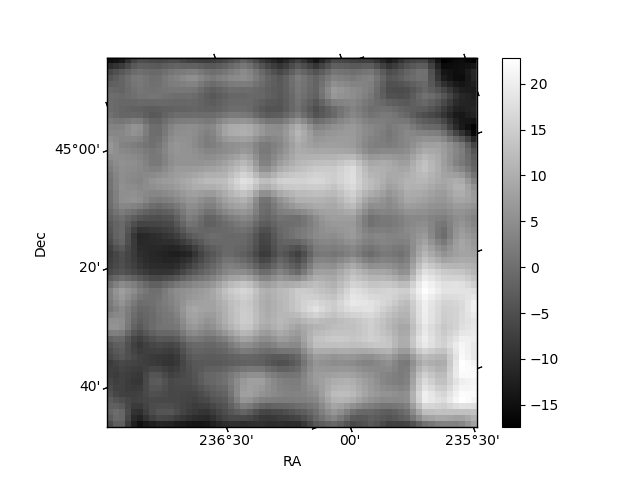
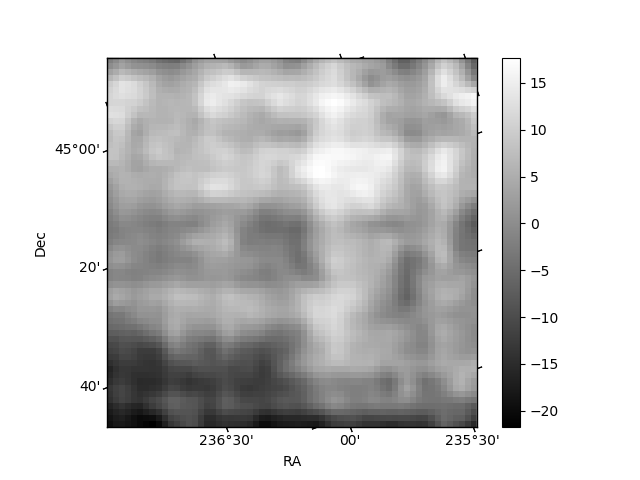
Histogram calculated using DETX and DETY for each event in the final _common_clean file
| Quadrant A | 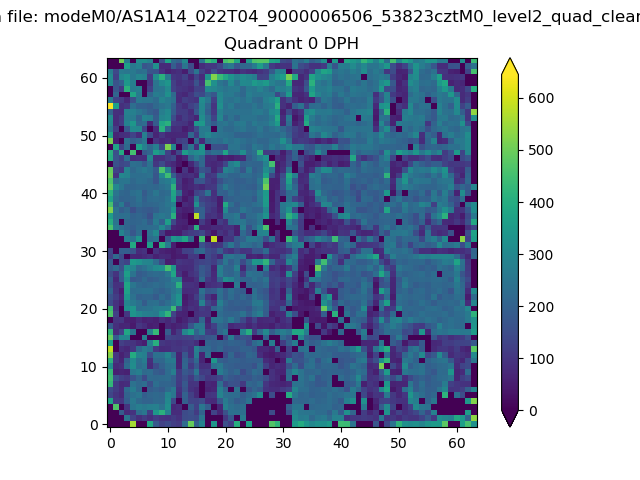 |
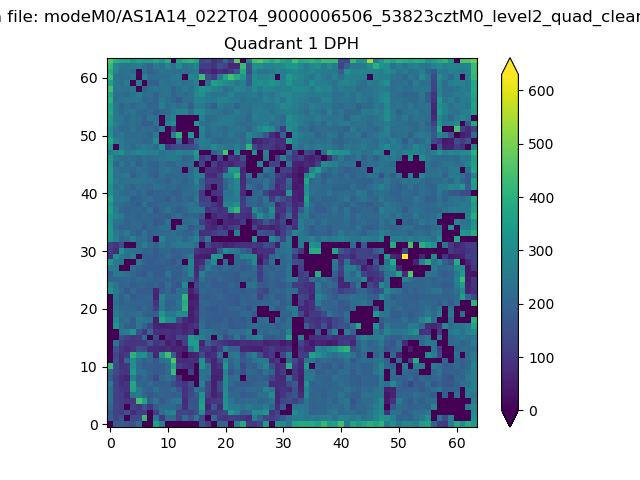 |
Quadrant B |
|---|---|---|---|
| Quadrant D | 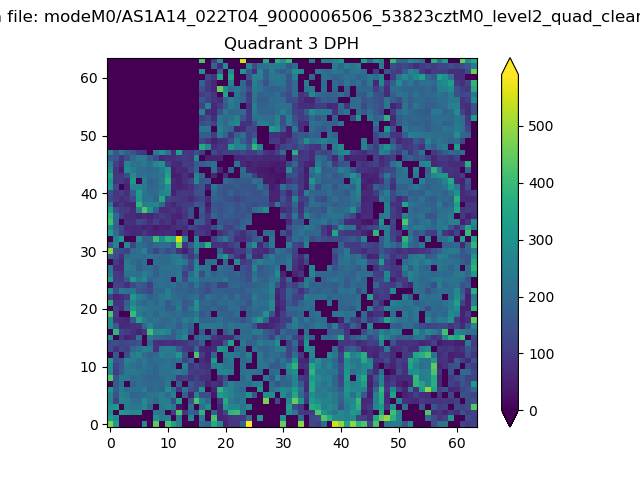 |
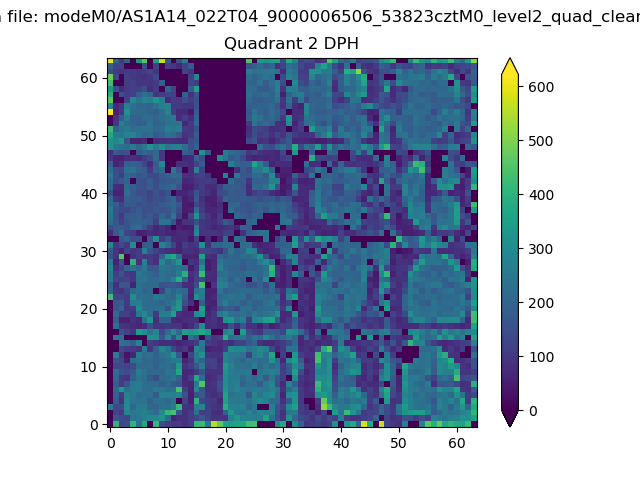 |
Quadrant C |
| Plot type | Count rate plots | Images |
|---|---|---|
| Comparison with Poisson distribution Blue bars denote a histogram of data divided into 1 sec bins. Red curve is a Poisson curve with rate = median count rate of data. |
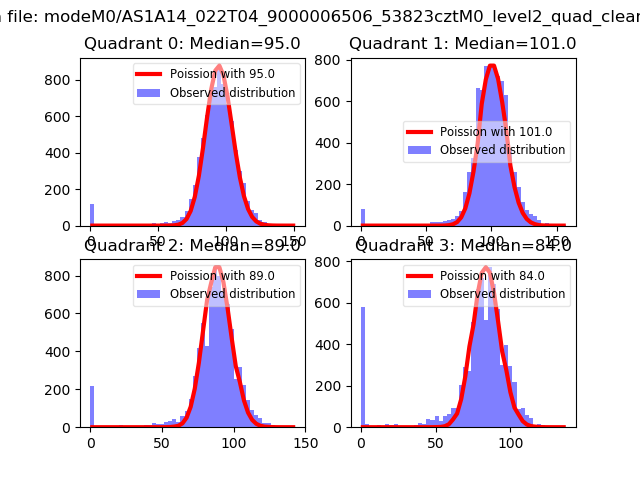 |
 |
| Quadrant-wise count rates Data is divided into 100 sec bins |
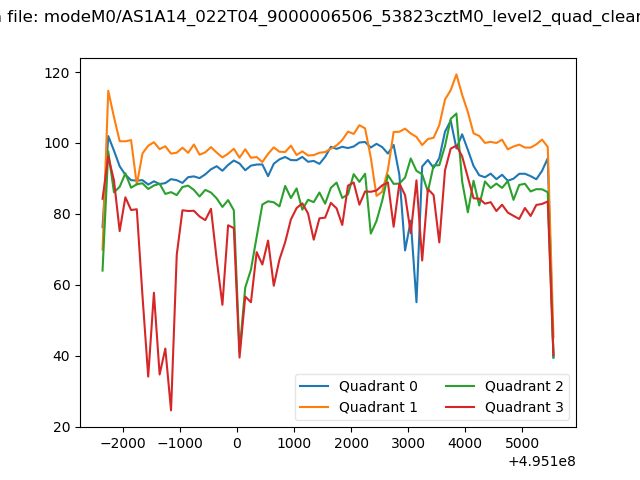 |
|
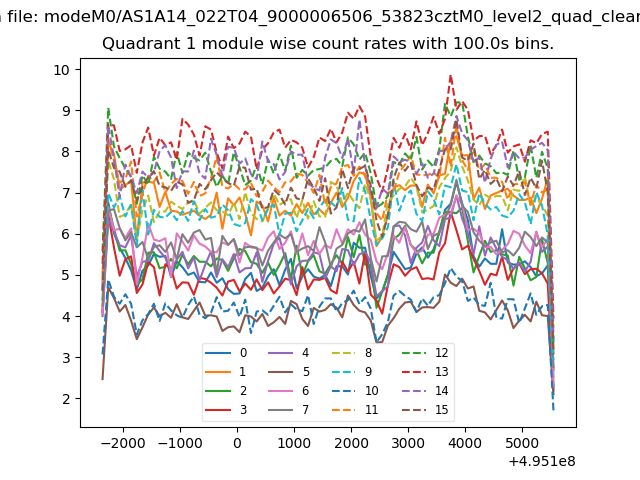
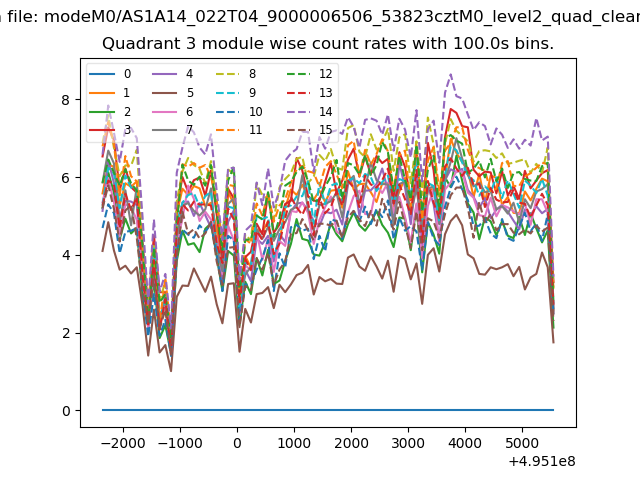
| Module-wise count rates for Quadrant A Data is divided into 100 sec bins |
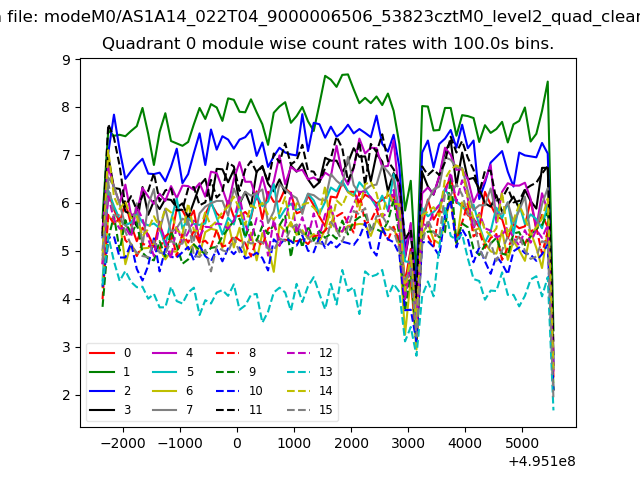 |
 |
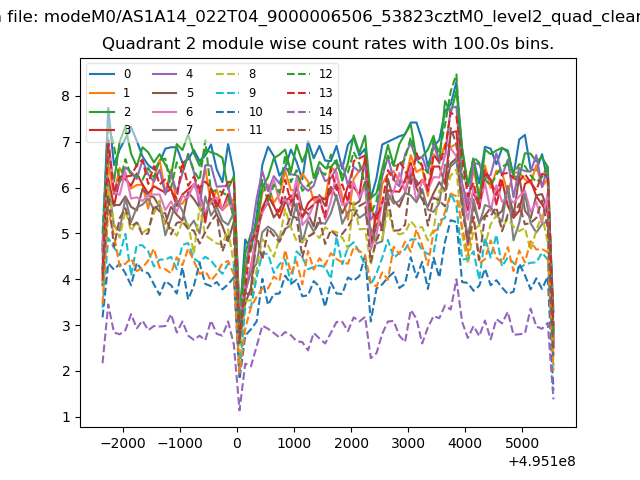
| Module-wise count rates for Quadrant B Data is divided into 100 sec bins |
 |
 |
| Module-wise count rates for Quadrant C Data is divided into 100 sec bins |
 |
 |
| Module-wise count rates for Quadrant D Data is divided into 100 sec bins |
 |
 |
| Parameter | Plot |
|---|---|
| CZT HV Monitor | 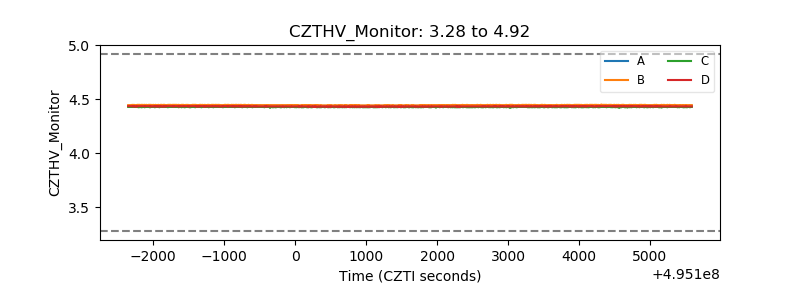 |
| D_VDD | 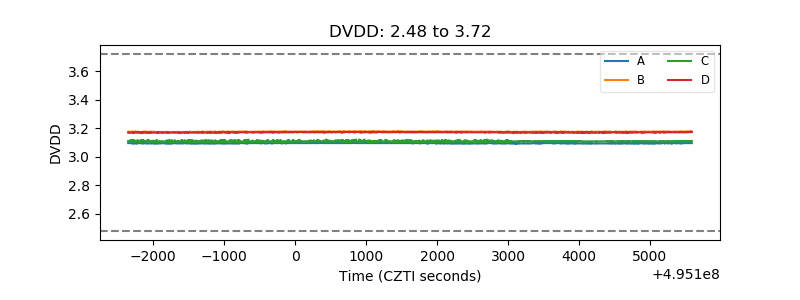 |
| Temperature 1 | 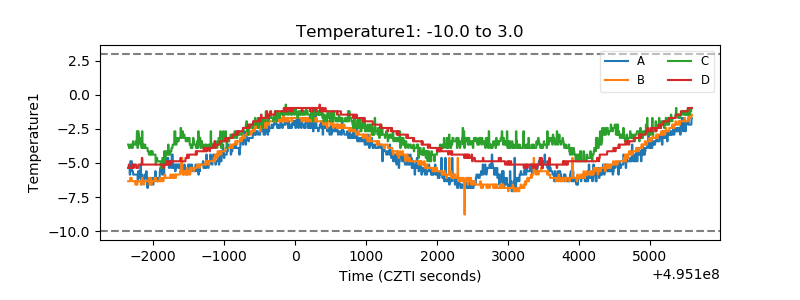 |
| Veto HV Monitor | 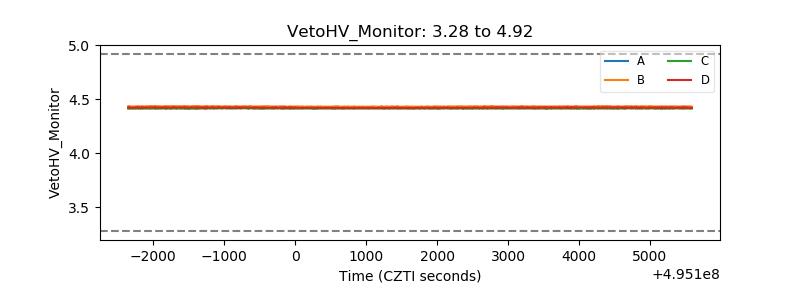 |
| Veto LLD | 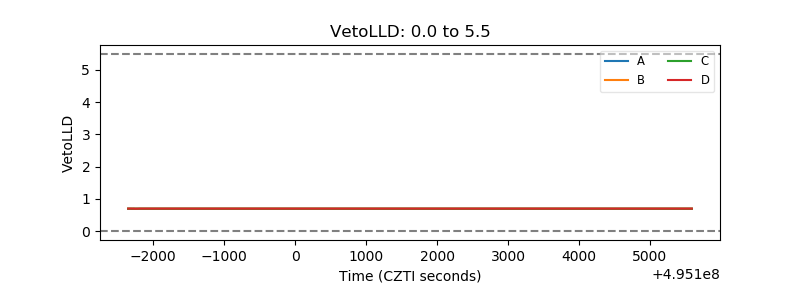 |
| Alpha Counter | 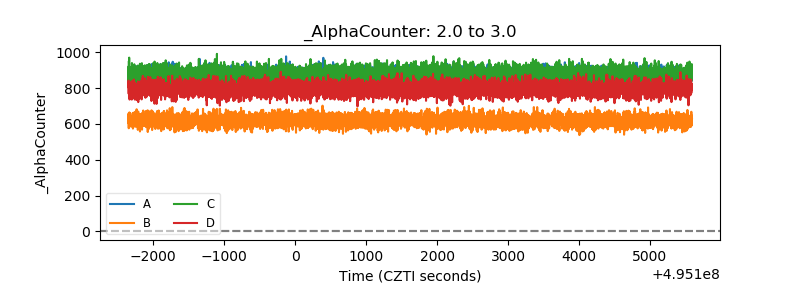 |
| _CPM_Rate | 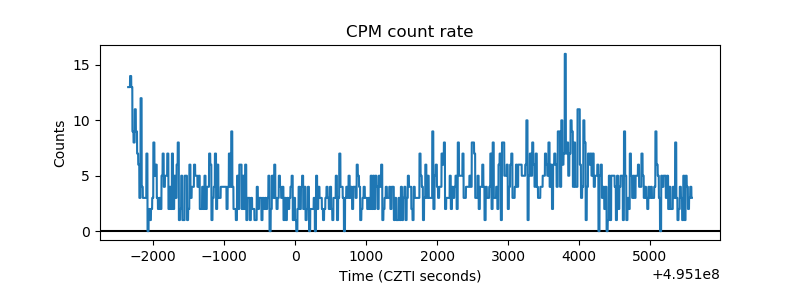 |
| CZT Counter | 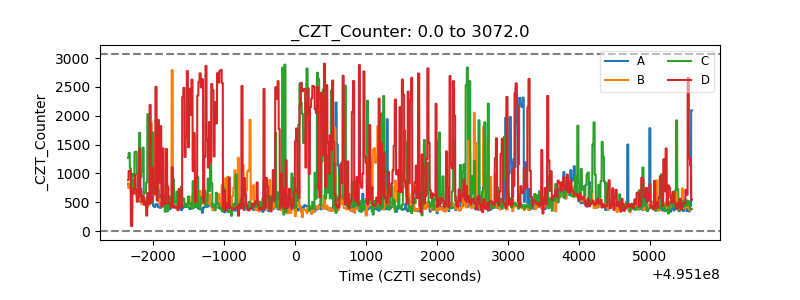 |
| +2.5 Volts monitor |  |
| +5 Volts monitor |  |
| _ROLL_ROT | 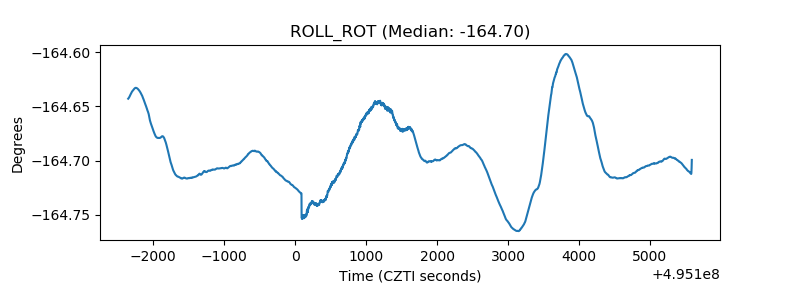 |
| _Roll_DEC | 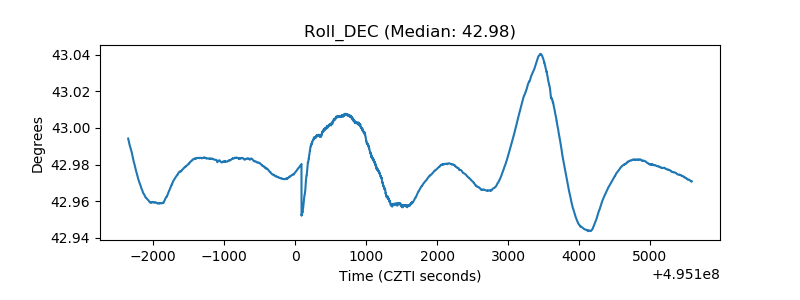 |
| _Roll_RA | 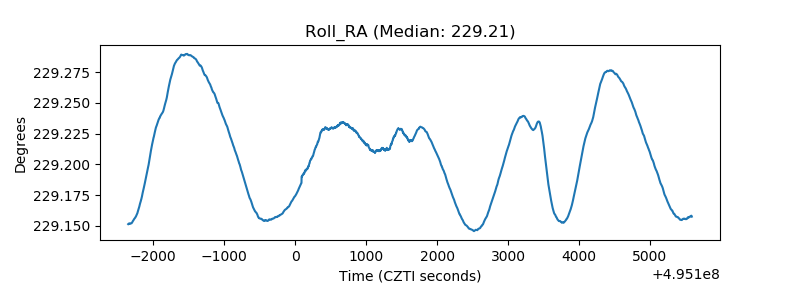 |
| Veto Counter | 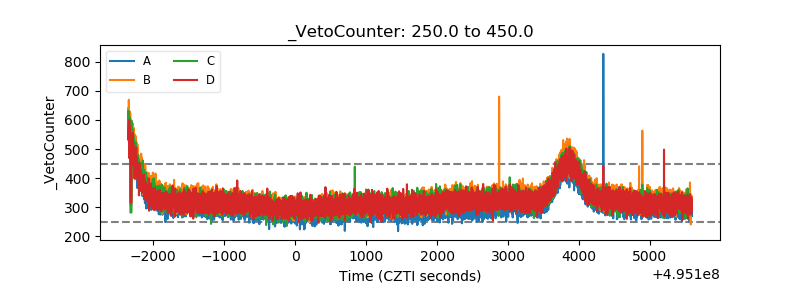 |