| Param | Original file | Final file |
|---|---|---|
| Filename | modeM0/AS1A14_022T04_9000006506_53824cztM0_level2.fits | modeM0/AS1A14_022T04_9000006506_53824cztM0_level2_quad_clean.evt |
| Size (bytes) | 618,603,840 | 104,996,160 |
| Size | 589.9 MB | 100.1 MB |
| Events in quadrant A | 3,397,097 | 721,812 |
| Events in quadrant B | 3,541,724 | 768,943 |
| Events in quadrant C | 8,729,616 | 534,811 |
| Events in quadrant D | 6,636,043 | 620,411 |
| Mode M0 | |||
|---|---|---|---|
| Quadrant | BADHDUFLAG | Total packets | Discarded packets |
| A | 0 | 15916 | 0 |
| B | 0 | 16145 | 0 |
| C | 0 | 31310 | 1 |
| D | 0 | 24989 | 0 |
| Mode SS | |||
|---|---|---|---|
| Quadrant | BADHDUFLAG | Total packets | Discarded packets |
| A | 0 | 154 | 0 |
| B | 0 | 154 | 0 |
| C | 0 | 154 | 0 |
| D | 0 | 154 | 0 |
| Quadrant | Total seconds | Saturated seconds | Saturation percentage |
|---|---|---|---|
| A | 7662 | 28 | 0.365440% |
| B | 7663 | 31 | 0.404541% |
| C | 7662 | 1698 | 22.161316% |
| D | 7662 | 415 | 5.416340% |
Noise dominated data is calculated using 1-second bins in cleaned event files. If a bin has >2000 counts, and if more than 50% of those come from <1% of pixels, then it is considered to be noise-dominated and hence unusable.
| Quadrant | # 1 sec bins | Bins with >0 counts | Bins with >2000 counts | High rate bins dominated by noise | Noise dominated (total time) | Noise dominated (detector-on time) | Marked lightcurve |
|---|---|---|---|---|---|---|---|
| A | 7662 | 7662 | 18 | 18 | 0.23% | 0.23% | 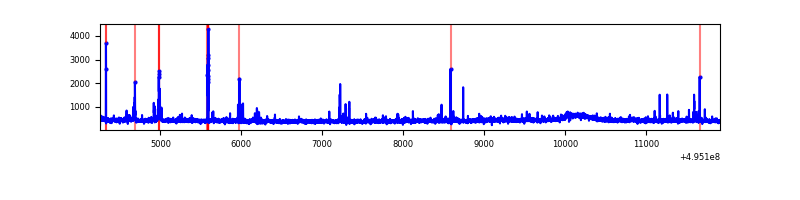 |
| B | 7663 | 7663 | 12 | 12 | 0.16% | 0.16% | 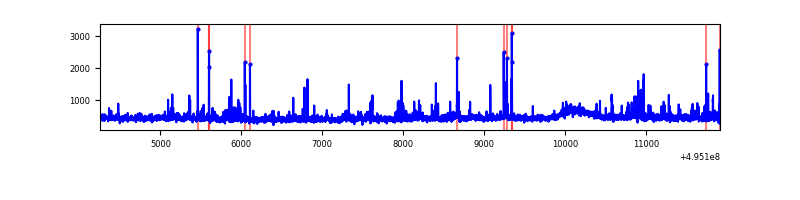 |
| C | 7662 | 7662 | 1560 | 1560 | 20.36% | 20.36% | 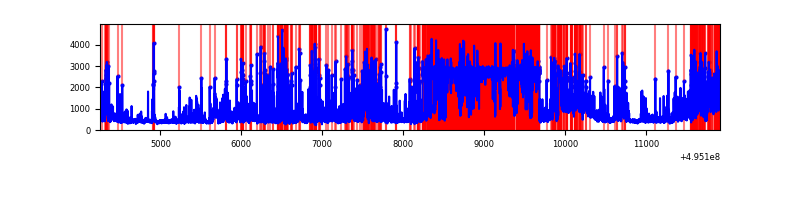 |
| D | 7662 | 7662 | 498 | 498 | 6.50% | 6.50% | 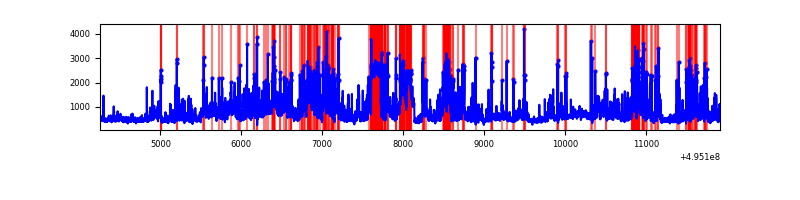 |
Top three noisy pixels from each quadrant. If the there are fewer than three noisy pixels in the level2.evt file, extra rows are filled as -1
| Pixel properties | Quadrant properties | ||||||
|---|---|---|---|---|---|---|---|
| Quadrant | DetID | PixID | Counts | Sigma | Mean | Median | Sigma |
| A | 0 | 8 | 90709 | 447.41 | 813 | 790 | 201.0 |
| A | 4 | 249 | 57671 | 283.02 | 813 | 790 | 201.0 |
| A | 8 | 249 | 28866 | 139.7 | 813 | 790 | 201.0 |
| B | 5 | 185 | 64593 | 369.96 | 803 | 776 | 172.5 |
| B | 0 | 213 | 51461 | 293.83 | 803 | 776 | 172.5 |
| B | 0 | 197 | 46677 | 266.1 | 803 | 776 | 172.5 |
| C | 1 | 241 | 3125492 | 16497.52 | 690 | 684 | 189.4 |
| C | 15 | 224 | 1728071 | 9119.79 | 690 | 684 | 189.4 |
| C | 15 | 158 | 445517 | 2348.51 | 690 | 684 | 189.4 |
| D | 10 | 172 | 1063549 | 4846.46 | 771 | 735 | 219.3 |
| D | 2 | 172 | 903955 | 4118.7 | 771 | 735 | 219.3 |
| D | 8 | 176 | 763269 | 3477.17 | 771 | 735 | 219.3 |
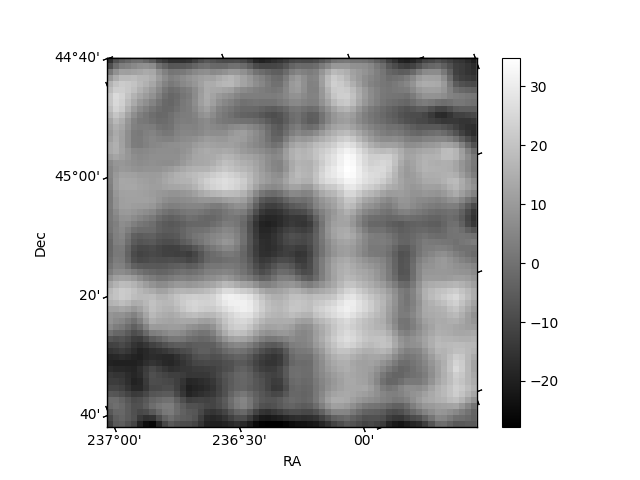
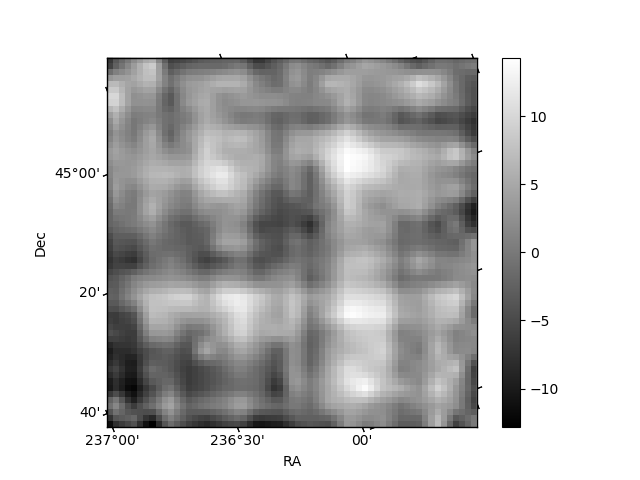
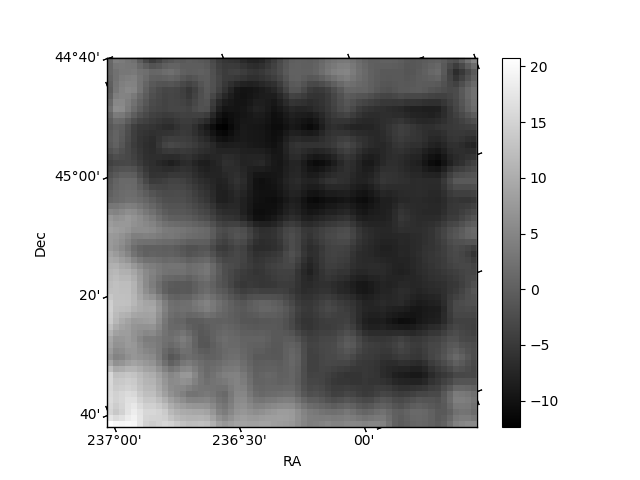
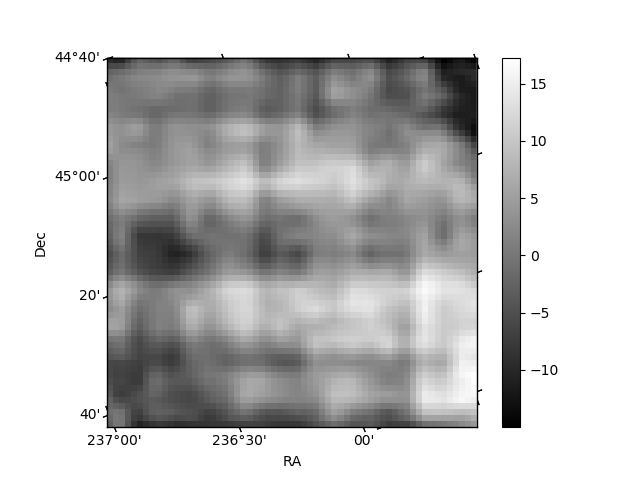
Histogram calculated using DETX and DETY for each event in the final _common_clean file
| Quadrant A | 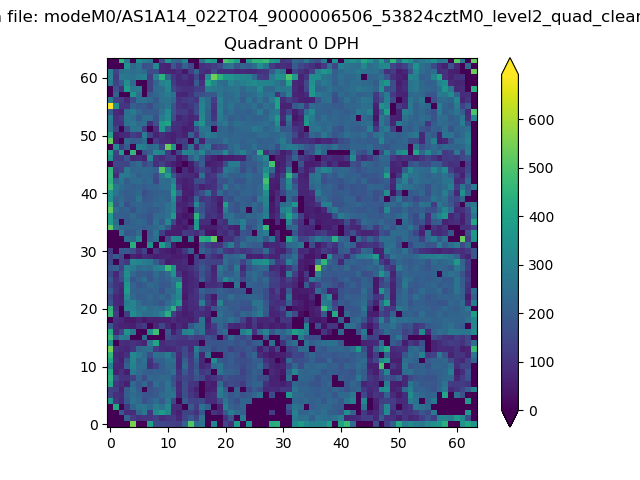 |
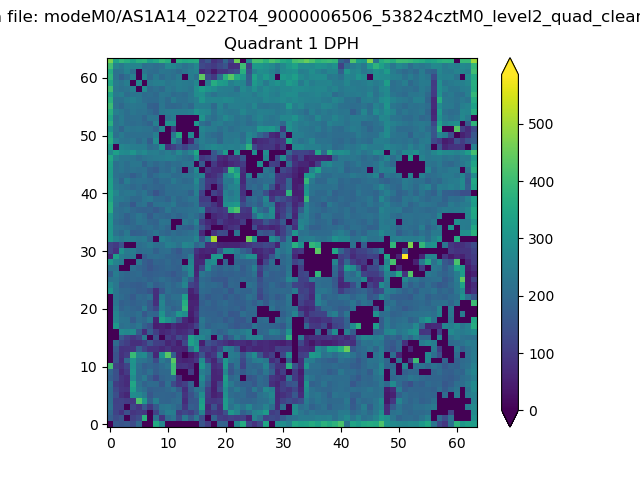 |
Quadrant B |
|---|---|---|---|
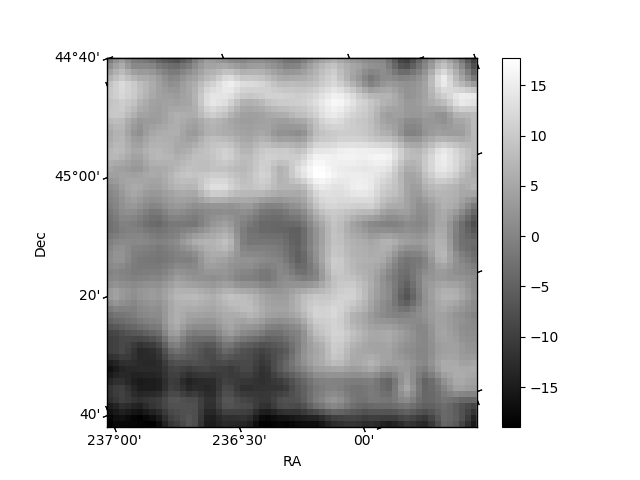
| Quadrant D | 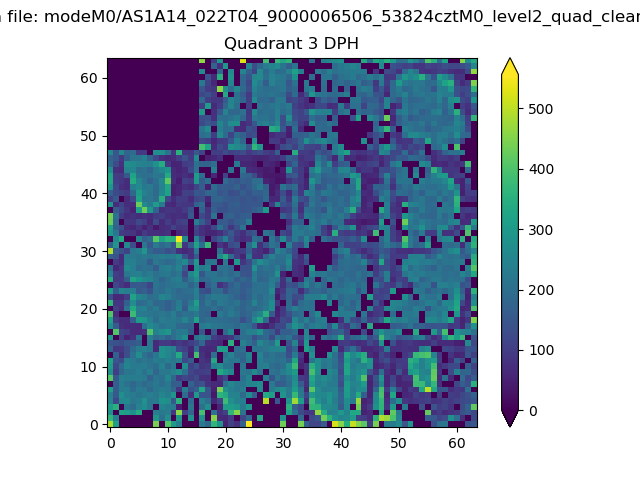 |
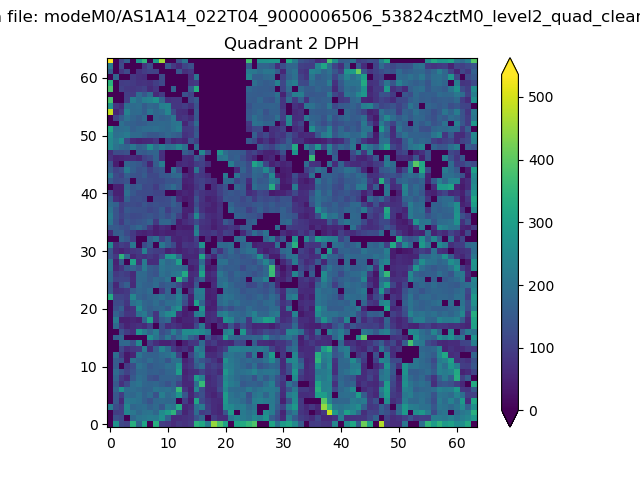 |
Quadrant C |
| Plot type | Count rate plots | Images |
|---|---|---|
| Comparison with Poisson distribution Blue bars denote a histogram of data divided into 1 sec bins. Red curve is a Poisson curve with rate = median count rate of data. |
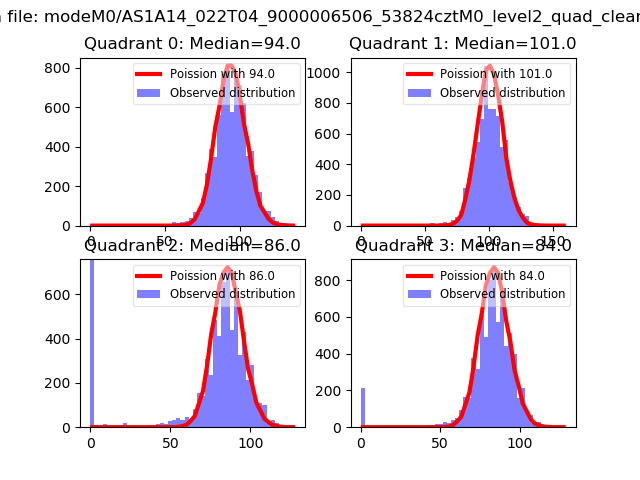 |
 |
| Quadrant-wise count rates Data is divided into 100 sec bins |
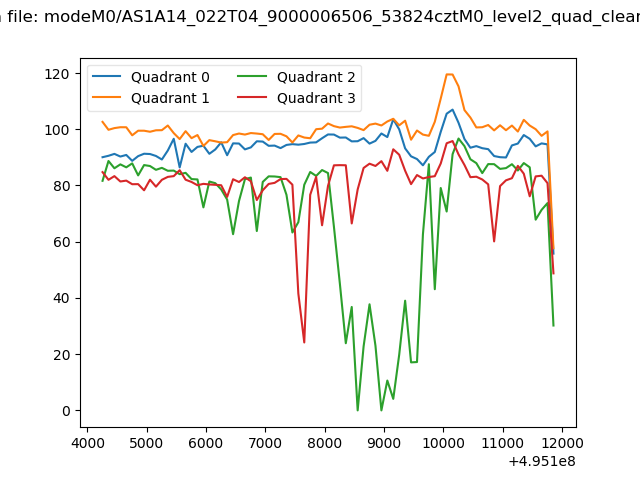 |
|
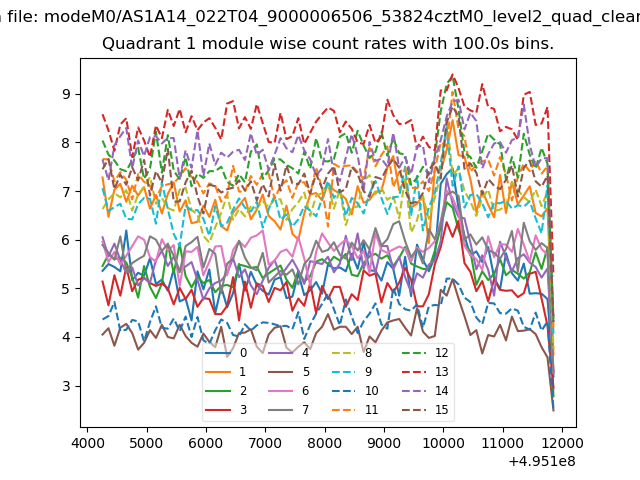
| Module-wise count rates for Quadrant A Data is divided into 100 sec bins |
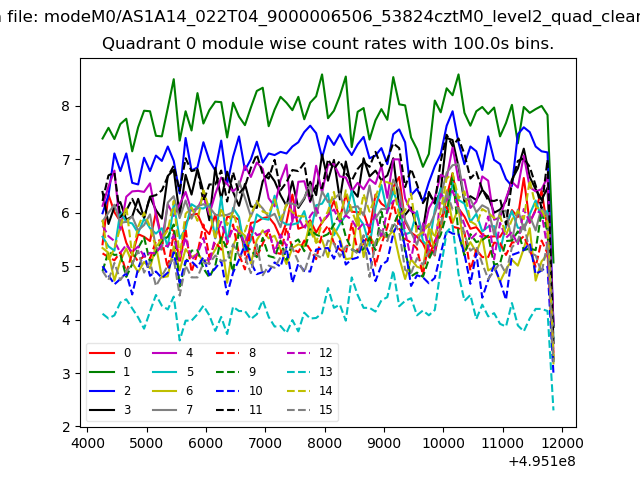 |
 |
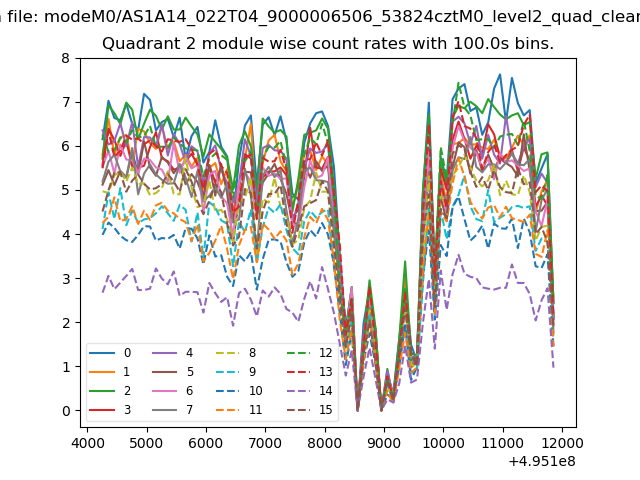
| Module-wise count rates for Quadrant B Data is divided into 100 sec bins |
 |
 |
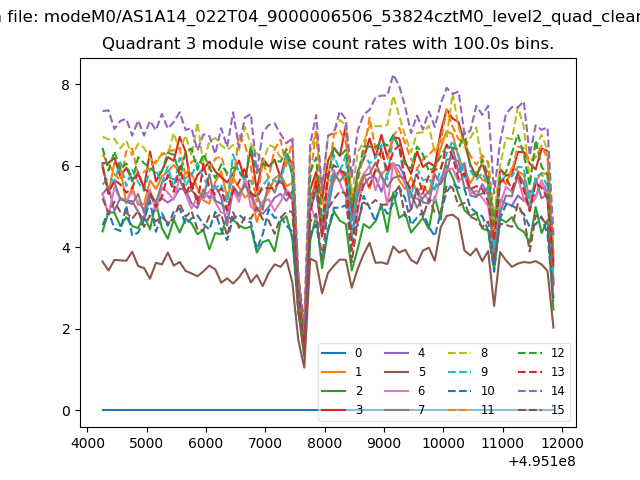
| Module-wise count rates for Quadrant C Data is divided into 100 sec bins |
 |
 |
| Module-wise count rates for Quadrant D Data is divided into 100 sec bins |
 |
 |
| Parameter | Plot |
|---|---|
| CZT HV Monitor | 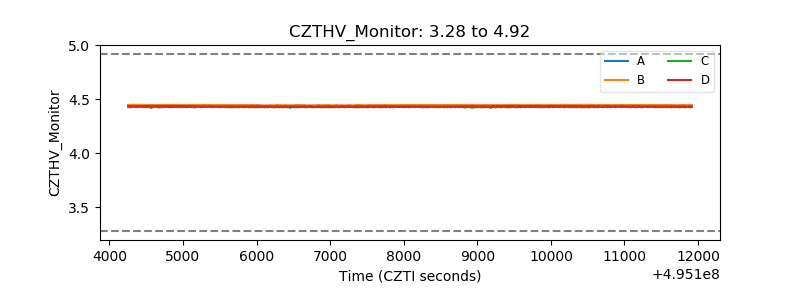 |
| D_VDD | 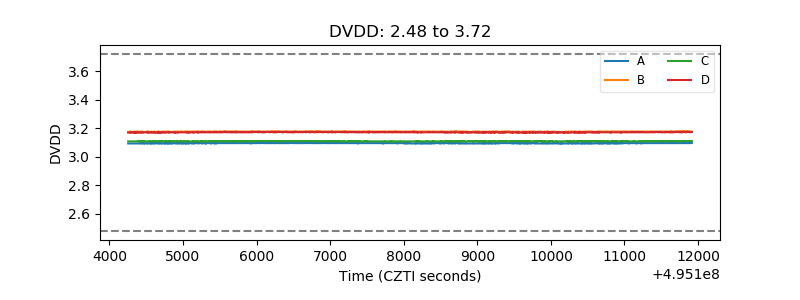 |
| Temperature 1 | 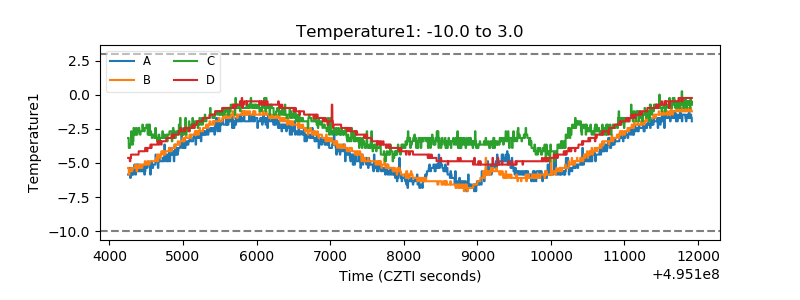 |
| Veto HV Monitor | 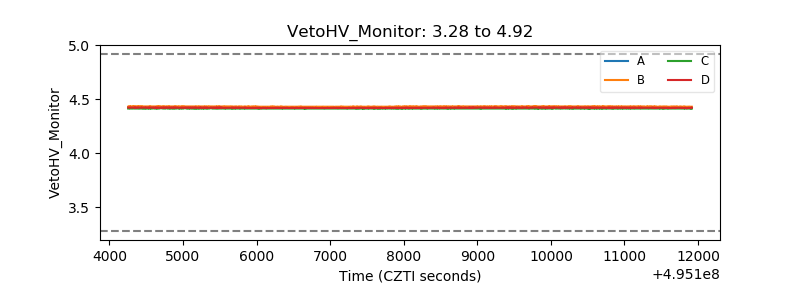 |
| Veto LLD | 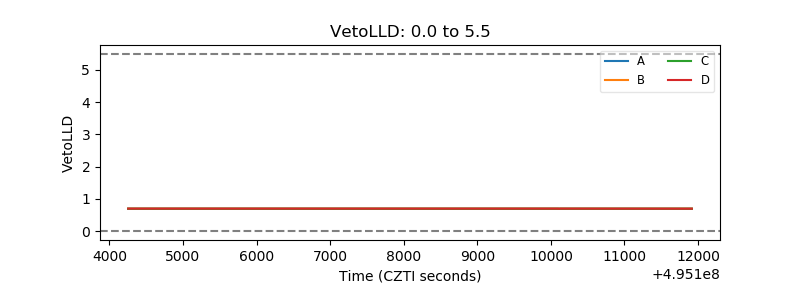 |
| Alpha Counter | 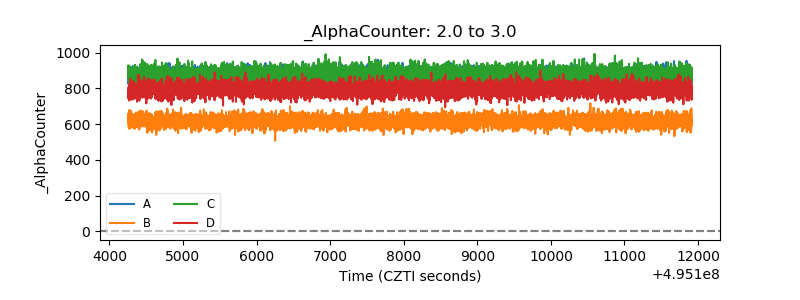 |
| _CPM_Rate | 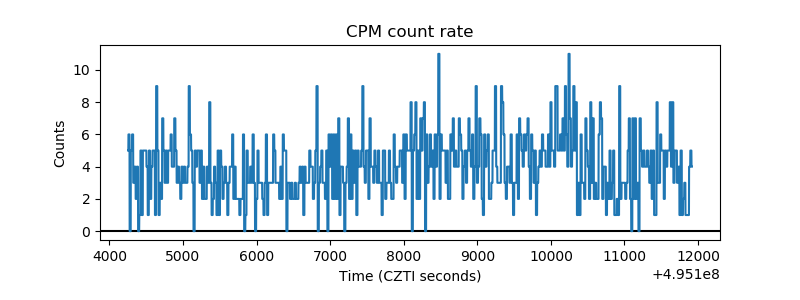 |
| CZT Counter | 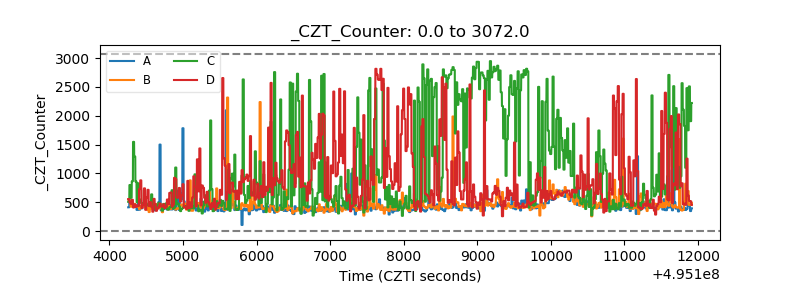 |
| +2.5 Volts monitor | 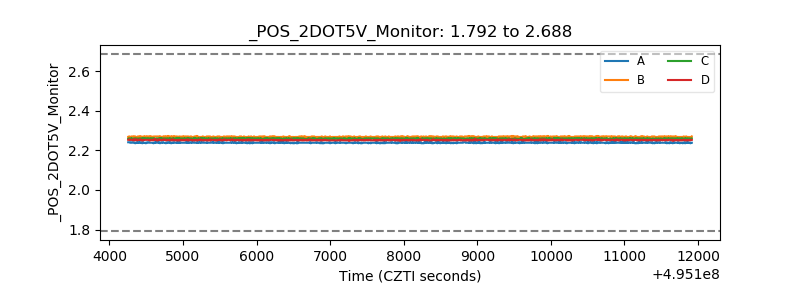 |
| +5 Volts monitor |  |
| _ROLL_ROT | 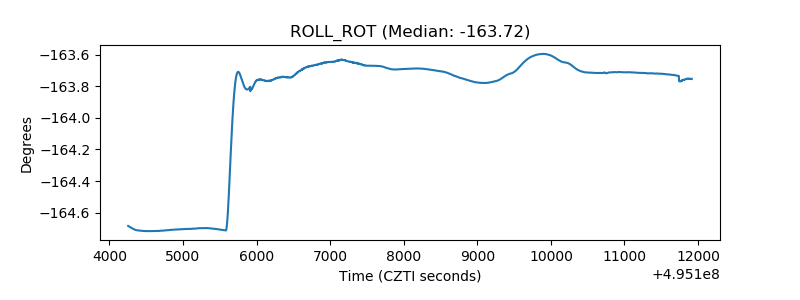 |
| _Roll_DEC | 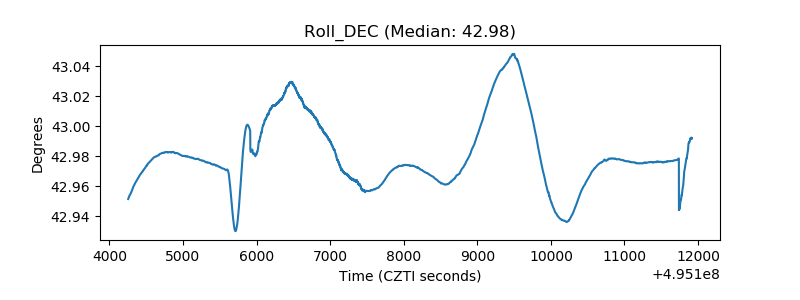 |
| _Roll_RA | 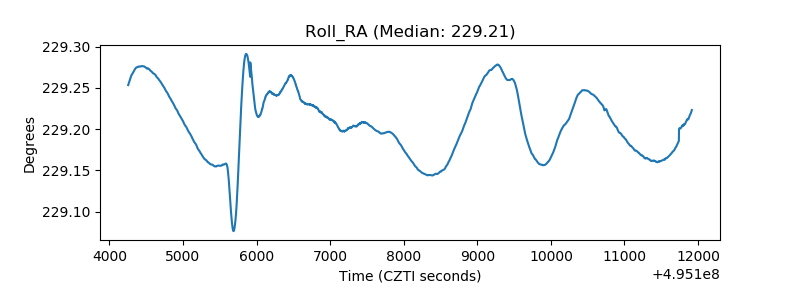 |
| Veto Counter | 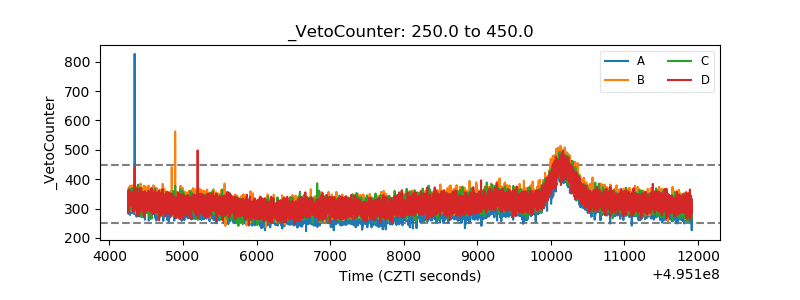 |