| Param | Original file | Final file |
|---|---|---|
| Filename | modeM0/AS1A14_022T04_9000006506_53827cztM0_level2.fits | modeM0/AS1A14_022T04_9000006506_53827cztM0_level2_quad_clean.evt |
| Size (bytes) | 216,619,200 | 37,013,760 |
| Size | 206.6 MB | 35.3 MB |
| Events in quadrant A | 1,155,436 | 253,103 |
| Events in quadrant B | 1,257,182 | 264,882 |
| Events in quadrant C | 3,346,332 | 189,615 |
| Events in quadrant D | 2,047,490 | 219,718 |
| Mode M0 | |||
|---|---|---|---|
| Quadrant | BADHDUFLAG | Total packets | Discarded packets |
| A | 0 | 5566 | 0 |
| B | 0 | 5683 | 0 |
| C | 0 | 11829 | 6 |
| D | 0 | 7942 | 0 |
| Mode SS | |||
|---|---|---|---|
| Quadrant | BADHDUFLAG | Total packets | Discarded packets |
| A | 0 | 54 | 0 |
| B | 0 | 54 | 0 |
| C | 0 | 54 | 0 |
| D | 0 | 54 | 0 |
| Quadrant | Total seconds | Saturated seconds | Saturation percentage |
|---|---|---|---|
| A | 2701 | 1 | 0.037023% |
| B | 2702 | 6 | 0.222058% |
| C | 2701 | 644 | 23.843021% |
| D | 2702 | 101 | 3.737972% |
Noise dominated data is calculated using 1-second bins in cleaned event files. If a bin has >2000 counts, and if more than 50% of those come from <1% of pixels, then it is considered to be noise-dominated and hence unusable.
| Quadrant | # 1 sec bins | Bins with >0 counts | Bins with >2000 counts | High rate bins dominated by noise | Noise dominated (total time) | Noise dominated (detector-on time) | Marked lightcurve |
|---|---|---|---|---|---|---|---|
| A | 2701 | 2701 | 2 | 2 | 0.07% | 0.07% | 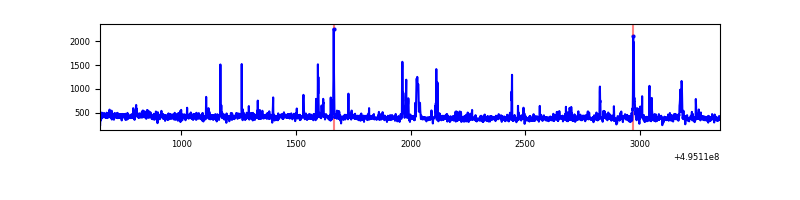 |
| B | 2702 | 2702 | 5 | 5 | 0.19% | 0.19% | 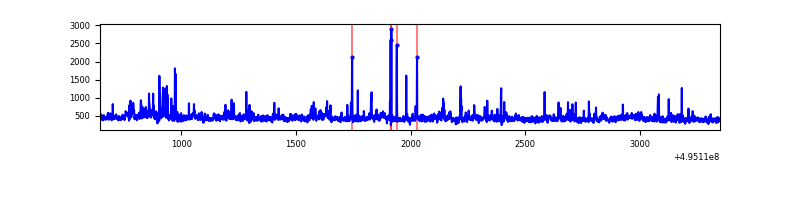 |
| C | 2702 | 2702 | 520 | 520 | 19.25% | 19.25% | 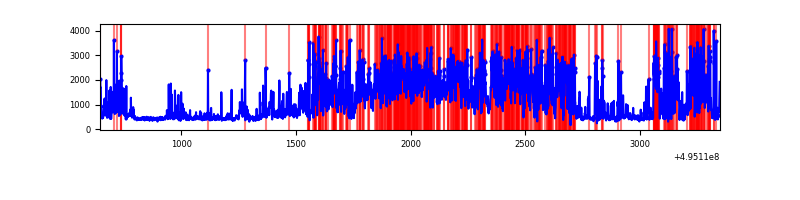 |
| D | 2702 | 2702 | 112 | 112 | 4.15% | 4.15% | 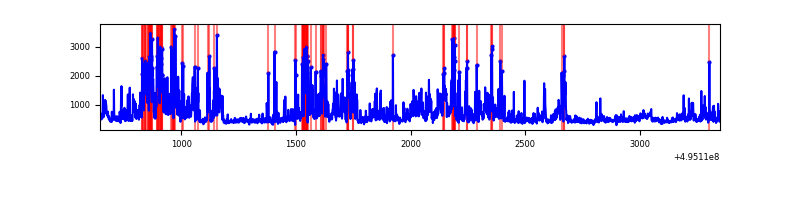 |
Top three noisy pixels from each quadrant. If the there are fewer than three noisy pixels in the level2.evt file, extra rows are filled as -1
| Pixel properties | Quadrant properties | ||||||
|---|---|---|---|---|---|---|---|
| Quadrant | DetID | PixID | Counts | Sigma | Mean | Median | Sigma |
| A | 0 | 8 | 33682 | 475.24 | 271 | 263 | 70.3 |
| A | 4 | 249 | 31368 | 442.33 | 271 | 263 | 70.3 |
| A | 3 | 79 | 9556 | 132.15 | 271 | 263 | 70.3 |
| B | 0 | 197 | 48503 | 830.14 | 264 | 256 | 58.1 |
| B | 0 | 213 | 37199 | 635.64 | 264 | 256 | 58.1 |
| B | 5 | 250 | 28091 | 478.93 | 264 | 256 | 58.1 |
| C | 15 | 224 | 958929 | 14372.75 | 236 | 233 | 66.7 |
| C | 15 | 158 | 776182 | 11633.01 | 236 | 233 | 66.7 |
| C | 5 | 10 | 180348 | 2700.28 | 236 | 233 | 66.7 |
| D | 8 | 176 | 442444 | 5963.92 | 259 | 247 | 74.1 |
| D | 15 | 93 | 138948 | 1870.66 | 259 | 247 | 74.1 |
| D | 10 | 172 | 81775 | 1099.57 | 259 | 247 | 74.1 |
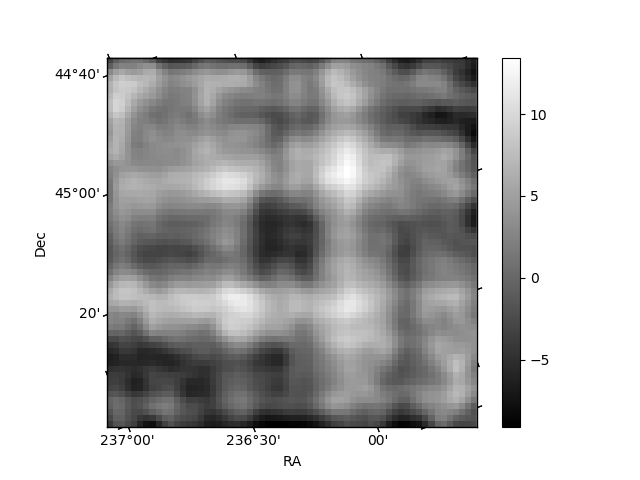
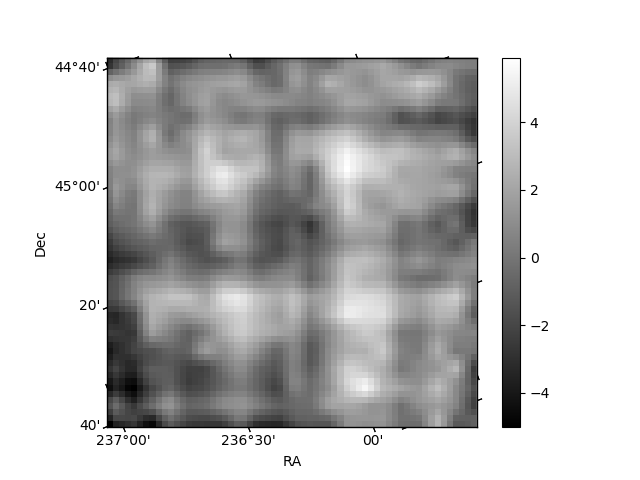
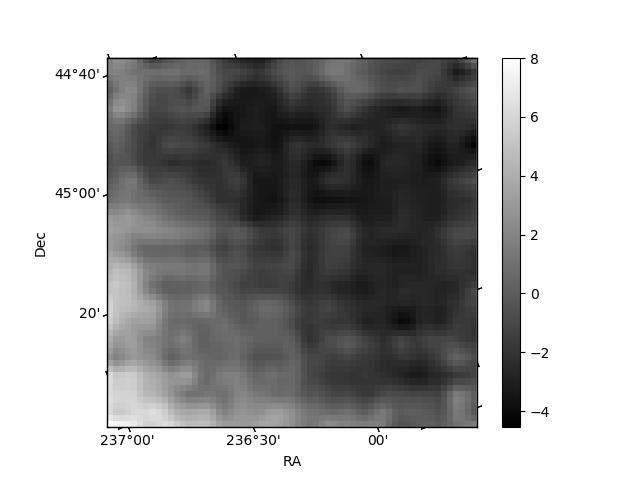
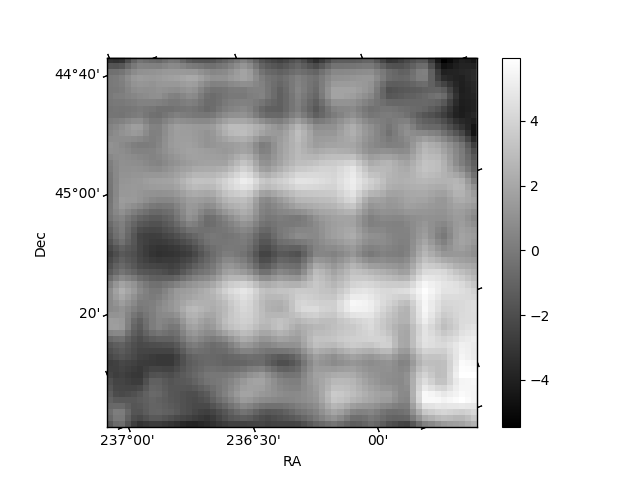
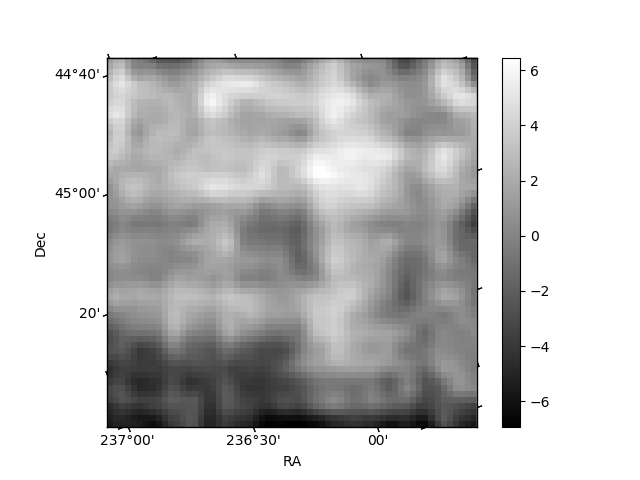
Histogram calculated using DETX and DETY for each event in the final _common_clean file
| Quadrant A | 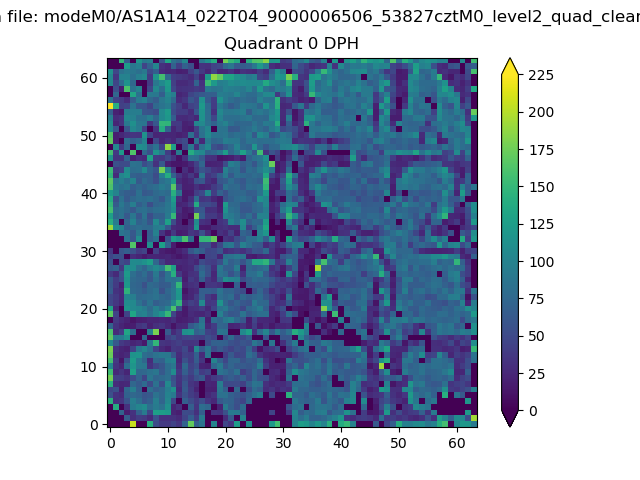 |
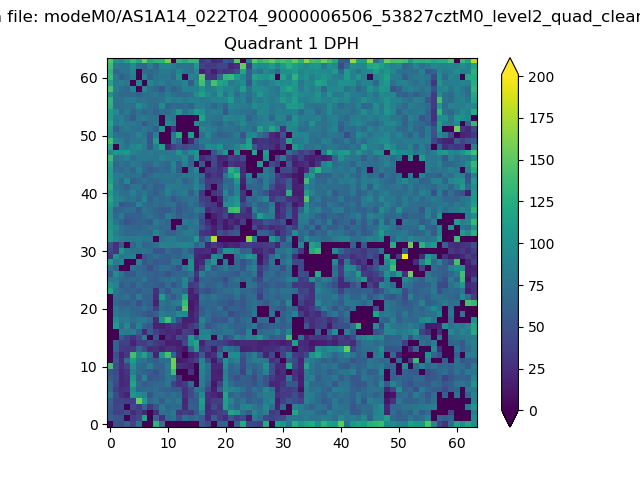 |
Quadrant B |
|---|---|---|---|
| Quadrant D | 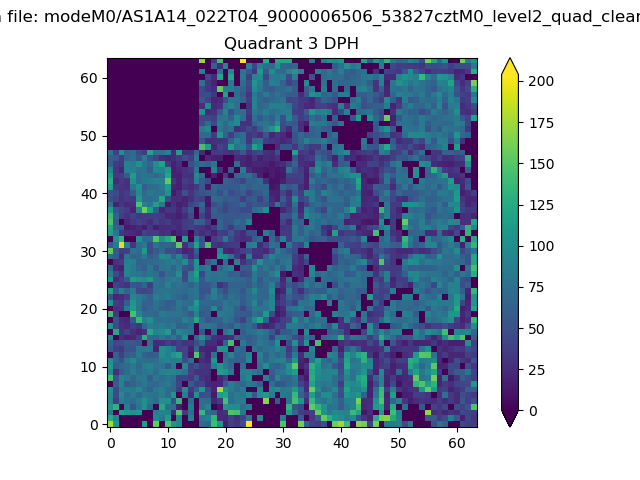 |
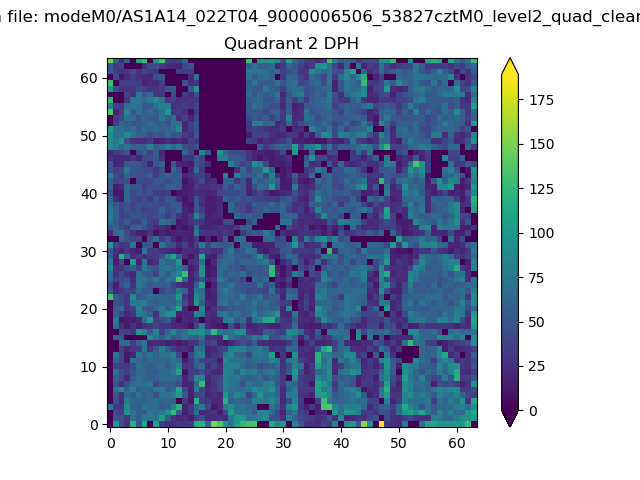 |
Quadrant C |
| Plot type | Count rate plots | Images |
|---|---|---|
| Comparison with Poisson distribution Blue bars denote a histogram of data divided into 1 sec bins. Red curve is a Poisson curve with rate = median count rate of data. |
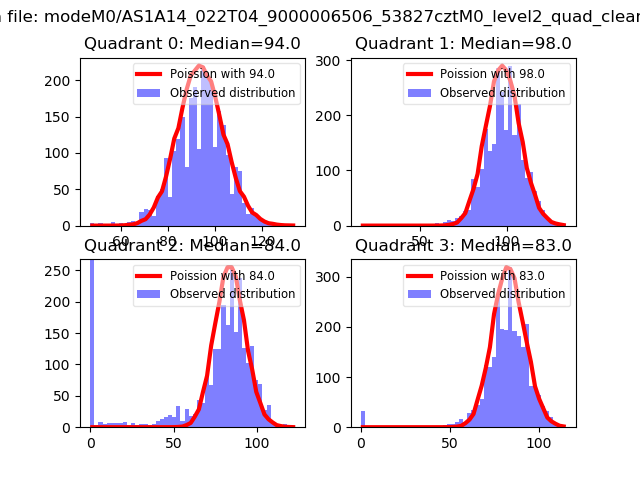 |
 |
| Quadrant-wise count rates Data is divided into 100 sec bins |
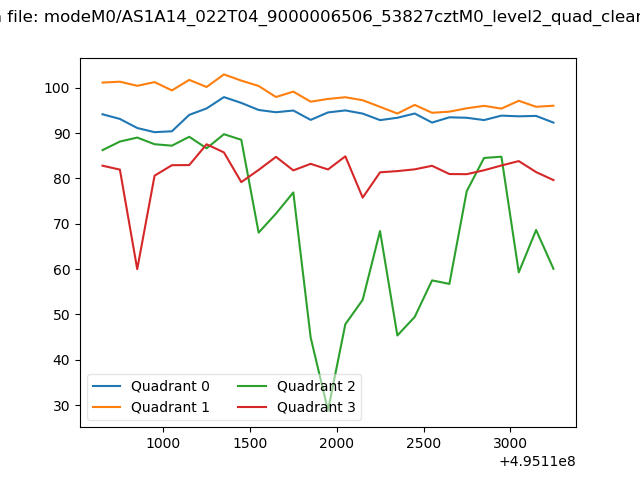 |
|
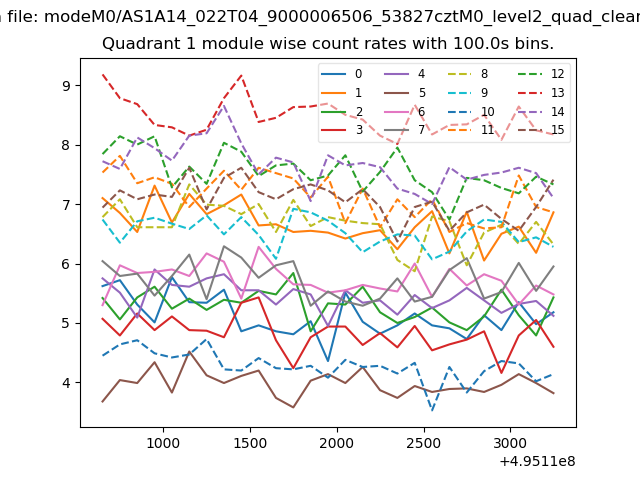
| Module-wise count rates for Quadrant A Data is divided into 100 sec bins |
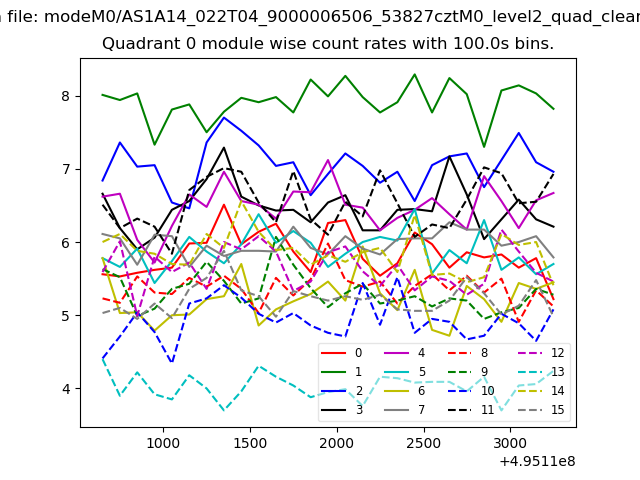 |
 |
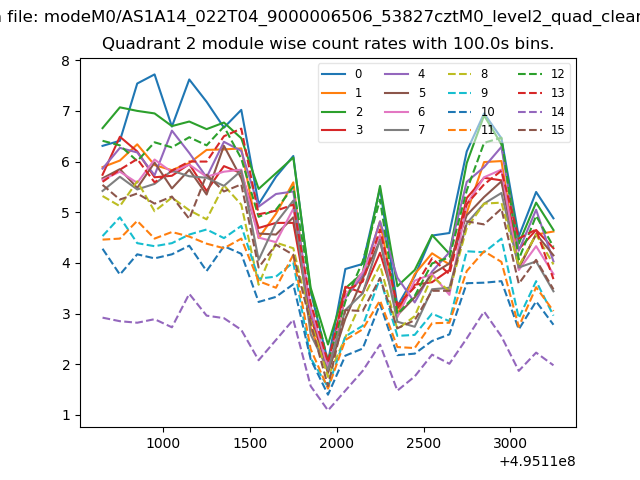
| Module-wise count rates for Quadrant B Data is divided into 100 sec bins |
 |
 |
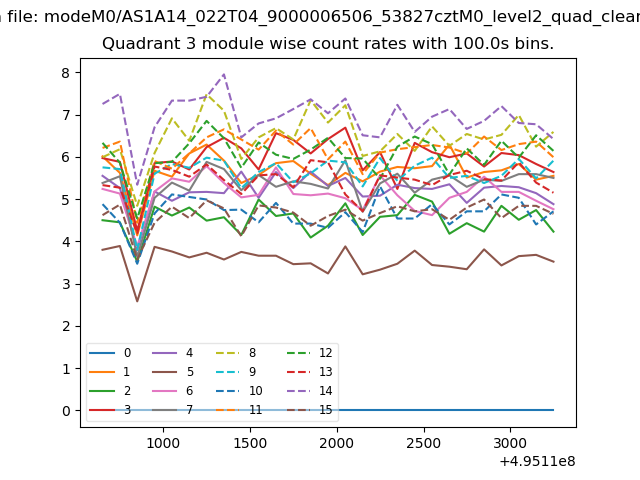
| Module-wise count rates for Quadrant C Data is divided into 100 sec bins |
 |
 |
| Module-wise count rates for Quadrant D Data is divided into 100 sec bins |
 |
 |
| Parameter | Plot |
|---|---|
| CZT HV Monitor | 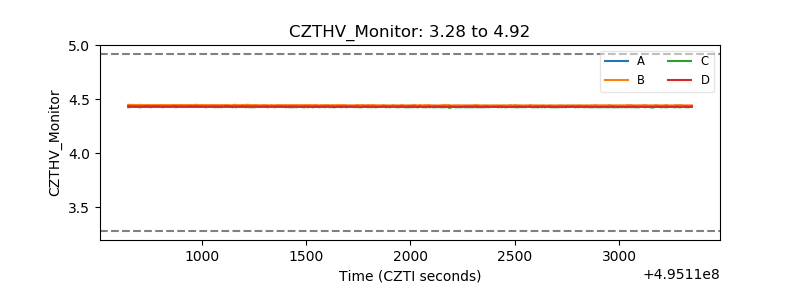 |
| D_VDD | 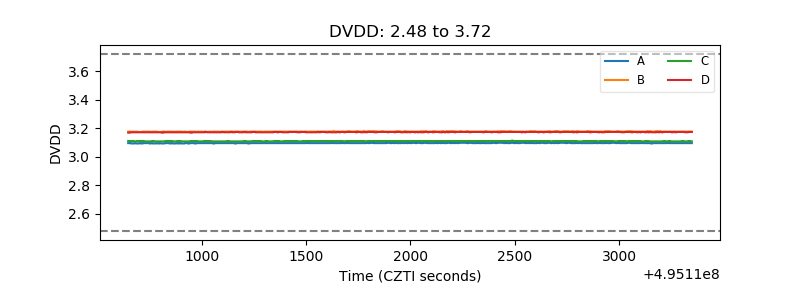 |
| Temperature 1 | 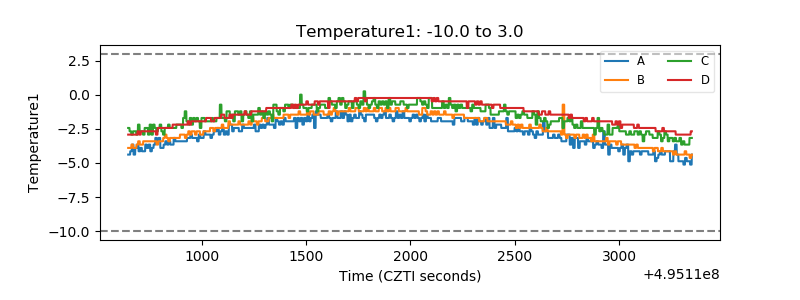 |
| Veto HV Monitor | 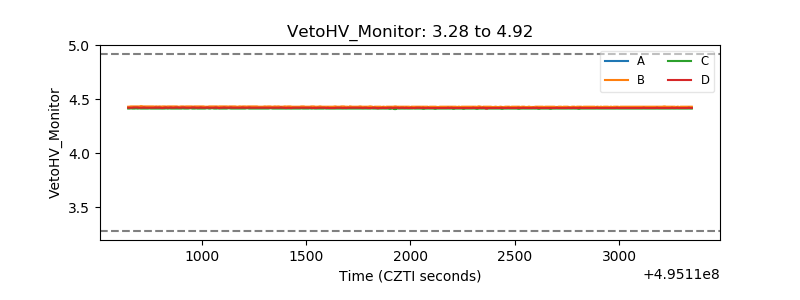 |
| Veto LLD | 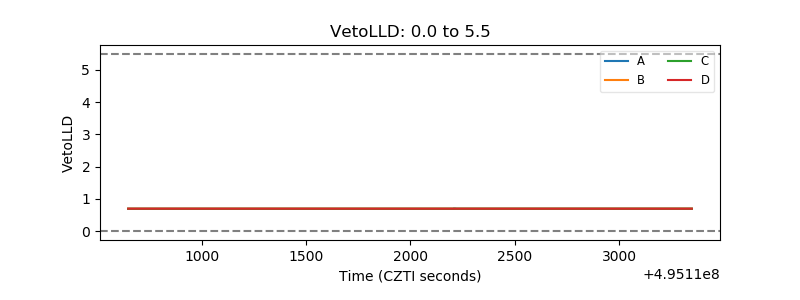 |
| Alpha Counter |  |
| _CPM_Rate | 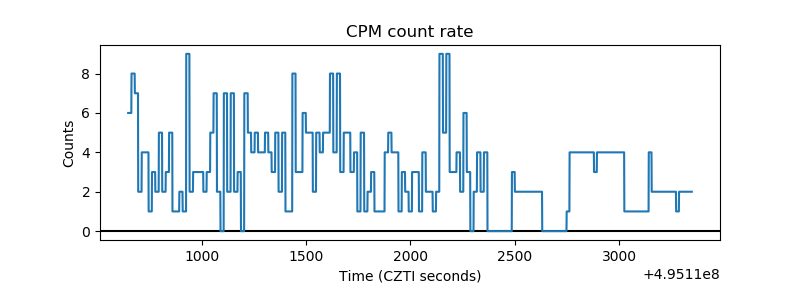 |
| CZT Counter | 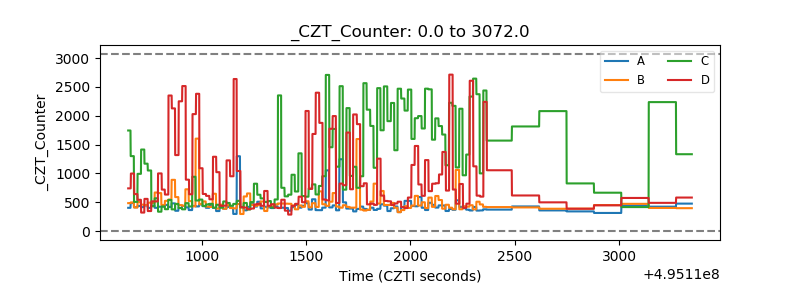 |
| +2.5 Volts monitor |  |
| +5 Volts monitor |  |
| _ROLL_ROT | 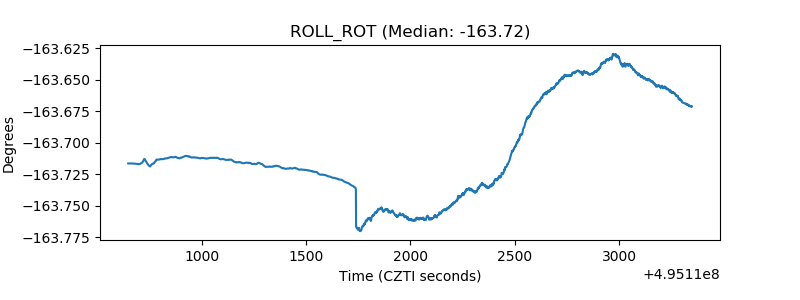 |
| _Roll_DEC | 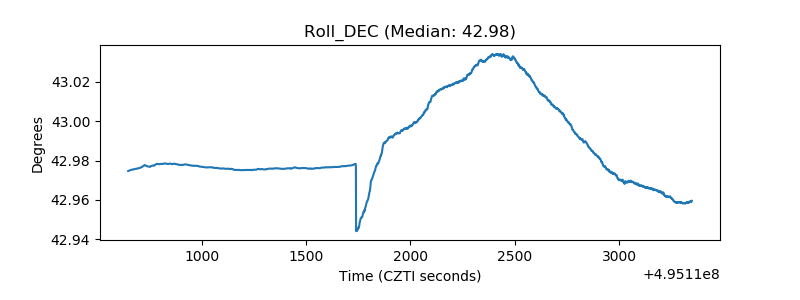 |
| _Roll_RA | 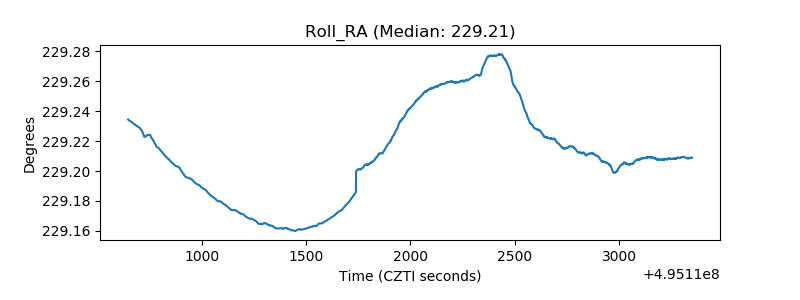 |
| Veto Counter | 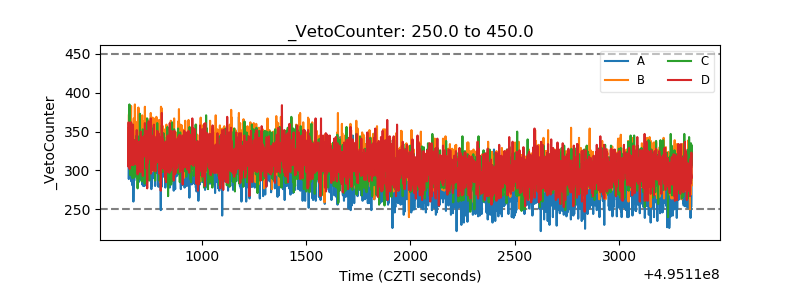 |