| Param | Original file | Final file |
|---|---|---|
| Filename | modeM0/AS1A14_022T04_9000006506_53828cztM0_level2.fits | modeM0/AS1A14_022T04_9000006506_53828cztM0_level2_quad_clean.evt |
| Size (bytes) | 1,881,984,960 | 302,469,120 |
| Size | 1.8 GB | 288.5 MB |
| Events in quadrant A | 10,642,978 | 2,096,027 |
| Events in quadrant B | 11,636,898 | 2,198,475 |
| Events in quadrant C | 27,488,825 | 1,515,859 |
| Events in quadrant D | 18,185,908 | 1,821,308 |
| Mode M0 | |||
|---|---|---|---|
| Quadrant | BADHDUFLAG | Total packets | Discarded packets |
| A | 0 | 48171 | 3 |
| B | 0 | 50710 | 3 |
| C | 0 | 96854 | 8 |
| D | 0 | 69177 | 3 |
| Mode SS | |||
|---|---|---|---|
| Quadrant | BADHDUFLAG | Total packets | Discarded packets |
| A | 0 | 450 | 0 |
| B | 0 | 450 | 0 |
| C | 0 | 450 | 0 |
| D | 0 | 450 | 0 |
| Mode M9 | |||
|---|---|---|---|
| Quadrant | BADHDUFLAG | Total packets | Discarded packets |
| A | 0 | 17 | 0 |
| B | 0 | 17 | 0 |
| C | 0 | 17 | 0 |
| D | 0 | 17 | 0 |
| Quadrant | Total seconds | Saturated seconds | Saturation percentage |
|---|---|---|---|
| A | 22159 | 274 | 1.236518% |
| B | 22160 | 480 | 2.166065% |
| C | 22159 | 4962 | 22.392707% |
| D | 22159 | 1298 | 5.857665% |
Noise dominated data is calculated using 1-second bins in cleaned event files. If a bin has >2000 counts, and if more than 50% of those come from <1% of pixels, then it is considered to be noise-dominated and hence unusable.
| Quadrant | # 1 sec bins | Bins with >0 counts | Bins with >2000 counts | High rate bins dominated by noise | Noise dominated (total time) | Noise dominated (detector-on time) | Marked lightcurve |
|---|---|---|---|---|---|---|---|
| A | 23904 | 22162 | 109 | 109 | 0.46% | 0.49% | 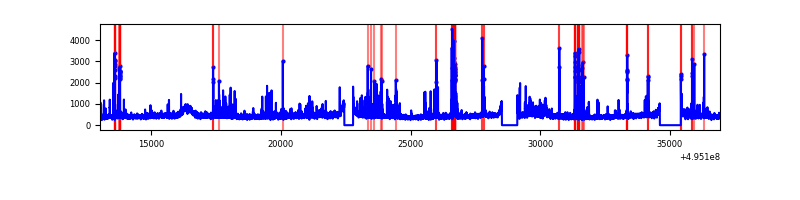 |
| B | 23905 | 22163 | 142 | 142 | 0.59% | 0.64% | 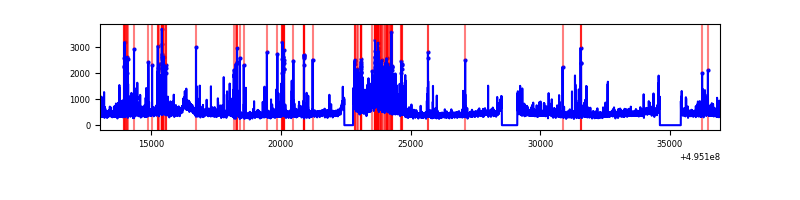 |
| C | 23903 | 22159 | 4508 | 4508 | 18.86% | 20.34% | 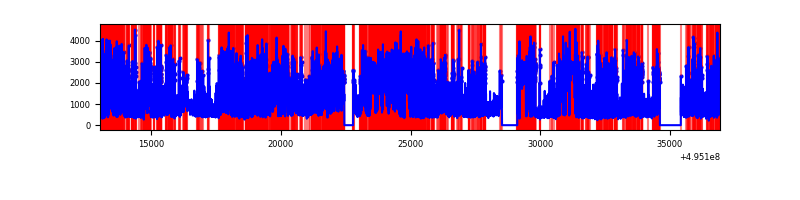 |
| D | 23904 | 22162 | 1222 | 1222 | 5.11% | 5.51% | 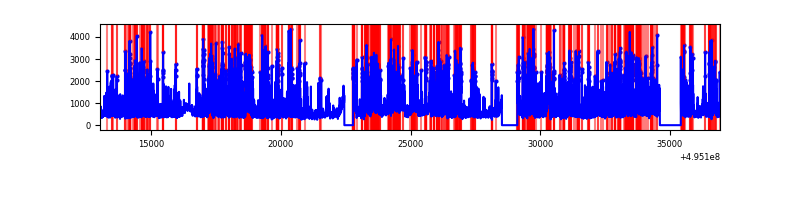 |
Top three noisy pixels from each quadrant. If the there are fewer than three noisy pixels in the level2.evt file, extra rows are filled as -1
| Pixel properties | Quadrant properties | ||||||
|---|---|---|---|---|---|---|---|
| Quadrant | DetID | PixID | Counts | Sigma | Mean | Median | Sigma |
| A | 4 | 249 | 393050 | 671.67 | 2375 | 2321 | 581.7 |
| A | 0 | 8 | 343667 | 586.78 | 2375 | 2321 | 581.7 |
| A | 8 | 6 | 295386 | 503.79 | 2375 | 2321 | 581.7 |
| B | 8 | 234 | 1082656 | 2143.91 | 2344 | 2255 | 503.9 |
| B | 5 | 185 | 234953 | 461.76 | 2344 | 2255 | 503.9 |
| B | 7 | 0 | 185534 | 363.69 | 2344 | 2255 | 503.9 |
| C | 1 | 241 | 7057646 | 12291.98 | 2084 | 2068 | 574.0 |
| C | 15 | 224 | 6111885 | 10644.31 | 2084 | 2068 | 574.0 |
| C | 15 | 157 | 2300325 | 4003.94 | 2084 | 2068 | 574.0 |
| D | 15 | 93 | 2118137 | 3292.04 | 2275 | 2174 | 642.8 |
| D | 2 | 153 | 1499684 | 2329.84 | 2275 | 2174 | 642.8 |
| D | 10 | 172 | 1160077 | 1801.48 | 2275 | 2174 | 642.8 |
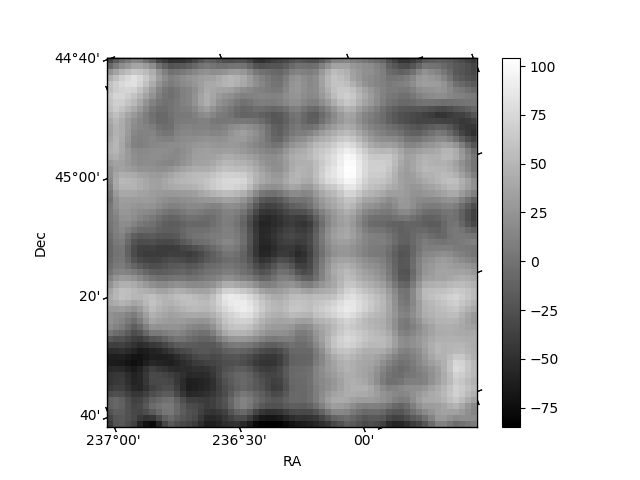
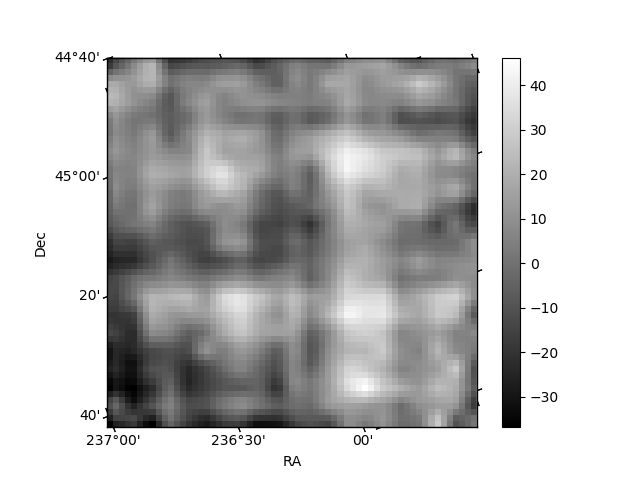
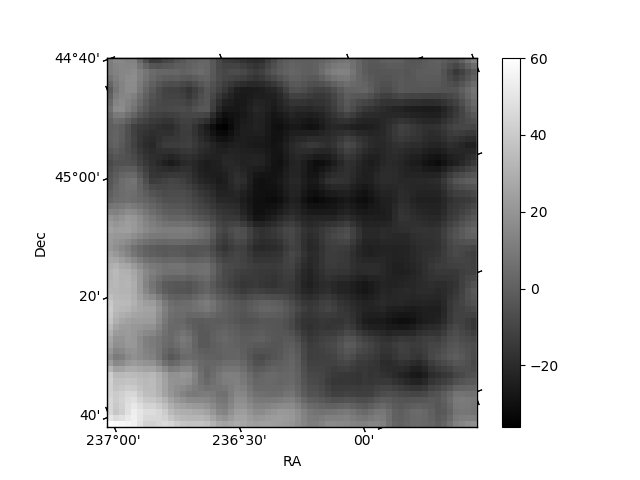
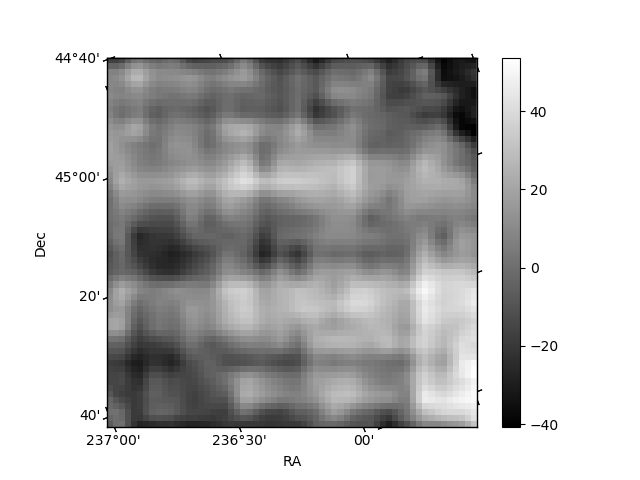
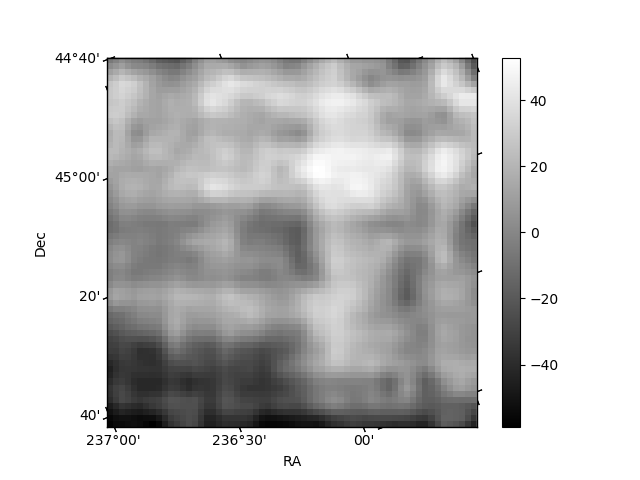
Histogram calculated using DETX and DETY for each event in the final _common_clean file
| Quadrant A | 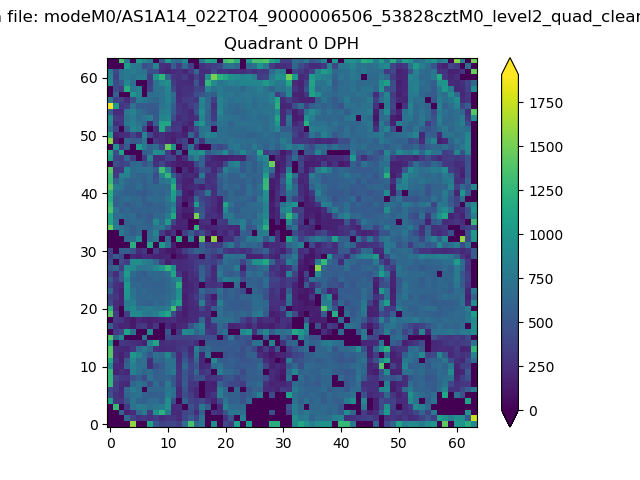 |
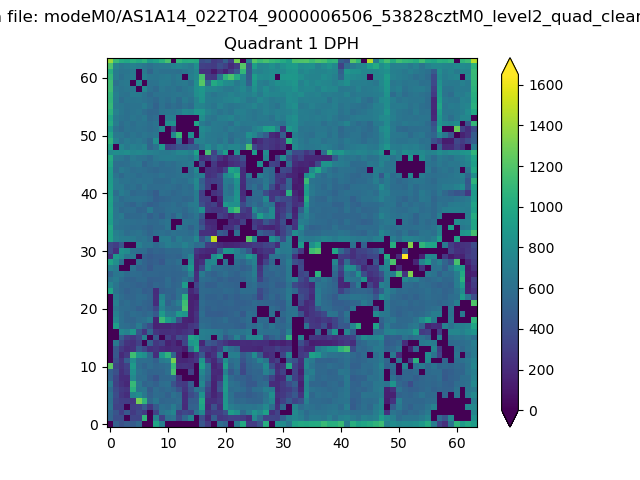 |
Quadrant B |
|---|---|---|---|
| Quadrant D | 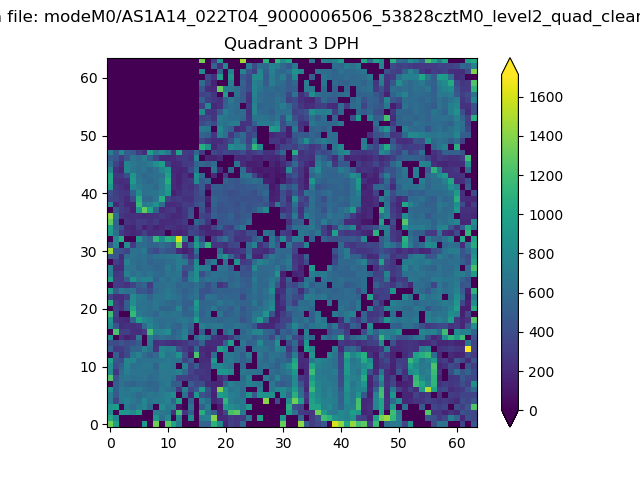 |
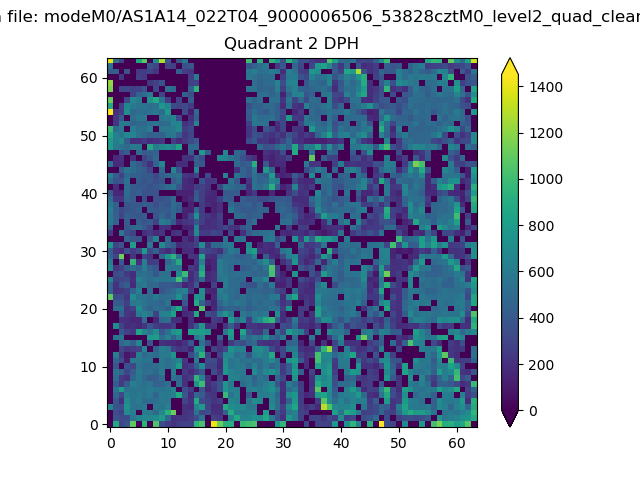 |
Quadrant C |
| Plot type | Count rate plots | Images |
|---|---|---|
| Comparison with Poisson distribution Blue bars denote a histogram of data divided into 1 sec bins. Red curve is a Poisson curve with rate = median count rate of data. |
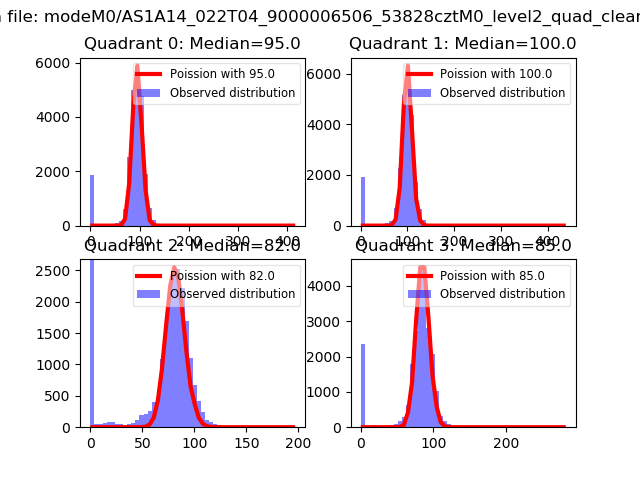 |
 |
| Quadrant-wise count rates Data is divided into 100 sec bins |
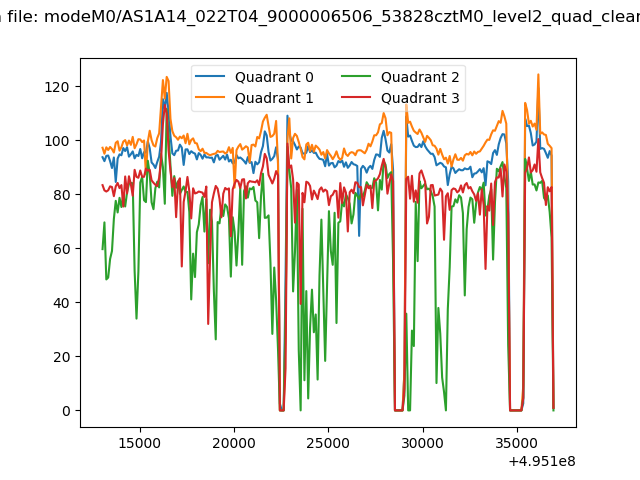 |
|
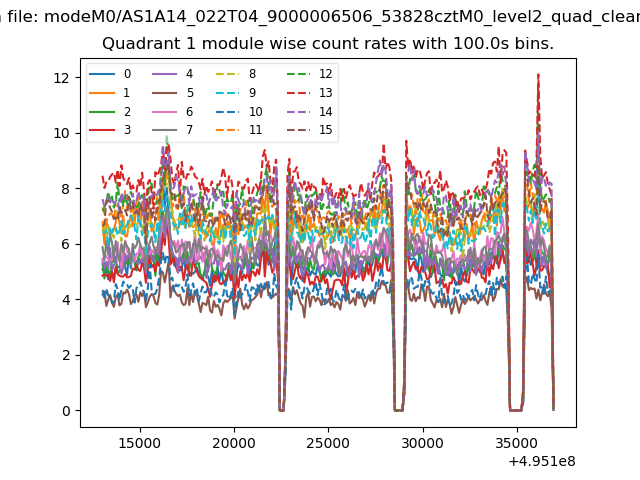
| Module-wise count rates for Quadrant A Data is divided into 100 sec bins |
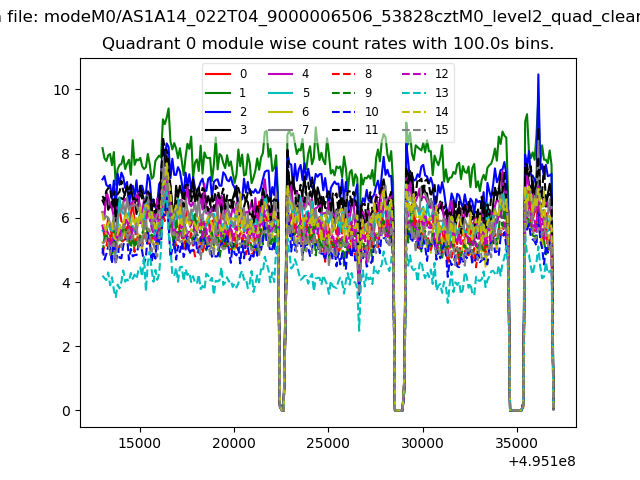 |
 |
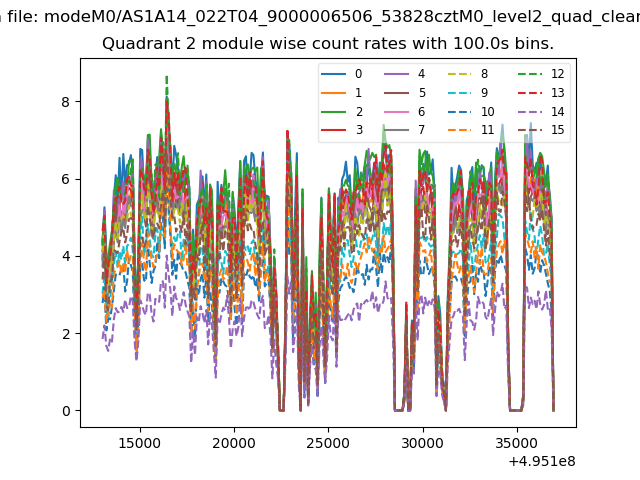
| Module-wise count rates for Quadrant B Data is divided into 100 sec bins |
 |
 |
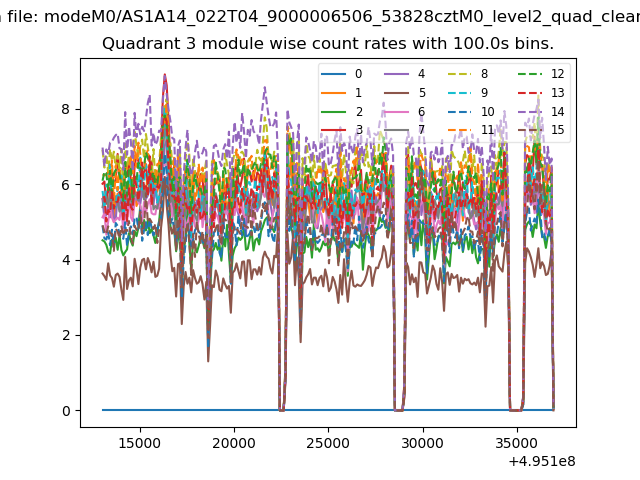
| Module-wise count rates for Quadrant C Data is divided into 100 sec bins |
 |
 |
| Module-wise count rates for Quadrant D Data is divided into 100 sec bins |
 |
 |
| Parameter | Plot |
|---|---|
| CZT HV Monitor | 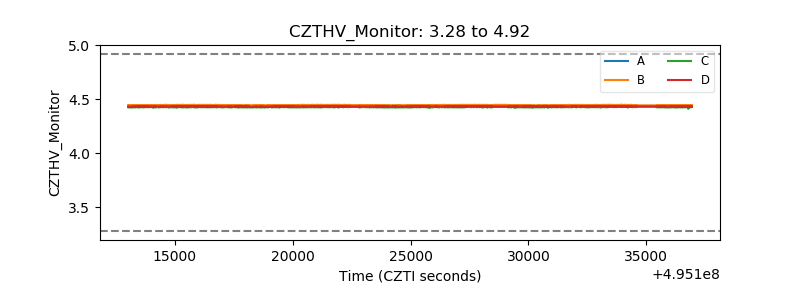 |
| D_VDD | 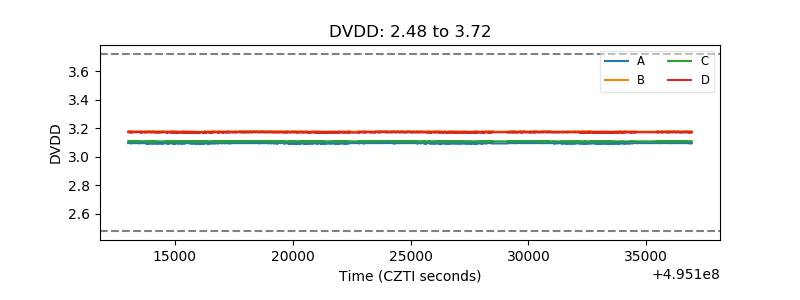 |
| Temperature 1 | 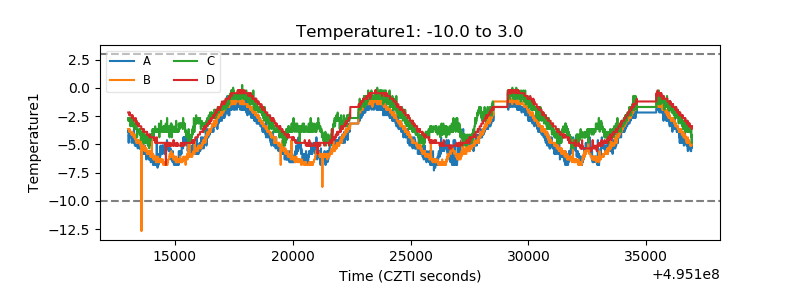 |
| Veto HV Monitor | 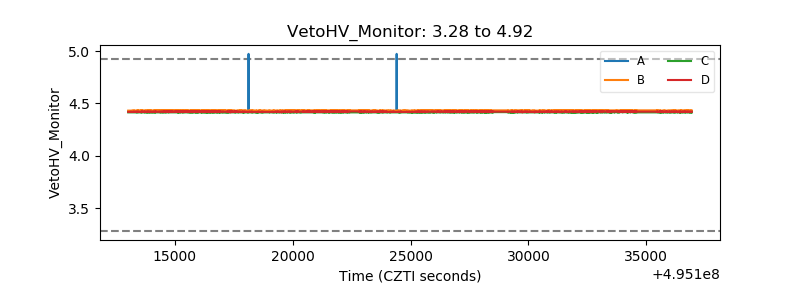 |
| Veto LLD | 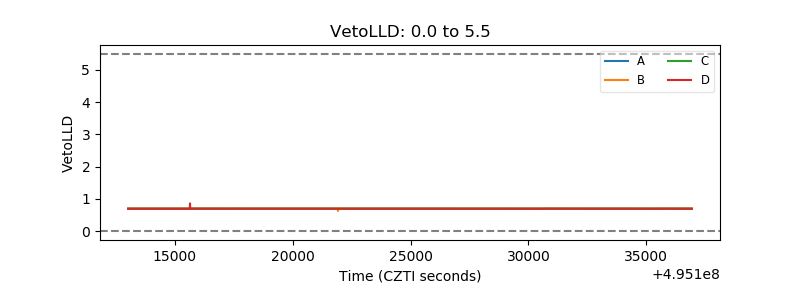 |
| Alpha Counter | 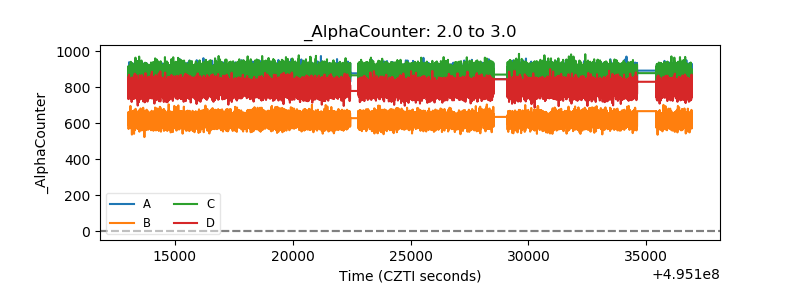 |
| _CPM_Rate | 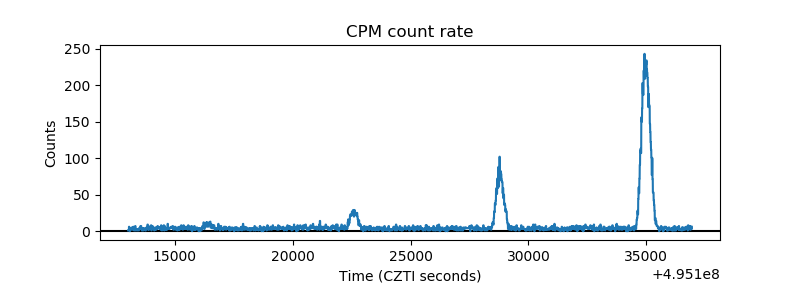 |
| CZT Counter | 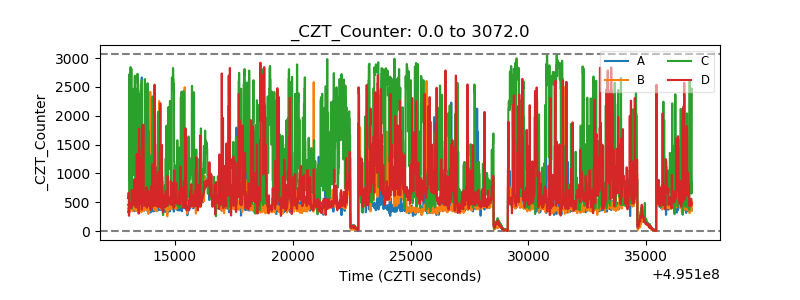 |
| +2.5 Volts monitor |  |
| +5 Volts monitor |  |
| _ROLL_ROT | 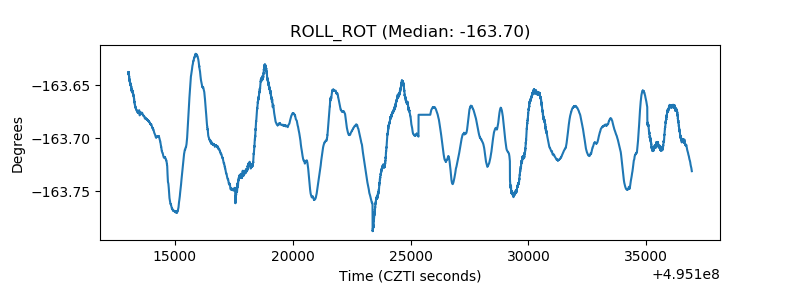 |
| _Roll_DEC | 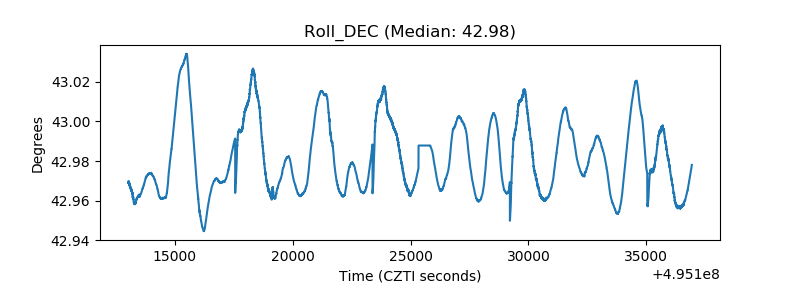 |
| _Roll_RA | 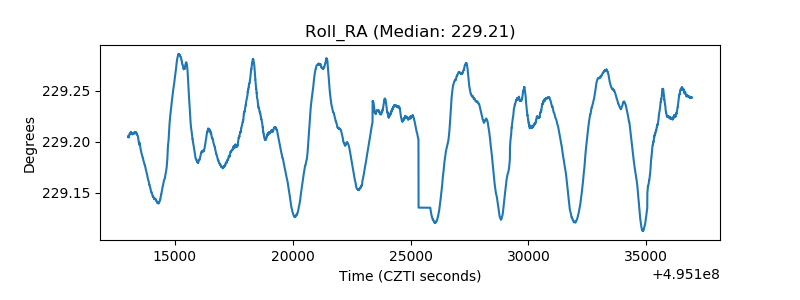 |
| Veto Counter | 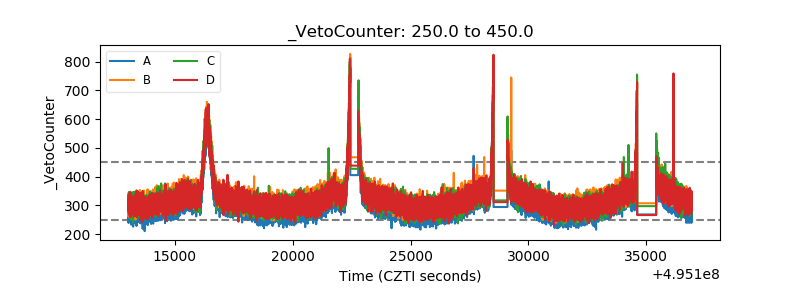 |