| Param | Original file | Final file |
|---|---|---|
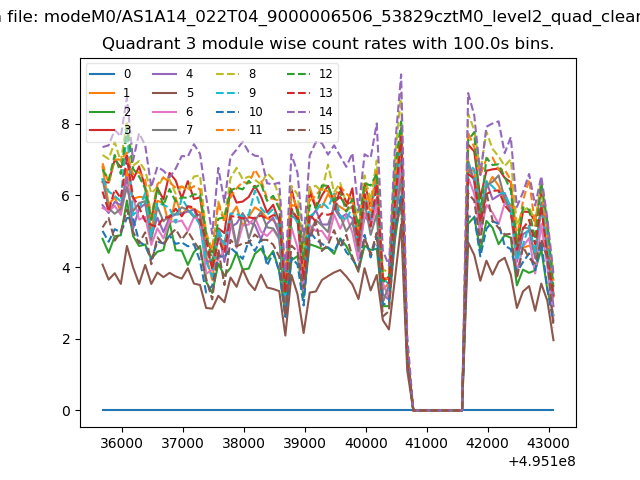
| Filename | modeM0/AS1A14_022T04_9000006506_53829cztM0_level2.fits | modeM0/AS1A14_022T04_9000006506_53829cztM0_level2_quad_clean.evt |
| Size (bytes) | 571,800,960 | 88,274,880 |
| Size | 545.3 MB | 84.2 MB |
| Events in quadrant A | 2,959,077 | 618,697 |
| Events in quadrant B | 3,111,258 | 658,188 |
| Events in quadrant C | 8,328,316 | 424,161 |
| Events in quadrant D | 6,263,919 | 518,549 |
| Mode M0 | |||
|---|---|---|---|
| Quadrant | BADHDUFLAG | Total packets | Discarded packets |
| A | 0 | 13773 | 1 |
| B | 0 | 13915 | 1 |
| C | 0 | 29230 | 1 |
| D | 0 | 23099 | 1 |
| Mode SS | |||
|---|---|---|---|
| Quadrant | BADHDUFLAG | Total packets | Discarded packets |
| A | 0 | 134 | 0 |
| B | 0 | 134 | 0 |
| C | 0 | 134 | 0 |
| D | 0 | 134 | 0 |
| Mode M9 | |||
|---|---|---|---|
| Quadrant | BADHDUFLAG | Total packets | Discarded packets |
| A | 0 | 9 | 0 |
| B | 0 | 9 | 0 |
| C | 0 | 9 | 0 |
| D | 0 | 9 | 0 |
| Quadrant | Total seconds | Saturated seconds | Saturation percentage |
|---|---|---|---|
| A | 6488 | 57 | 0.878545% |
| B | 6488 | 27 | 0.416153% |
| C | 6488 | 1898 | 29.254007% |
| D | 6488 | 630 | 9.710234% |
Noise dominated data is calculated using 1-second bins in cleaned event files. If a bin has >2000 counts, and if more than 50% of those come from <1% of pixels, then it is considered to be noise-dominated and hence unusable.
| Quadrant | # 1 sec bins | Bins with >0 counts | Bins with >2000 counts | High rate bins dominated by noise | Noise dominated (total time) | Noise dominated (detector-on time) | Marked lightcurve |
|---|---|---|---|---|---|---|---|
| A | 7458 | 6489 | 36 | 36 | 0.48% | 0.55% | 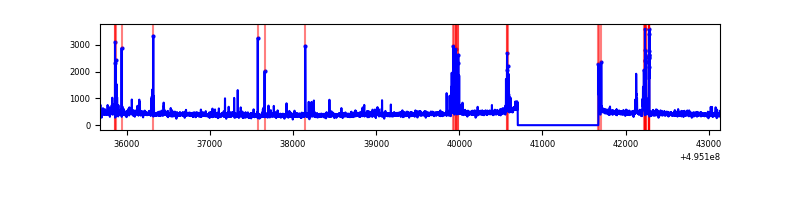 |
| B | 7458 | 6489 | 15 | 15 | 0.20% | 0.23% | 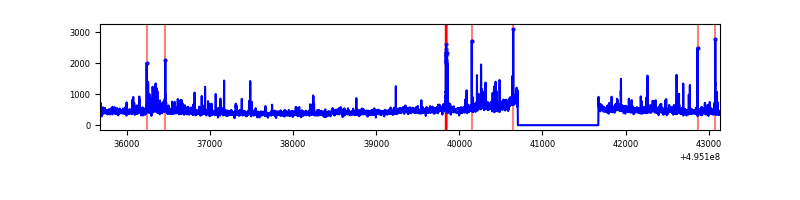 |
| C | 7458 | 6489 | 1820 | 1820 | 24.40% | 28.05% | 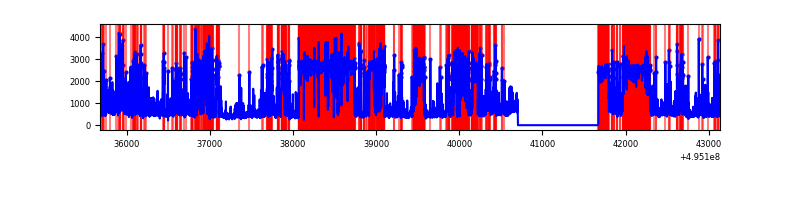 |
| D | 7458 | 6488 | 653 | 653 | 8.76% | 10.06% | 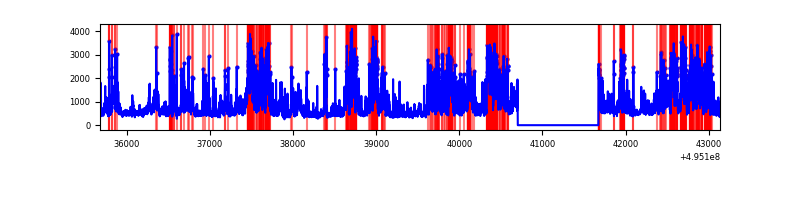 |
Top three noisy pixels from each quadrant. If the there are fewer than three noisy pixels in the level2.evt file, extra rows are filled as -1
| Pixel properties | Quadrant properties | ||||||
|---|---|---|---|---|---|---|---|
| Quadrant | DetID | PixID | Counts | Sigma | Mean | Median | Sigma |
| A | 0 | 8 | 136284 | 805.92 | 677 | 659 | 168.3 |
| A | 4 | 249 | 93866 | 553.86 | 677 | 659 | 168.3 |
| A | 13 | 254 | 15389 | 87.53 | 677 | 659 | 168.3 |
| B | 7 | 0 | 132493 | 916.02 | 673 | 650 | 143.9 |
| B | 8 | 234 | 69155 | 475.96 | 673 | 650 | 143.9 |
| B | 0 | 213 | 48682 | 333.72 | 673 | 650 | 143.9 |
| C | 1 | 241 | 4152519 | 26567.02 | 564 | 559 | 156.3 |
| C | 15 | 224 | 1535747 | 9823.16 | 564 | 559 | 156.3 |
| C | 12 | 2 | 124437 | 792.65 | 564 | 559 | 156.3 |
| D | 15 | 93 | 2482155 | 13639.84 | 639 | 612 | 181.9 |
| D | 10 | 172 | 353871 | 1941.69 | 639 | 612 | 181.9 |
| D | 2 | 120 | 135791 | 743.01 | 639 | 612 | 181.9 |
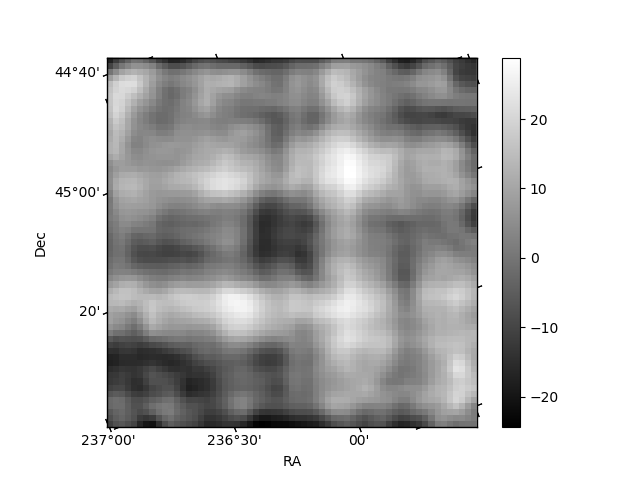
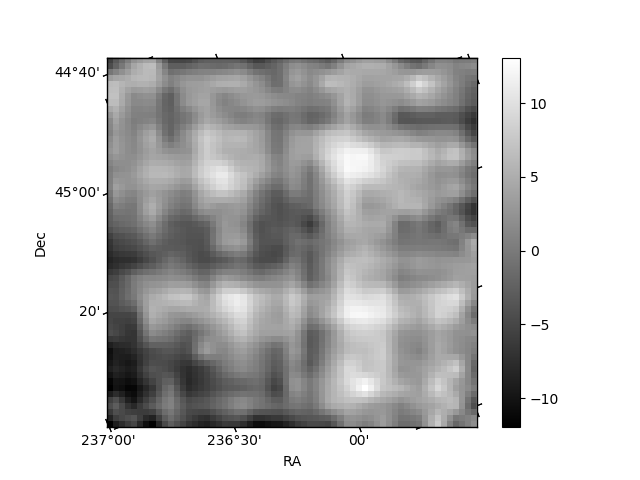
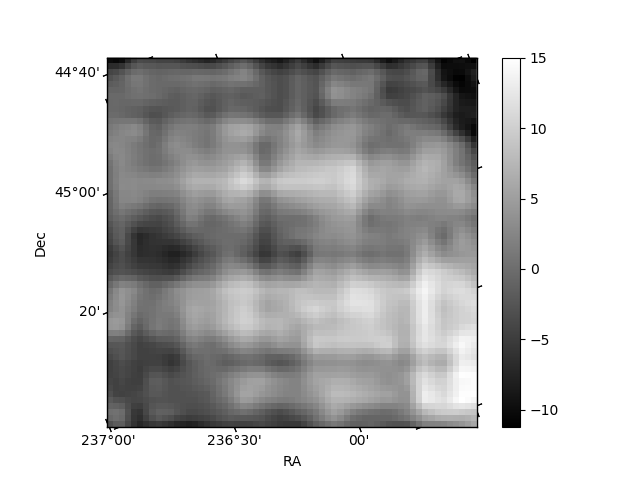
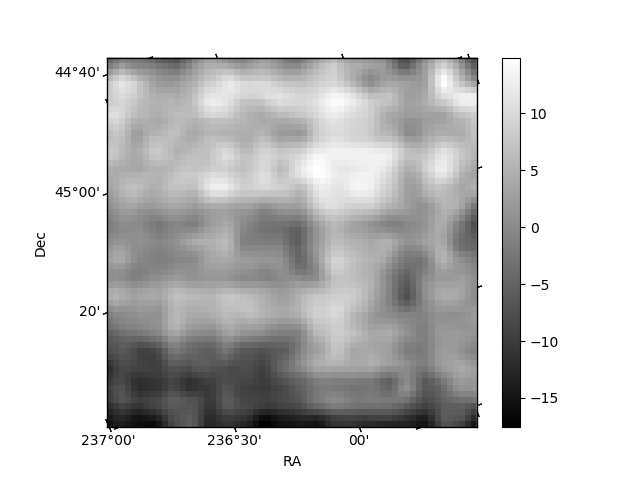
Histogram calculated using DETX and DETY for each event in the final _common_clean file
| Quadrant A | 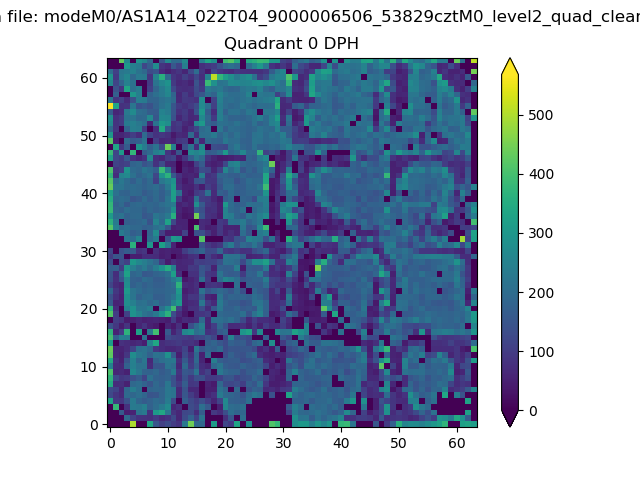 |
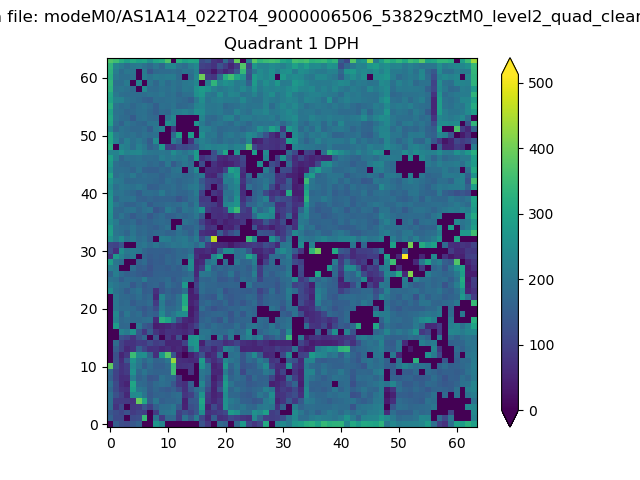 |
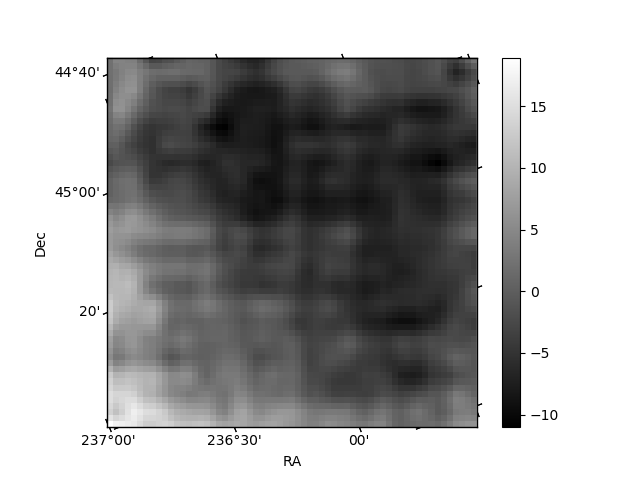
Quadrant B |
|---|---|---|---|
| Quadrant D | 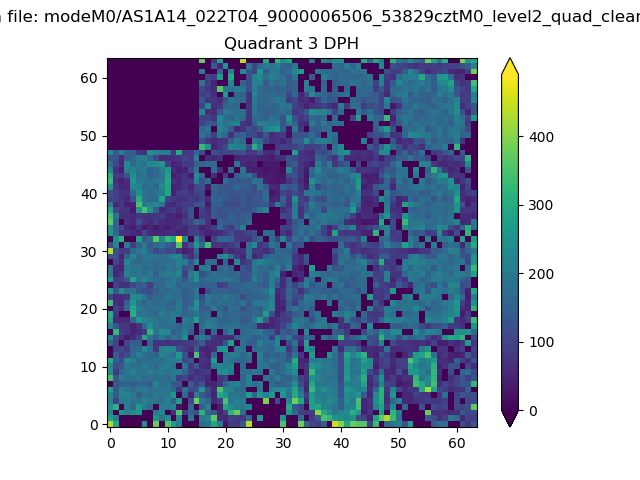 |
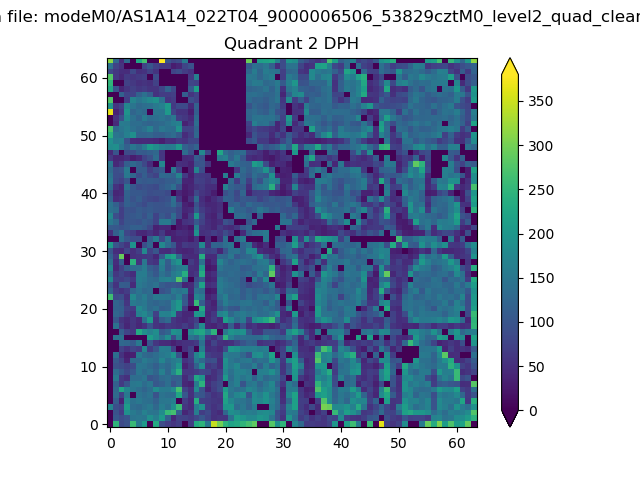 |
Quadrant C |
| Plot type | Count rate plots | Images |
|---|---|---|
| Comparison with Poisson distribution Blue bars denote a histogram of data divided into 1 sec bins. Red curve is a Poisson curve with rate = median count rate of data. |
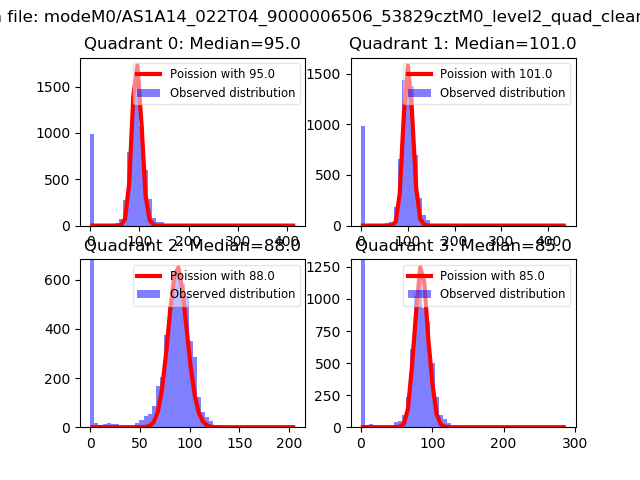 |
 |
| Quadrant-wise count rates Data is divided into 100 sec bins |
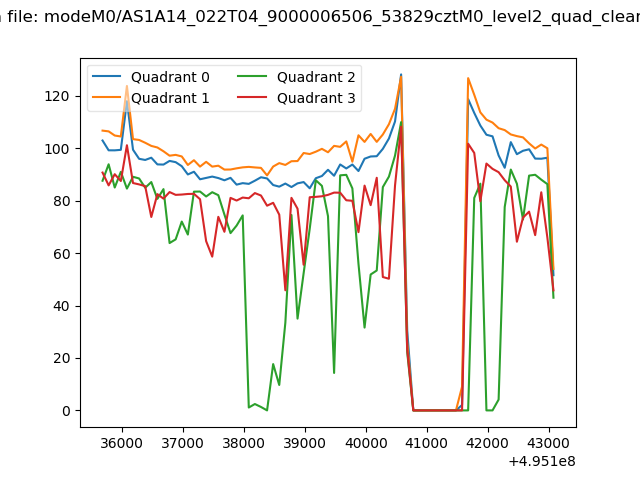 |
|
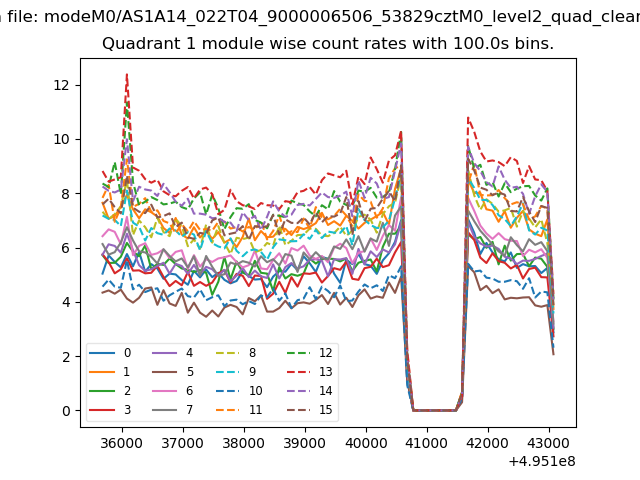
| Module-wise count rates for Quadrant A Data is divided into 100 sec bins |
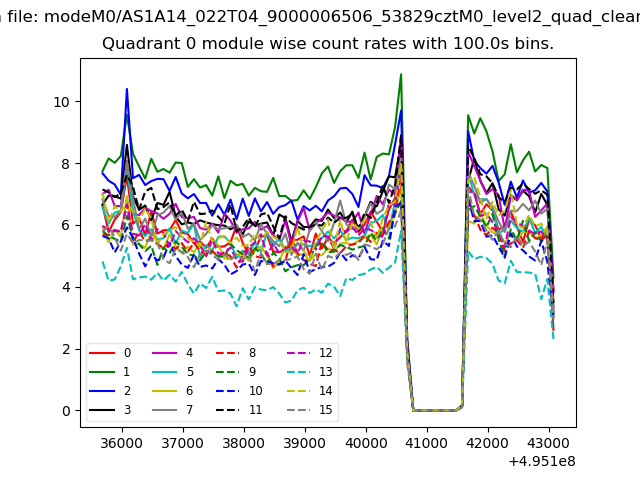 |
 |
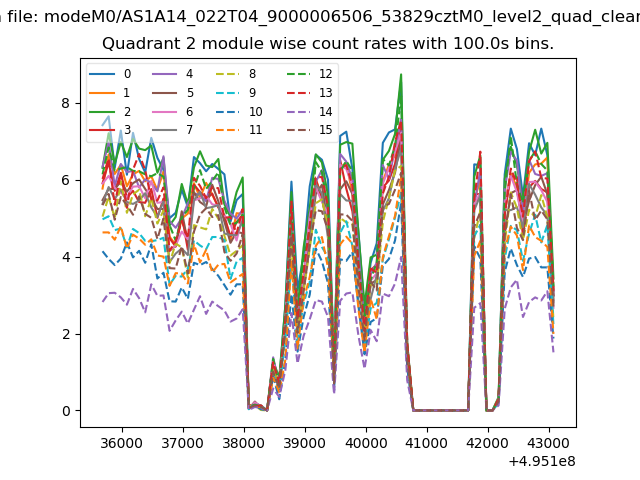
| Module-wise count rates for Quadrant B Data is divided into 100 sec bins |
 |
 |
| Module-wise count rates for Quadrant C Data is divided into 100 sec bins |
 |
 |
| Module-wise count rates for Quadrant D Data is divided into 100 sec bins |
 |
 |
| Parameter | Plot |
|---|---|
| CZT HV Monitor | 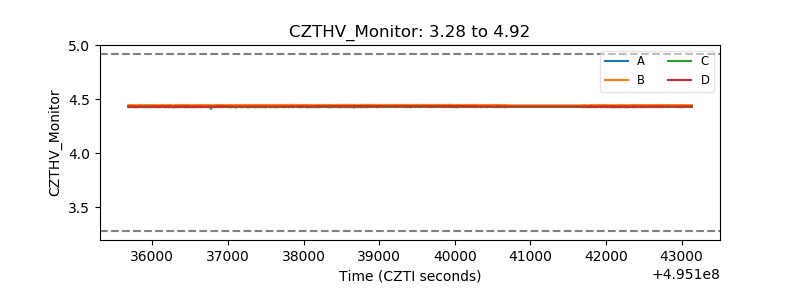 |
| D_VDD | 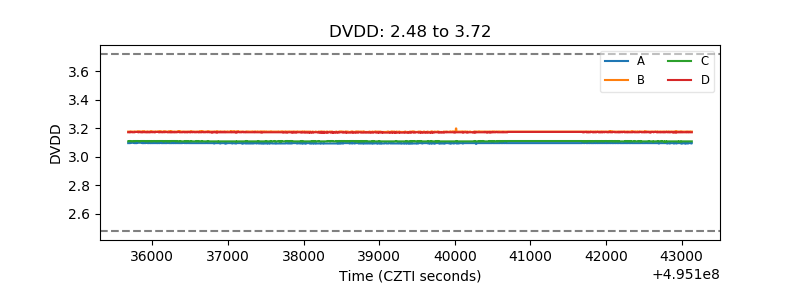 |
| Temperature 1 | 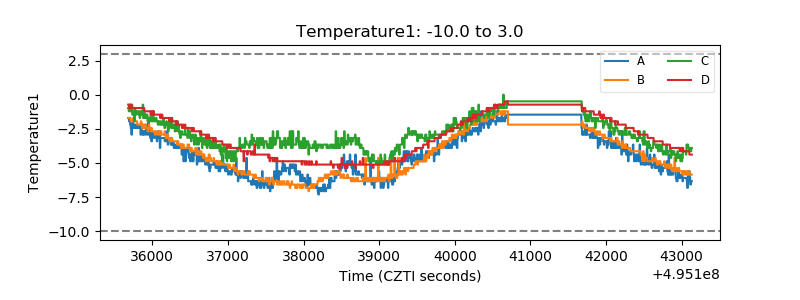 |
| Veto HV Monitor | 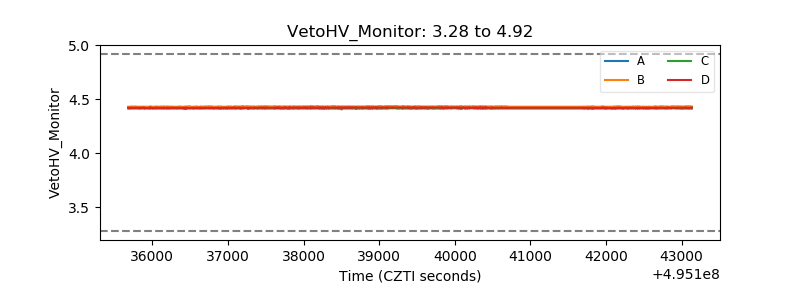 |
| Veto LLD | 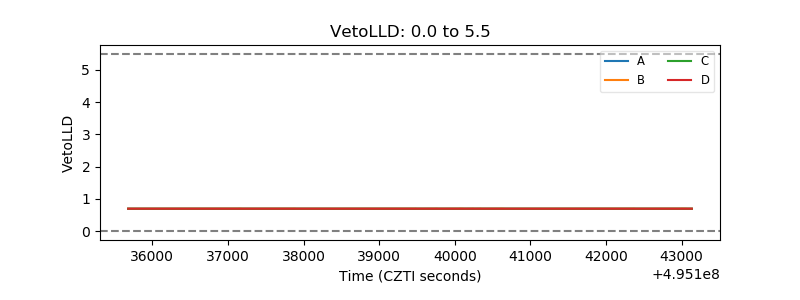 |
| Alpha Counter | 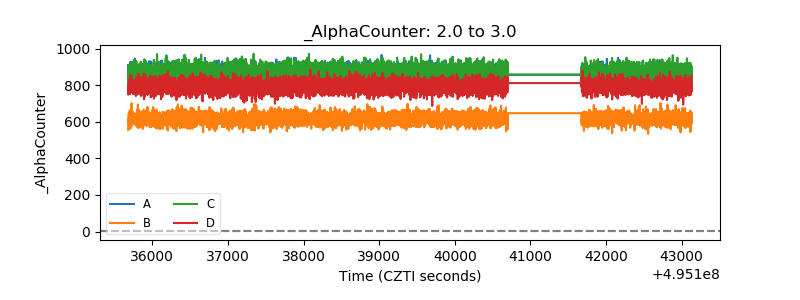 |
| _CPM_Rate | 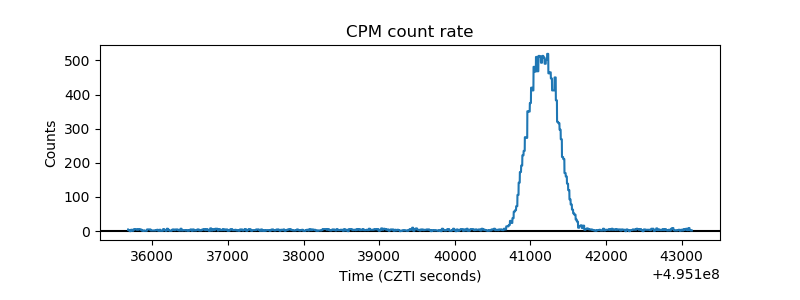 |
| CZT Counter | 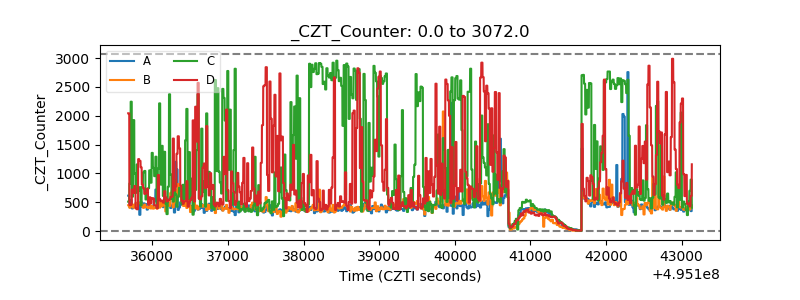 |
| +2.5 Volts monitor | 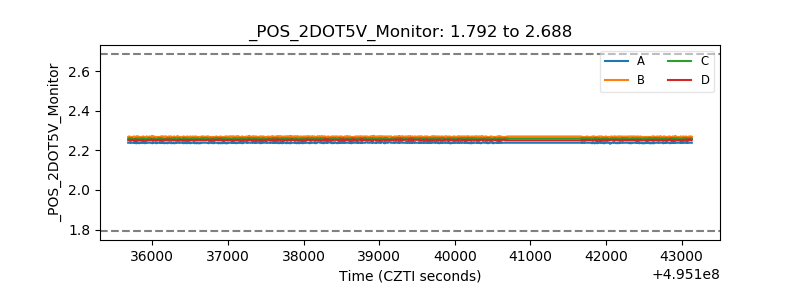 |
| +5 Volts monitor | 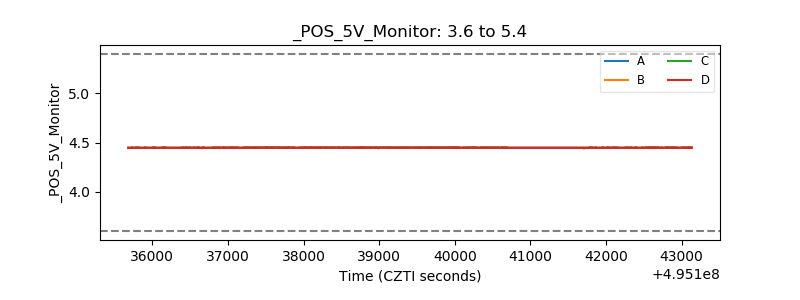 |
| _ROLL_ROT | 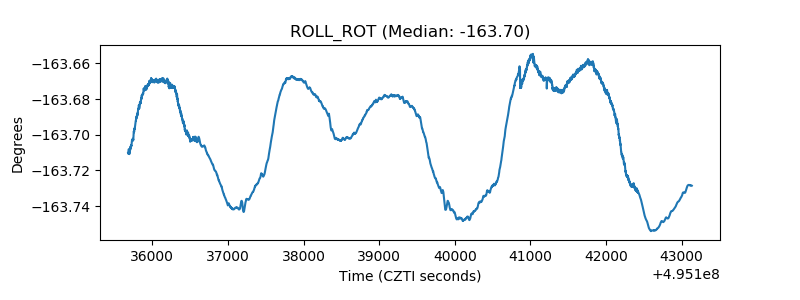 |
| _Roll_DEC | 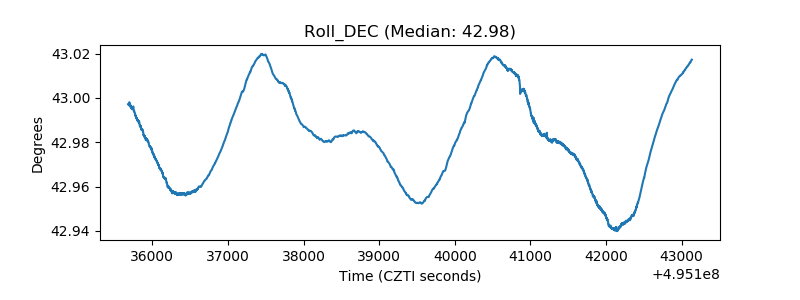 |
| _Roll_RA | 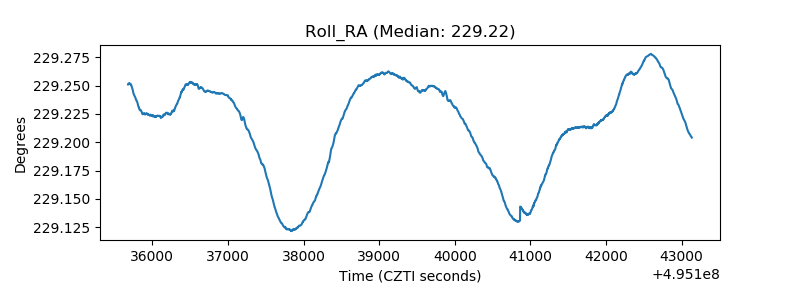 |
| Veto Counter | 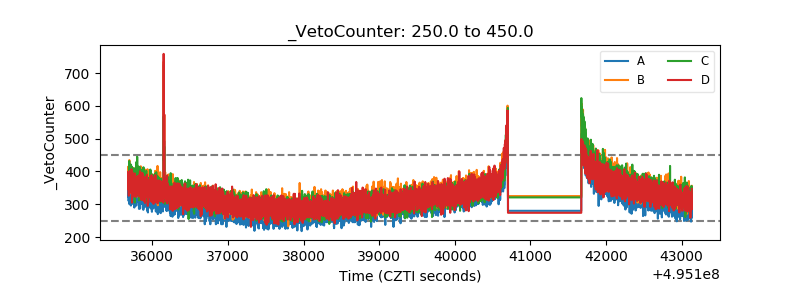 |