| Param | Original file | Final file |
|---|---|---|
| Filename | modeM0/AS1A14_022T04_9000006506_53831cztM0_level2.fits | modeM0/AS1A14_022T04_9000006506_53831cztM0_level2_quad_clean.evt |
| Size (bytes) | 599,417,280 | 88,954,560 |
| Size | 571.6 MB | 84.8 MB |
| Events in quadrant A | 2,919,958 | 638,234 |
| Events in quadrant B | 3,071,103 | 678,038 |
| Events in quadrant C | 8,475,113 | 412,054 |
| Events in quadrant D | 7,214,011 | 508,451 |
| Mode M0 | |||
|---|---|---|---|
| Quadrant | BADHDUFLAG | Total packets | Discarded packets |
| A | 0 | 13620 | 2 |
| B | 0 | 13849 | 2 |
| C | 0 | 29744 | 2 |
| D | 0 | 26032 | 8 |
| Mode SS | |||
|---|---|---|---|
| Quadrant | BADHDUFLAG | Total packets | Discarded packets |
| A | 0 | 132 | 0 |
| B | 0 | 132 | 0 |
| C | 0 | 132 | 0 |
| D | 0 | 132 | 0 |
| Mode M9 | |||
|---|---|---|---|
| Quadrant | BADHDUFLAG | Total packets | Discarded packets |
| A | 0 | 12 | 0 |
| B | 0 | 13 | 0 |
| C | 0 | 13 | 0 |
| D | 0 | 13 | 0 |
| Quadrant | Total seconds | Saturated seconds | Saturation percentage |
|---|---|---|---|
| A | 6547 | 42 | 0.641515% |
| B | 6547 | 56 | 0.855354% |
| C | 6547 | 2092 | 31.953567% |
| D | 6546 | 945 | 14.436297% |
Noise dominated data is calculated using 1-second bins in cleaned event files. If a bin has >2000 counts, and if more than 50% of those come from <1% of pixels, then it is considered to be noise-dominated and hence unusable.
| Quadrant | # 1 sec bins | Bins with >0 counts | Bins with >2000 counts | High rate bins dominated by noise | Noise dominated (total time) | Noise dominated (detector-on time) | Marked lightcurve |
|---|---|---|---|---|---|---|---|
| A | 7622 | 6548 | 23 | 23 | 0.30% | 0.35% | 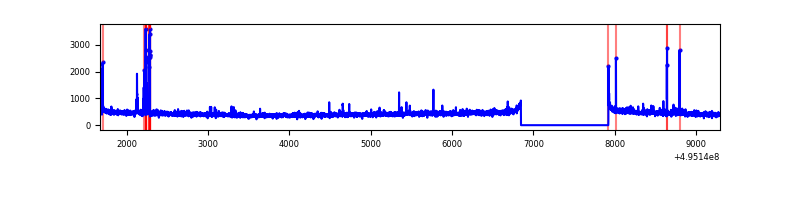 |
| B | 7622 | 6548 | 16 | 16 | 0.21% | 0.24% | 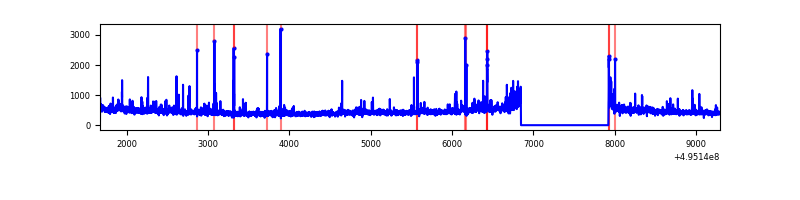 |
| C | 7622 | 6547 | 1979 | 1979 | 25.96% | 30.23% | 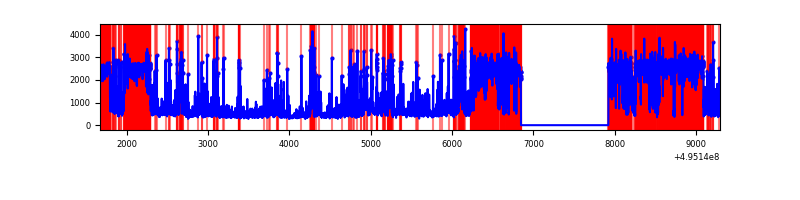 |
| D | 7621 | 6546 | 971 | 971 | 12.74% | 14.83% | 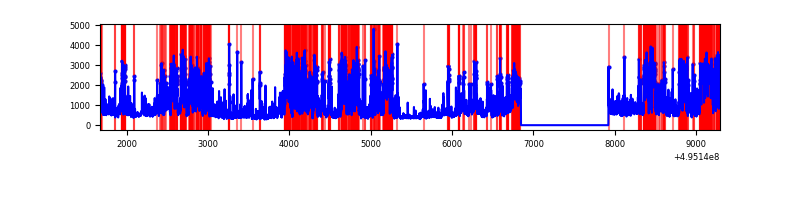 |
Top three noisy pixels from each quadrant. If the there are fewer than three noisy pixels in the level2.evt file, extra rows are filled as -1
| Pixel properties | Quadrant properties | ||||||
|---|---|---|---|---|---|---|---|
| Quadrant | DetID | PixID | Counts | Sigma | Mean | Median | Sigma |
| A | 4 | 249 | 59337 | 340.18 | 696 | 677 | 172.4 |
| A | 0 | 8 | 29833 | 169.08 | 696 | 677 | 172.4 |
| A | 12 | 17 | 18504 | 103.38 | 696 | 677 | 172.4 |
| B | 7 | 0 | 64621 | 432.19 | 692 | 668 | 148.0 |
| B | 0 | 213 | 53564 | 357.47 | 692 | 668 | 148.0 |
| B | 0 | 197 | 36605 | 242.86 | 692 | 668 | 148.0 |
| C | 1 | 241 | 4026402 | 25673.96 | 563 | 558 | 156.8 |
| C | 15 | 224 | 1635021 | 10423.44 | 563 | 558 | 156.8 |
| C | 12 | 2 | 172668 | 1097.59 | 563 | 558 | 156.8 |
| D | 15 | 93 | 2907345 | 15948.6 | 642 | 615 | 182.3 |
| D | 8 | 176 | 462234 | 2532.8 | 642 | 615 | 182.3 |
| D | 2 | 172 | 354638 | 1942.45 | 642 | 615 | 182.3 |
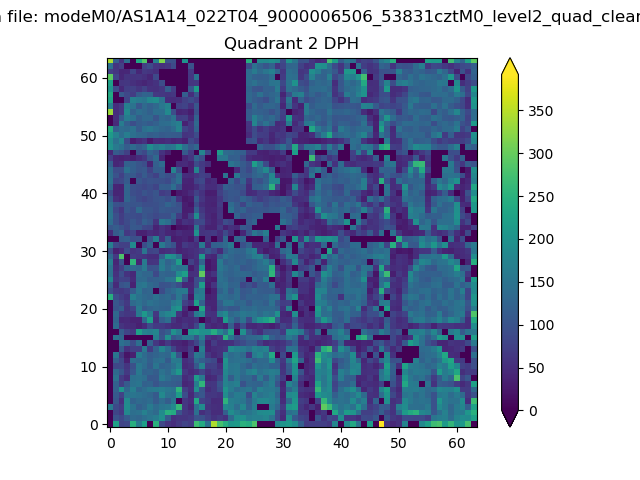
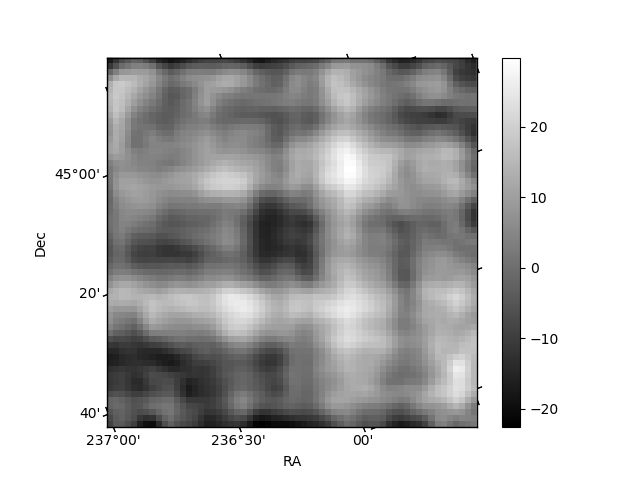
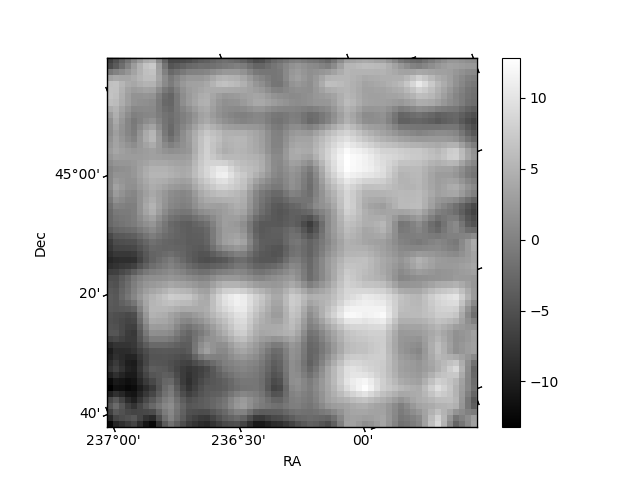
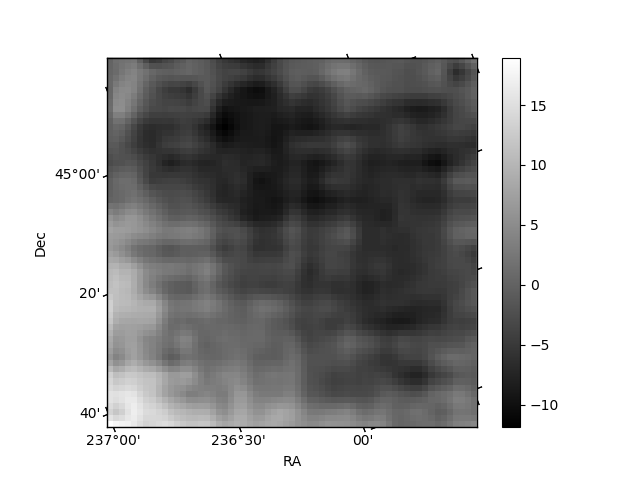
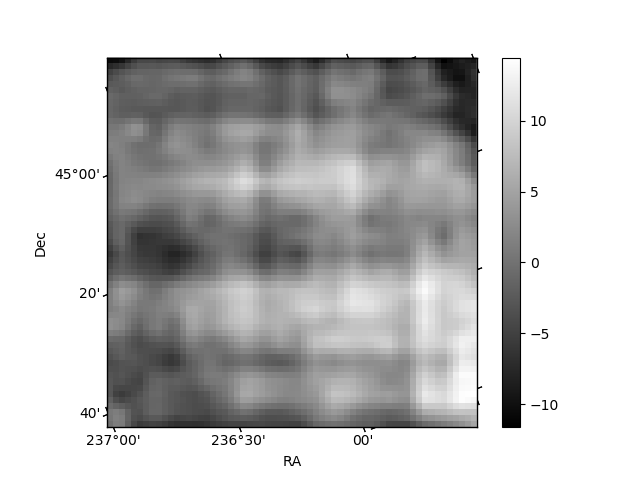
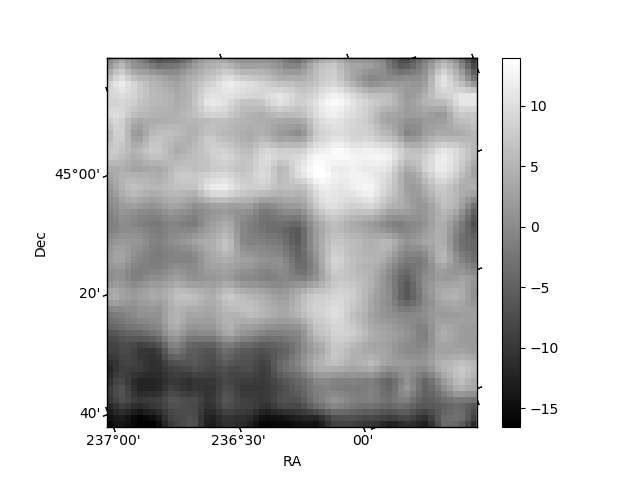
Histogram calculated using DETX and DETY for each event in the final _common_clean file
| Quadrant A | 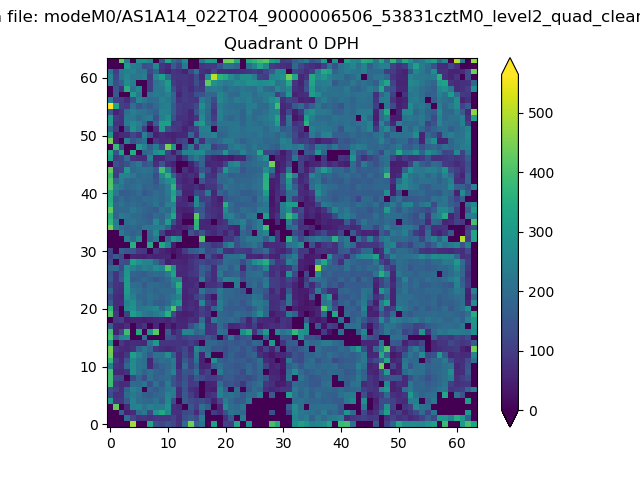 |
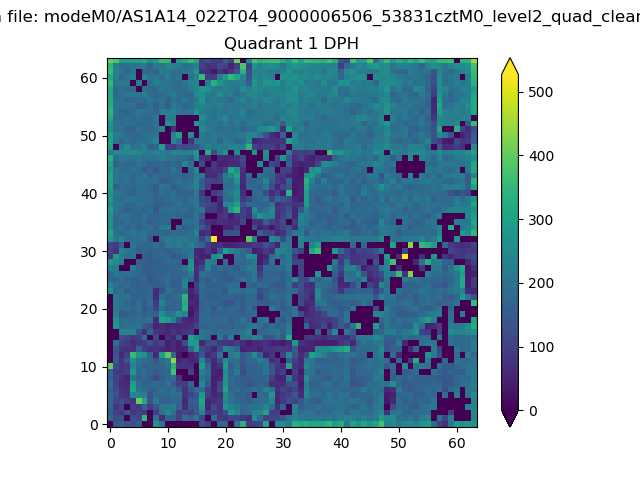 |
Quadrant B |
|---|---|---|---|
| Quadrant D | 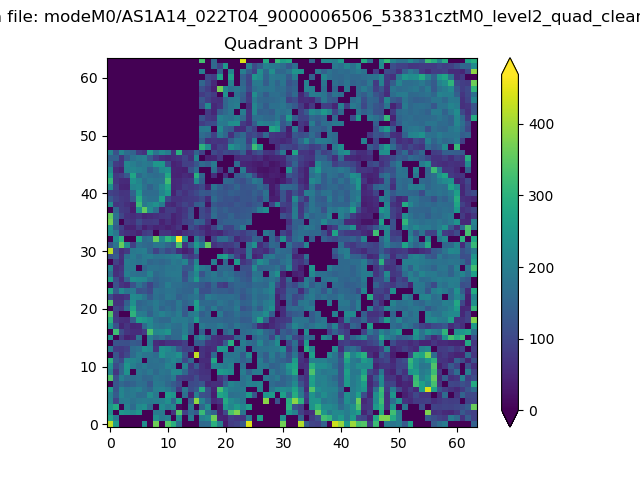 |
 |
Quadrant C |
| Plot type | Count rate plots | Images |
|---|---|---|
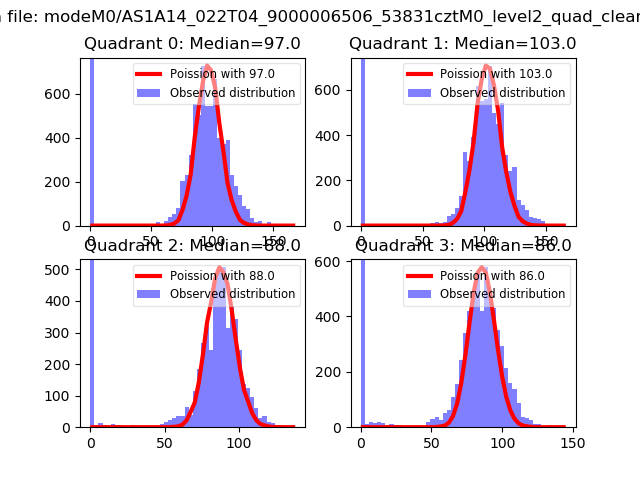
| Comparison with Poisson distribution Blue bars denote a histogram of data divided into 1 sec bins. Red curve is a Poisson curve with rate = median count rate of data. |
 |
 |
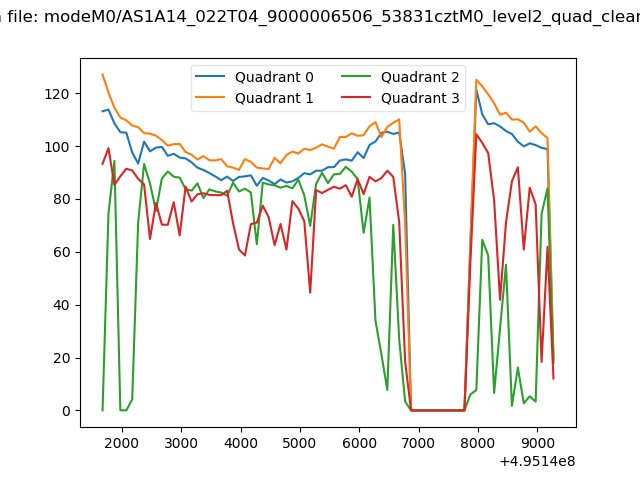
| Quadrant-wise count rates Data is divided into 100 sec bins |
 |
|
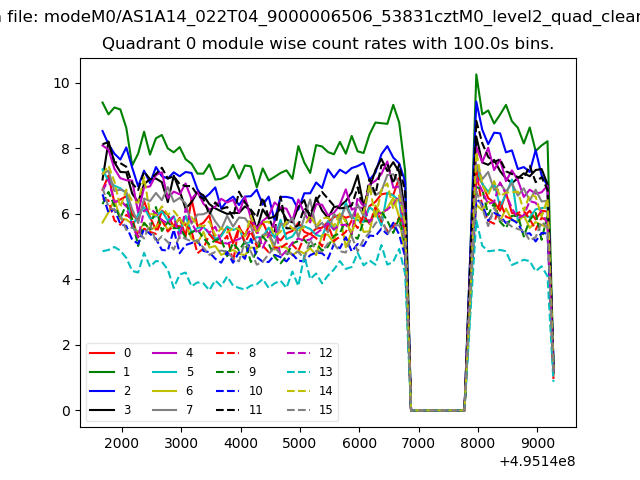
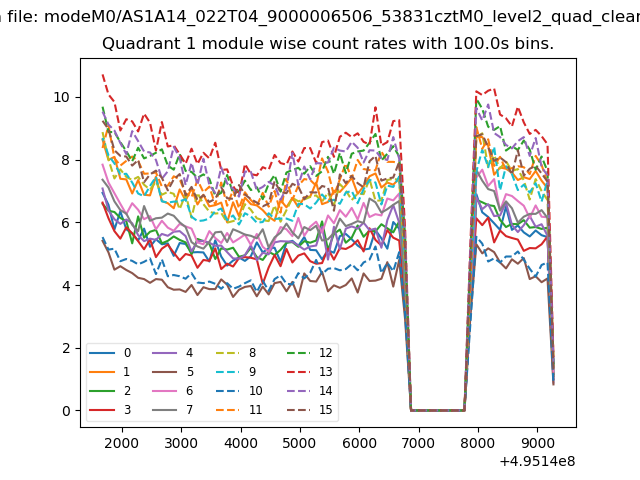
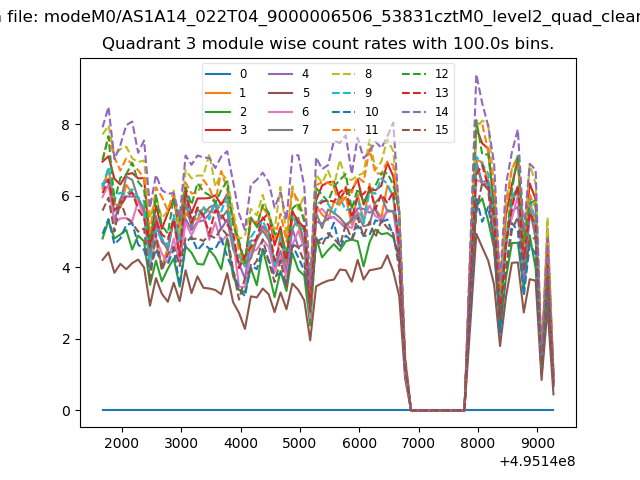
| Module-wise count rates for Quadrant A Data is divided into 100 sec bins |
 |
 |
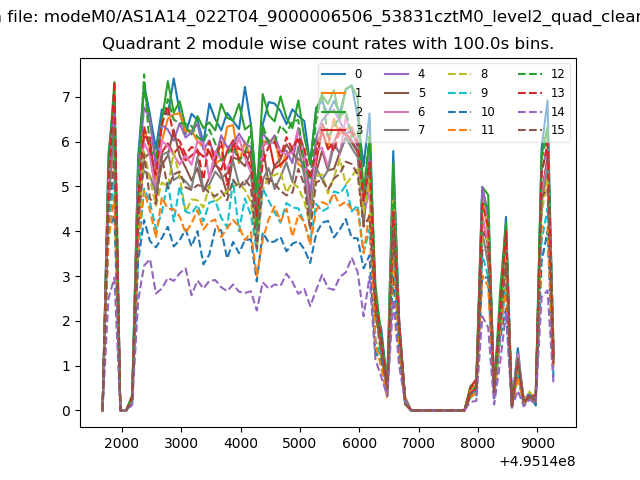
| Module-wise count rates for Quadrant B Data is divided into 100 sec bins |
 |
 |
| Module-wise count rates for Quadrant C Data is divided into 100 sec bins |
 |
 |
| Module-wise count rates for Quadrant D Data is divided into 100 sec bins |
 |
 |
| Parameter | Plot |
|---|---|
| CZT HV Monitor | 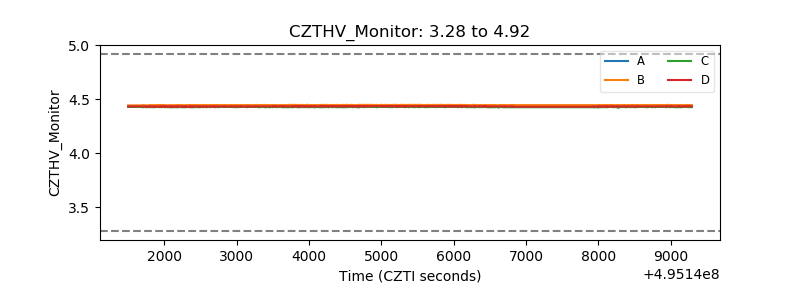 |
| D_VDD | 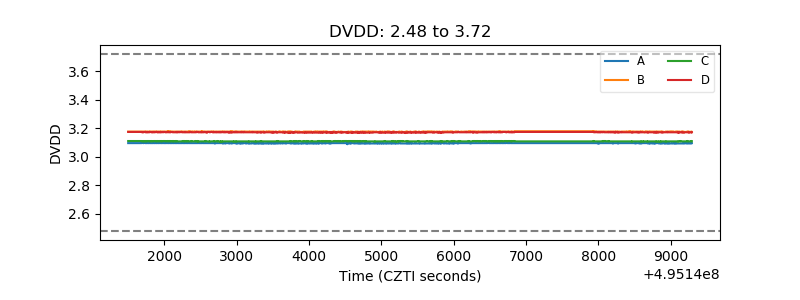 |
| Temperature 1 | 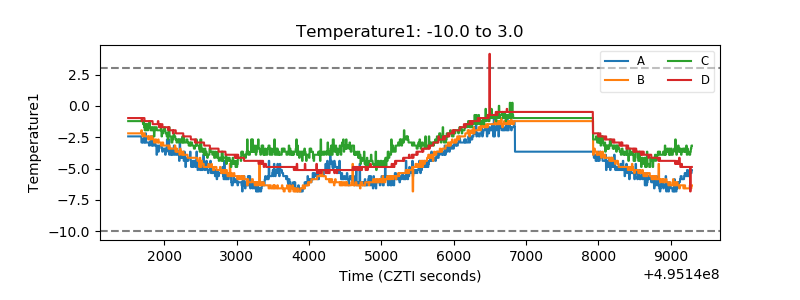 |
| Veto HV Monitor | 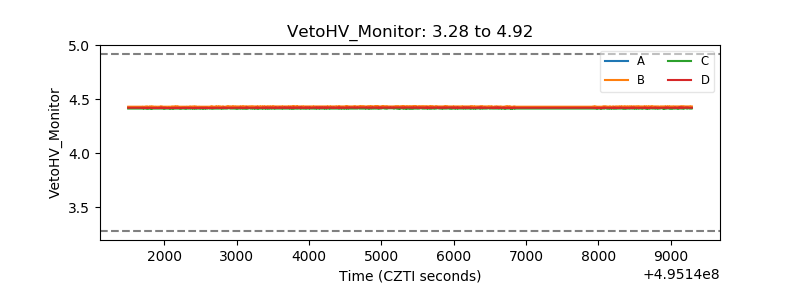 |
| Veto LLD | 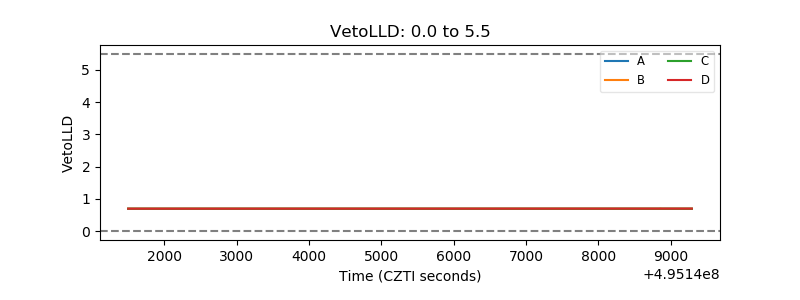 |
| Alpha Counter | 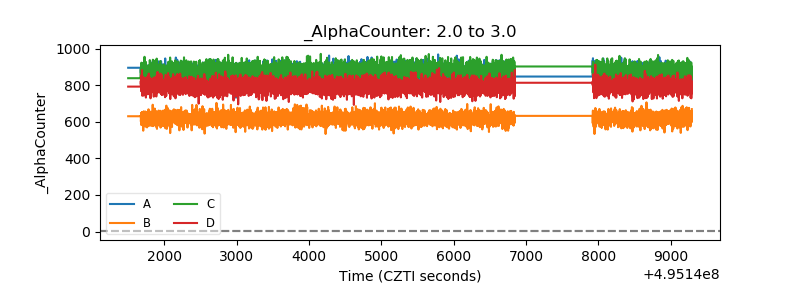 |
| _CPM_Rate | 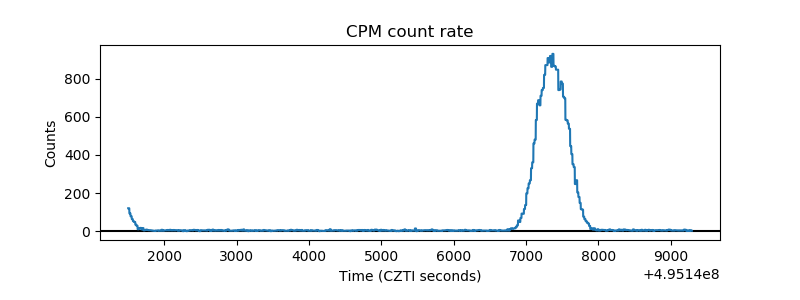 |
| CZT Counter | 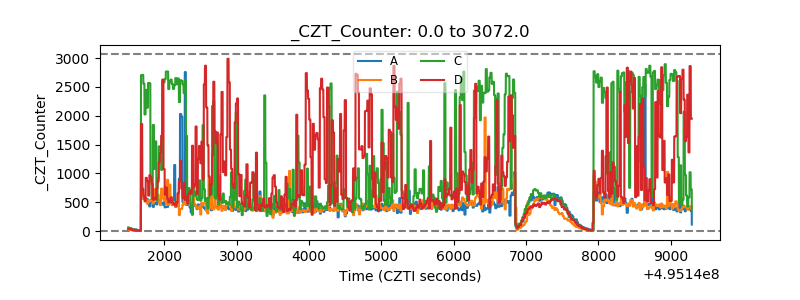 |
| +2.5 Volts monitor |  |
| +5 Volts monitor |  |
| _ROLL_ROT | 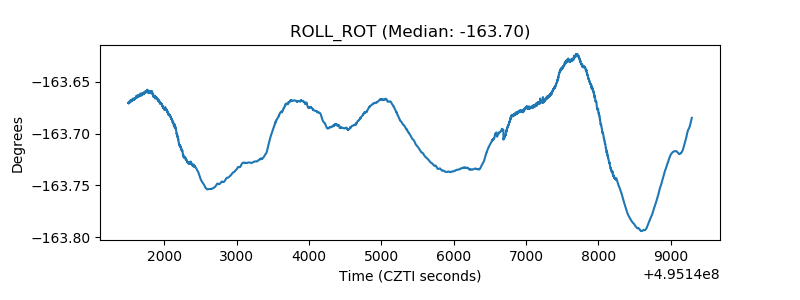 |
| _Roll_DEC | 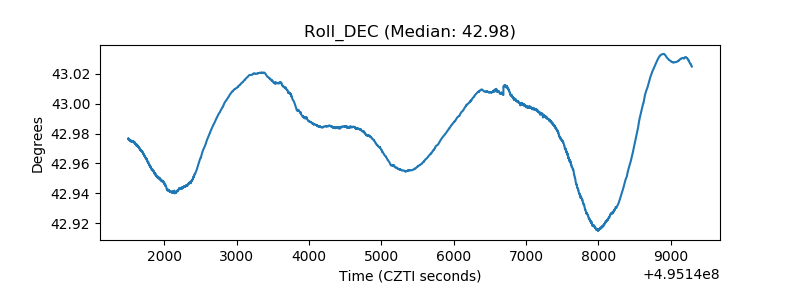 |
| _Roll_RA | 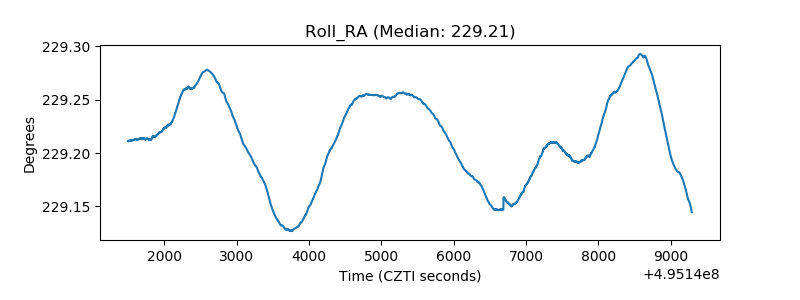 |
| Veto Counter | 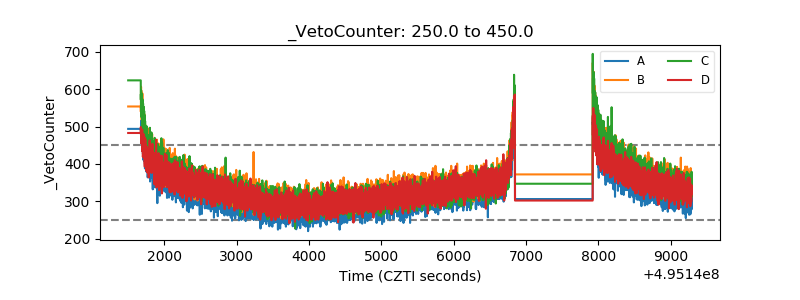 |