| Param | Original file | Final file |
|---|---|---|
| Filename | modeM0/AS1A14_022T04_9000006506_53832cztM0_level2.fits | modeM0/AS1A14_022T04_9000006506_53832cztM0_level2_quad_clean.evt |
| Size (bytes) | 789,347,520 | 85,576,320 |
| Size | 752.8 MB | 81.6 MB |
| Events in quadrant A | 3,240,940 | 664,233 |
| Events in quadrant B | 3,075,983 | 713,880 |
| Events in quadrant C | 12,883,979 | 268,108 |
| Events in quadrant D | 9,500,070 | 478,943 |
| Mode M0 | |||
|---|---|---|---|
| Quadrant | BADHDUFLAG | Total packets | Discarded packets |
| A | 0 | 14366 | 2 |
| B | 0 | 14008 | 2 |
| C | 0 | 42852 | 2 |
| D | 0 | 32903 | 2 |
| Mode SS | |||
|---|---|---|---|
| Quadrant | BADHDUFLAG | Total packets | Discarded packets |
| A | 0 | 134 | 0 |
| B | 0 | 134 | 0 |
| C | 0 | 134 | 0 |
| D | 0 | 134 | 0 |
| Mode M9 | |||
|---|---|---|---|
| Quadrant | BADHDUFLAG | Total packets | Discarded packets |
| A | 0 | 19 | 0 |
| B | 0 | 19 | 0 |
| C | 0 | 20 | 0 |
| D | 0 | 20 | 0 |
| Quadrant | Total seconds | Saturated seconds | Saturation percentage |
|---|---|---|---|
| A | 6687 | 47 | 0.702856% |
| B | 6687 | 26 | 0.388814% |
| C | 6686 | 4089 | 61.157643% |
| D | 6686 | 1618 | 24.199821% |
Noise dominated data is calculated using 1-second bins in cleaned event files. If a bin has >2000 counts, and if more than 50% of those come from <1% of pixels, then it is considered to be noise-dominated and hence unusable.
| Quadrant | # 1 sec bins | Bins with >0 counts | Bins with >2000 counts | High rate bins dominated by noise | Noise dominated (total time) | Noise dominated (detector-on time) | Marked lightcurve |
|---|---|---|---|---|---|---|---|
| A | 7872 | 6688 | 33 | 33 | 0.42% | 0.49% | 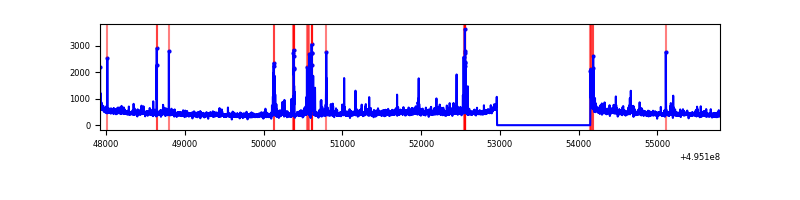 |
| B | 7872 | 6688 | 10 | 10 | 0.13% | 0.15% | 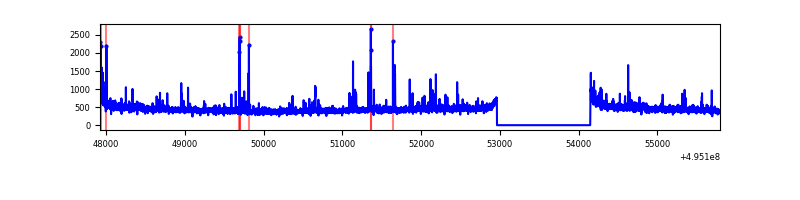 |
| C | 7870 | 6685 | 3964 | 3964 | 50.37% | 59.30% | 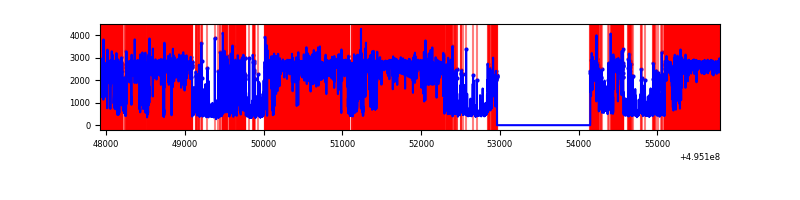 |
| D | 7871 | 6686 | 1664 | 1664 | 21.14% | 24.89% | 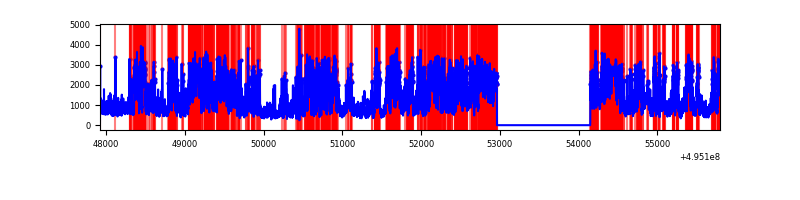 |
Top three noisy pixels from each quadrant. If the there are fewer than three noisy pixels in the level2.evt file, extra rows are filled as -1
| Pixel properties | Quadrant properties | ||||||
|---|---|---|---|---|---|---|---|
| Quadrant | DetID | PixID | Counts | Sigma | Mean | Median | Sigma |
| A | 8 | 245 | 156767 | 880.73 | 721 | 705 | 177.2 |
| A | 8 | 249 | 71161 | 397.62 | 721 | 705 | 177.2 |
| A | 12 | 17 | 54572 | 304.0 | 721 | 705 | 177.2 |
| B | 10 | 245 | 67490 | 435.83 | 718 | 694 | 153.3 |
| B | 0 | 213 | 28774 | 183.21 | 718 | 694 | 153.3 |
| B | 8 | 234 | 26744 | 169.97 | 718 | 694 | 153.3 |
| C | 1 | 241 | 7754444 | 56815.16 | 496 | 491 | 136.5 |
| C | 15 | 224 | 2496312 | 18287.51 | 496 | 491 | 136.5 |
| C | 12 | 252 | 250959 | 1835.24 | 496 | 491 | 136.5 |
| D | 15 | 93 | 4582135 | 25194.72 | 637 | 608 | 181.8 |
| D | 2 | 172 | 1723225 | 9473.01 | 637 | 608 | 181.8 |
| D | 13 | 153 | 126452 | 692.04 | 637 | 608 | 181.8 |
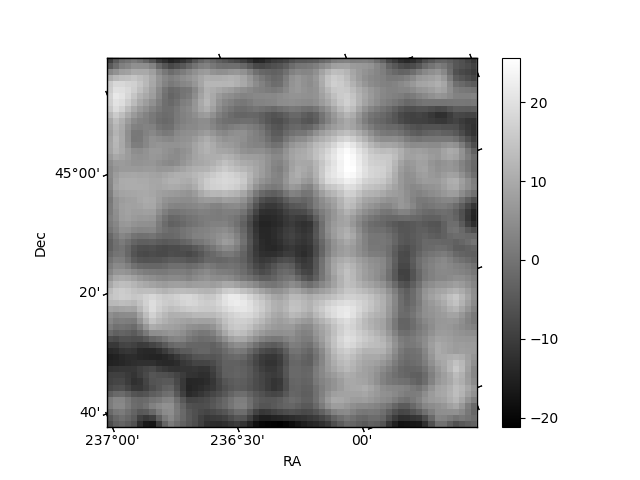
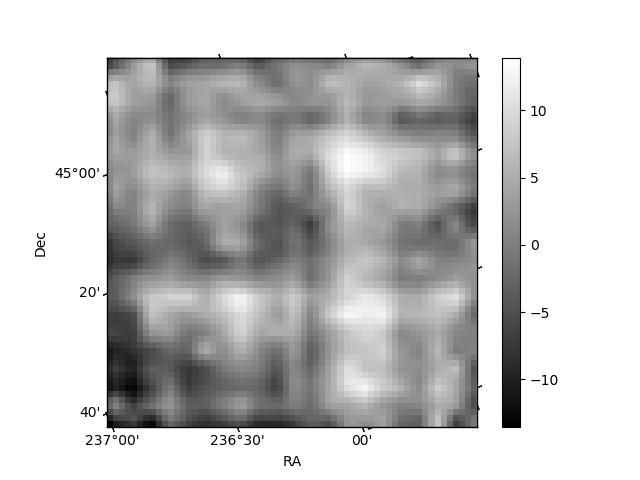
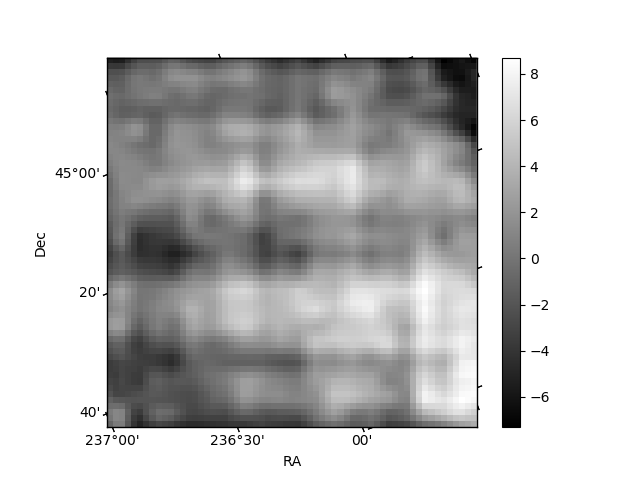
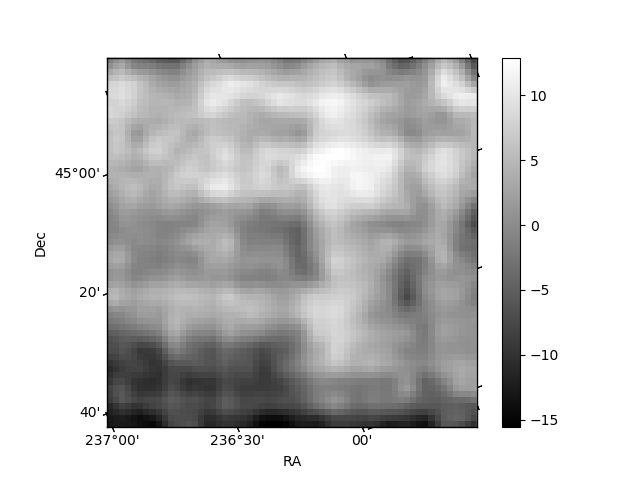
Histogram calculated using DETX and DETY for each event in the final _common_clean file
| Quadrant A | 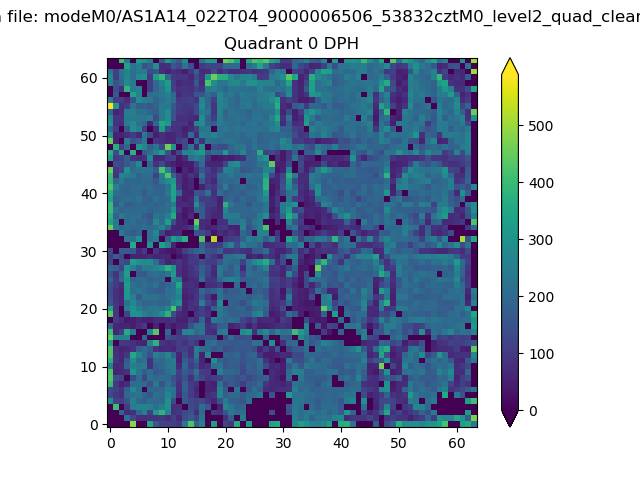 |
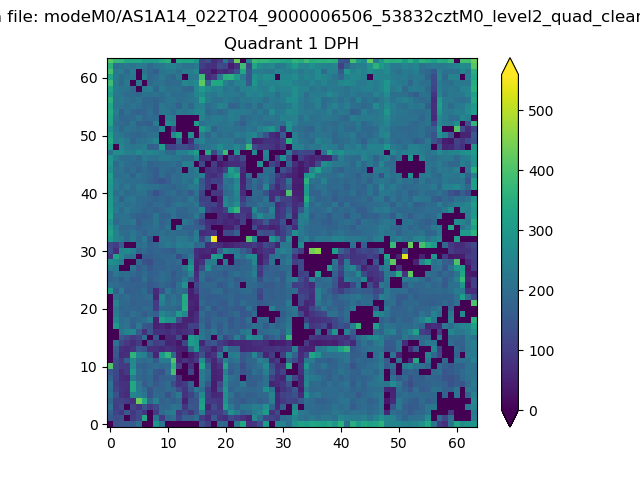 |
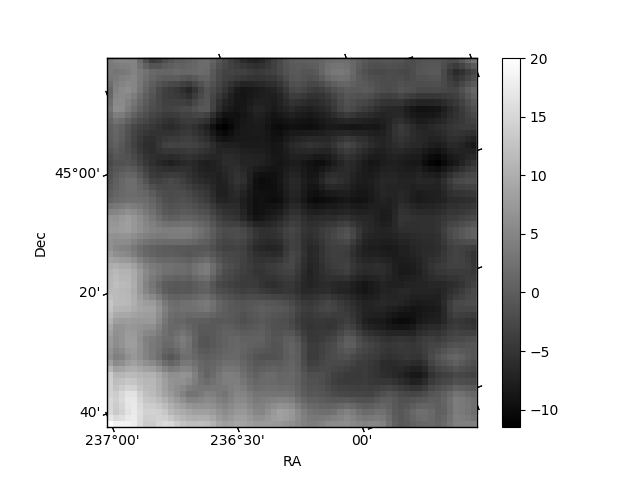
Quadrant B |
|---|---|---|---|
| Quadrant D | 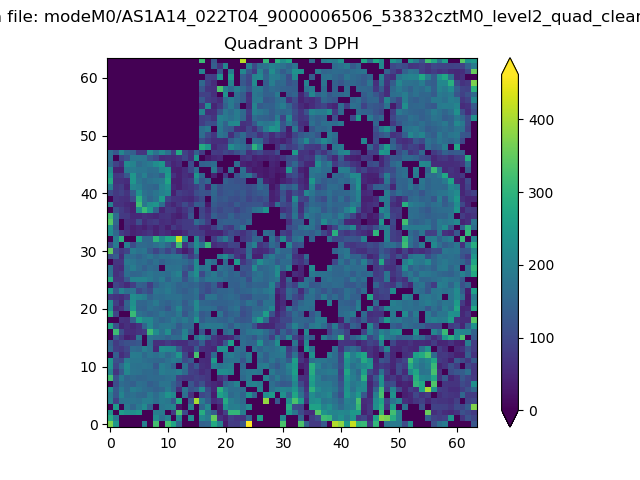 |
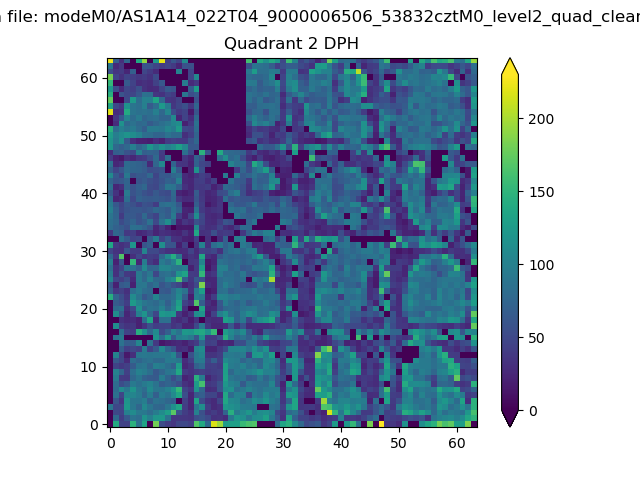 |
Quadrant C |
| Plot type | Count rate plots | Images |
|---|---|---|
| Comparison with Poisson distribution Blue bars denote a histogram of data divided into 1 sec bins. Red curve is a Poisson curve with rate = median count rate of data. |
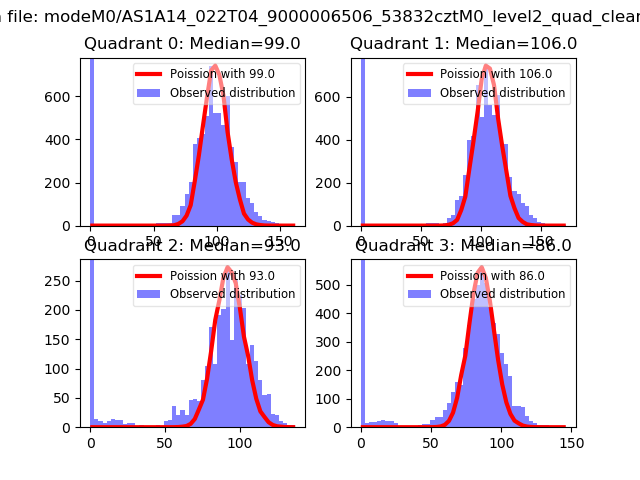 |
 |
| Quadrant-wise count rates Data is divided into 100 sec bins |
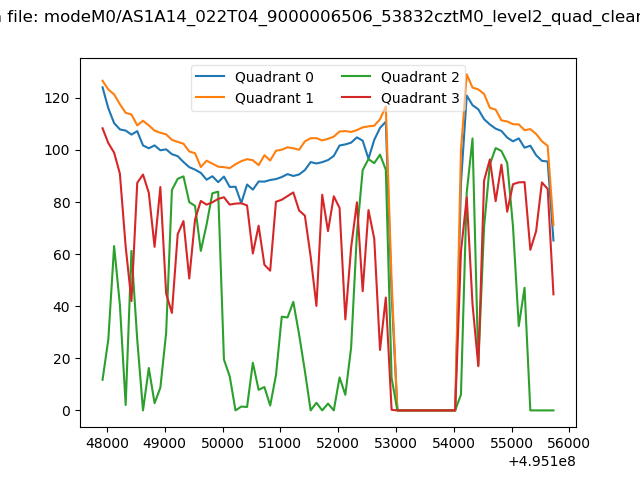 |
|
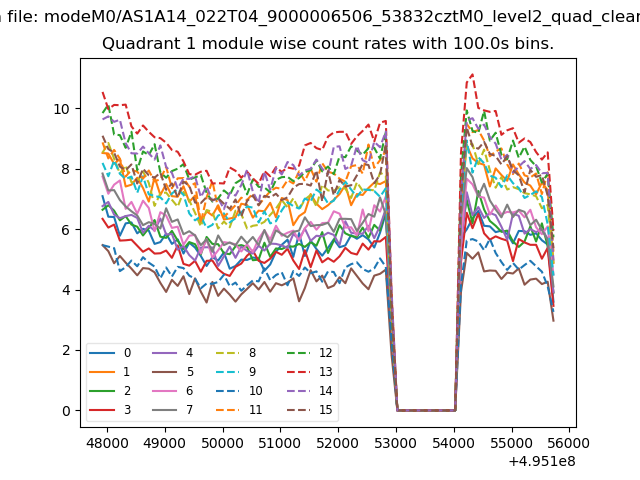
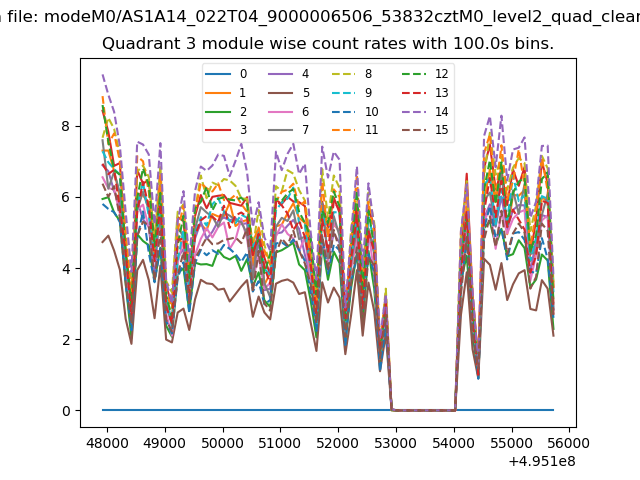
| Module-wise count rates for Quadrant A Data is divided into 100 sec bins |
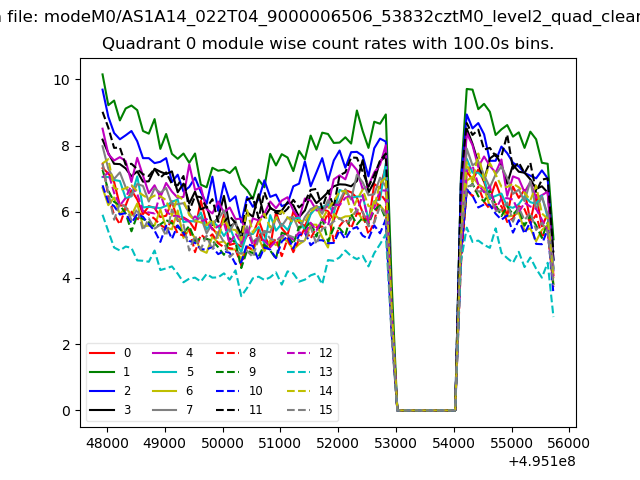 |
 |
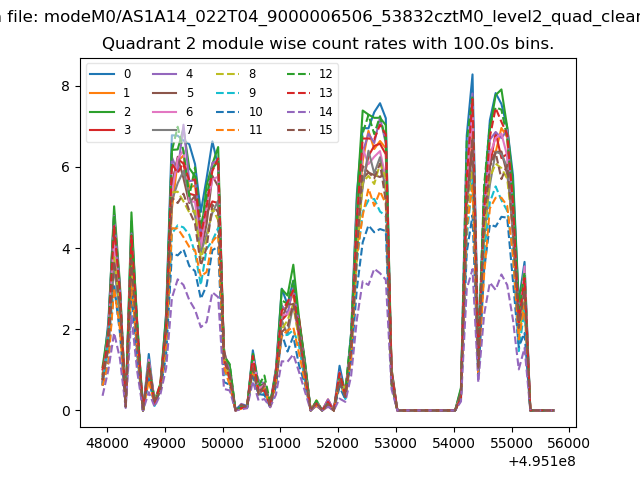
| Module-wise count rates for Quadrant B Data is divided into 100 sec bins |
 |
 |
| Module-wise count rates for Quadrant C Data is divided into 100 sec bins |
 |
 |
| Module-wise count rates for Quadrant D Data is divided into 100 sec bins |
 |
 |
| Parameter | Plot |
|---|---|
| CZT HV Monitor | 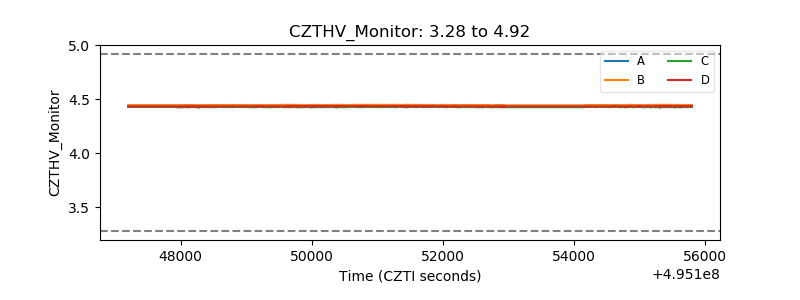 |
| D_VDD | 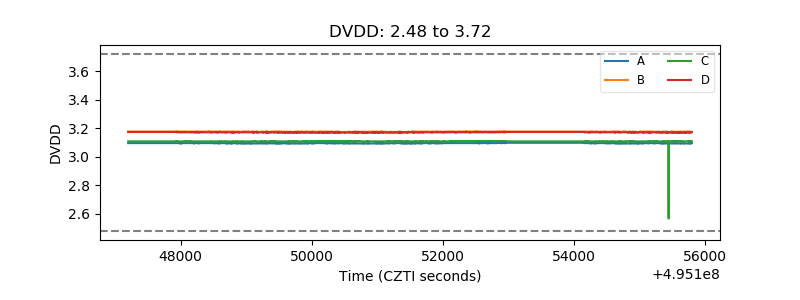 |
| Temperature 1 | 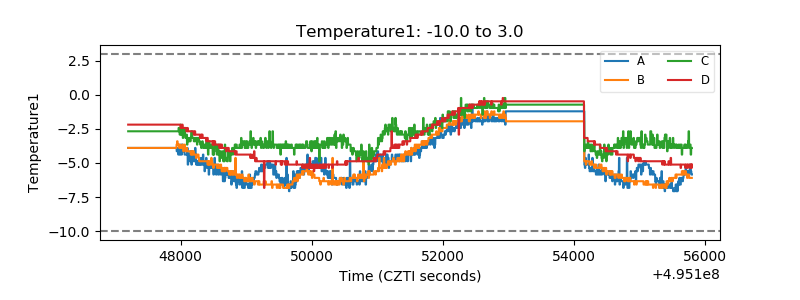 |
| Veto HV Monitor | 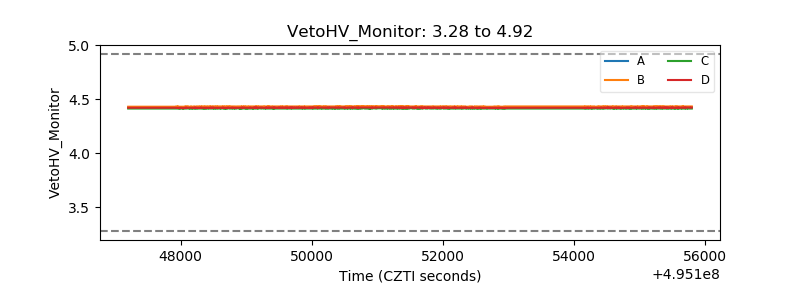 |
| Veto LLD | 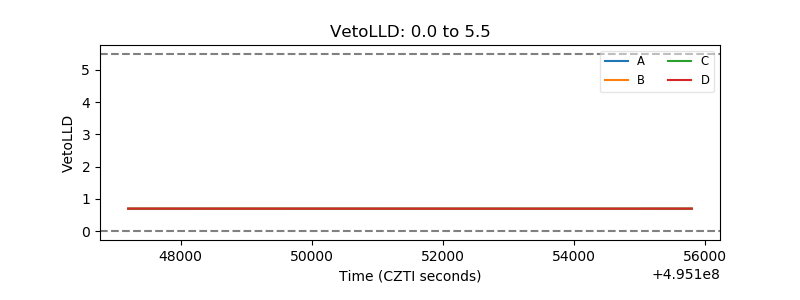 |
| Alpha Counter | 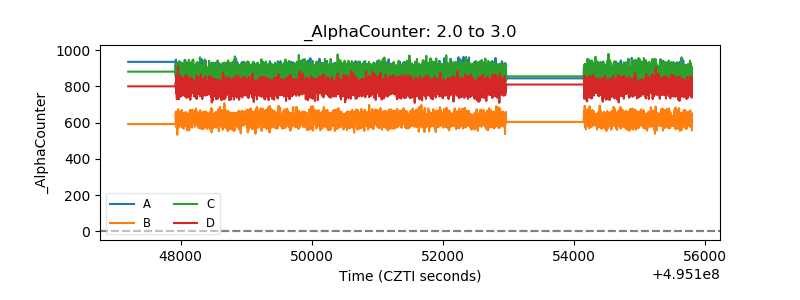 |
| _CPM_Rate | 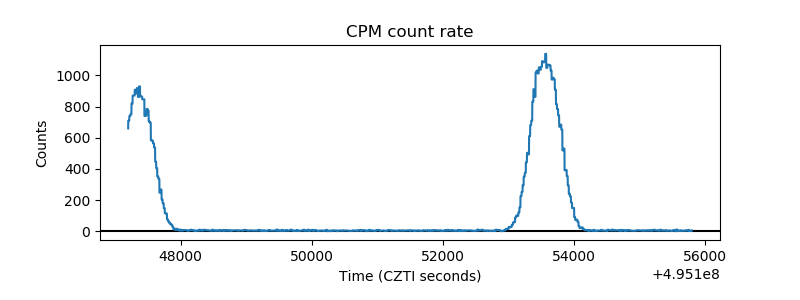 |
| CZT Counter | 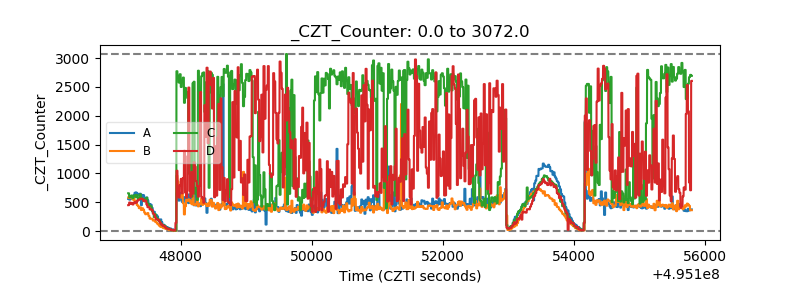 |
| +2.5 Volts monitor |  |
| +5 Volts monitor |  |
| _ROLL_ROT | 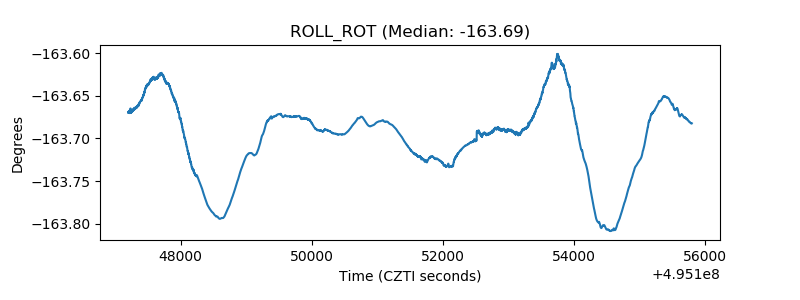 |
| _Roll_DEC | 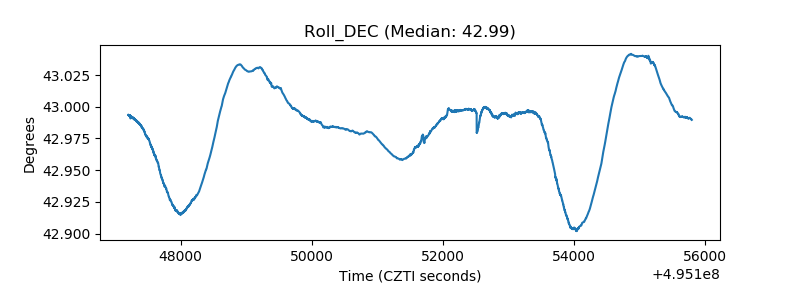 |
| _Roll_RA | 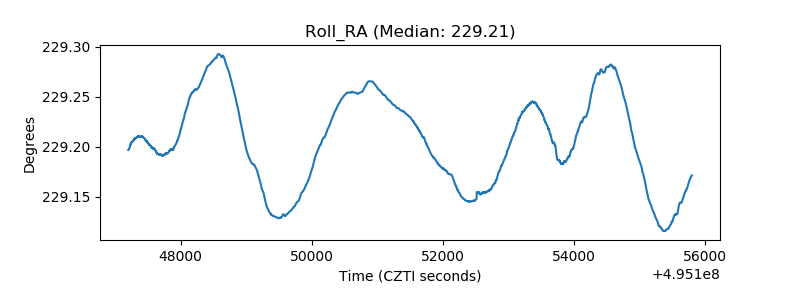 |
| Veto Counter | 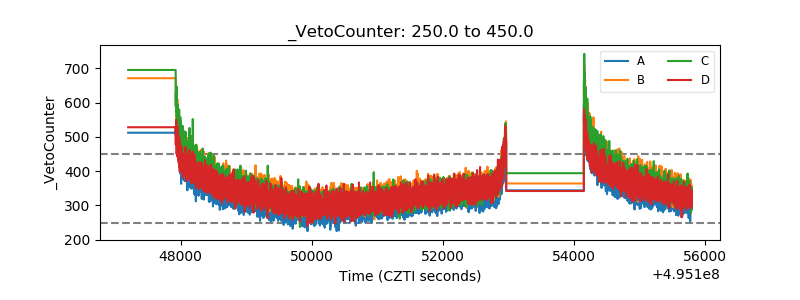 |