| Param | Original file | Final file |
|---|---|---|
| Filename | modeM0/AS1A14_022T04_9000006506_53833cztM0_level2.fits | modeM0/AS1A14_022T04_9000006506_53833cztM0_level2_quad_clean.evt |
| Size (bytes) | 665,737,920 | 77,630,400 |
| Size | 634.9 MB | 74.0 MB |
| Events in quadrant A | 2,776,330 | 586,623 |
| Events in quadrant B | 3,559,127 | 607,964 |
| Events in quadrant C | 9,643,238 | 334,384 |
| Events in quadrant D | 8,207,491 | 409,448 |
| Mode M0 | |||
|---|---|---|---|
| Quadrant | BADHDUFLAG | Total packets | Discarded packets |
| A | 0 | 12539 | 1 |
| B | 0 | 14731 | 1 |
| C | 0 | 32712 | 1 |
| D | 0 | 28363 | 1 |
| Mode SS | |||
|---|---|---|---|
| Quadrant | BADHDUFLAG | Total packets | Discarded packets |
| A | 0 | 120 | 0 |
| B | 0 | 120 | 0 |
| C | 0 | 120 | 0 |
| D | 0 | 120 | 0 |
| Mode M9 | |||
|---|---|---|---|
| Quadrant | BADHDUFLAG | Total packets | Discarded packets |
| A | 0 | 12 | 0 |
| B | 0 | 12 | 0 |
| C | 0 | 12 | 0 |
| D | 0 | 12 | 0 |
| Quadrant | Total seconds | Saturated seconds | Saturation percentage |
|---|---|---|---|
| A | 5897 | 51 | 0.864847% |
| B | 5896 | 295 | 5.003392% |
| C | 5896 | 2652 | 44.979647% |
| D | 5896 | 1531 | 25.966757% |
Noise dominated data is calculated using 1-second bins in cleaned event files. If a bin has >2000 counts, and if more than 50% of those come from <1% of pixels, then it is considered to be noise-dominated and hence unusable.
| Quadrant | # 1 sec bins | Bins with >0 counts | Bins with >2000 counts | High rate bins dominated by noise | Noise dominated (total time) | Noise dominated (detector-on time) | Marked lightcurve |
|---|---|---|---|---|---|---|---|
| A | 7102 | 5897 | 10 | 10 | 0.14% | 0.17% | 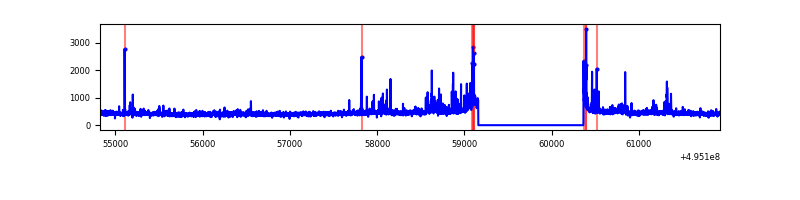 |
| B | 7101 | 5897 | 179 | 179 | 2.52% | 3.04% | 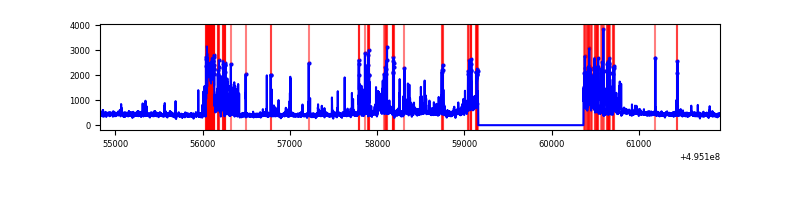 |
| C | 7100 | 5895 | 2580 | 2580 | 36.34% | 43.77% | 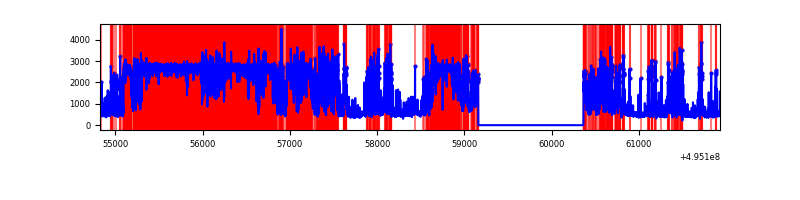 |
| D | 7101 | 5897 | 1577 | 1577 | 22.21% | 26.74% | 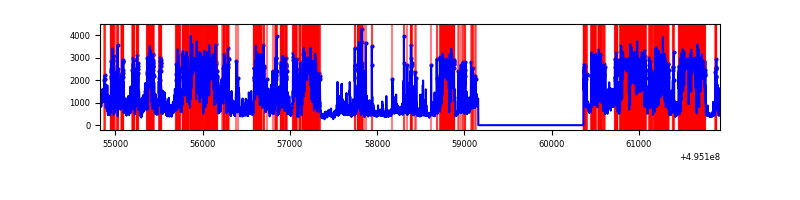 |
Top three noisy pixels from each quadrant. If the there are fewer than three noisy pixels in the level2.evt file, extra rows are filled as -1
| Pixel properties | Quadrant properties | ||||||
|---|---|---|---|---|---|---|---|
| Quadrant | DetID | PixID | Counts | Sigma | Mean | Median | Sigma |
| A | 4 | 249 | 115897 | 731.86 | 640 | 623 | 157.5 |
| A | 8 | 249 | 42590 | 266.44 | 640 | 623 | 157.5 |
| A | 12 | 17 | 28804 | 178.92 | 640 | 623 | 157.5 |
| B | 5 | 185 | 842967 | 6298.0 | 625 | 604 | 133.8 |
| B | 8 | 234 | 113936 | 847.34 | 625 | 604 | 133.8 |
| B | 5 | 172 | 50176 | 370.63 | 625 | 604 | 133.8 |
| C | 1 | 241 | 5900592 | 43051.28 | 491 | 486 | 137.0 |
| C | 15 | 224 | 1178677 | 8596.9 | 491 | 486 | 137.0 |
| C | 1 | 16 | 195613 | 1423.78 | 491 | 486 | 137.0 |
| D | 15 | 93 | 4643760 | 29556.53 | 548 | 524 | 157.1 |
| D | 2 | 172 | 678107 | 4313.16 | 548 | 524 | 157.1 |
| D | 8 | 176 | 262225 | 1665.86 | 548 | 524 | 157.1 |
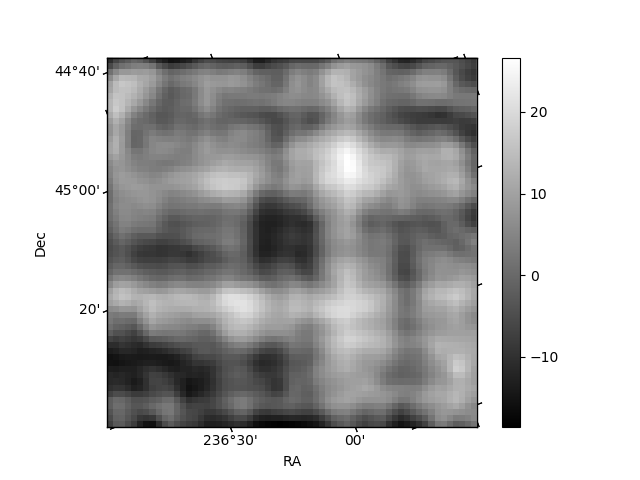
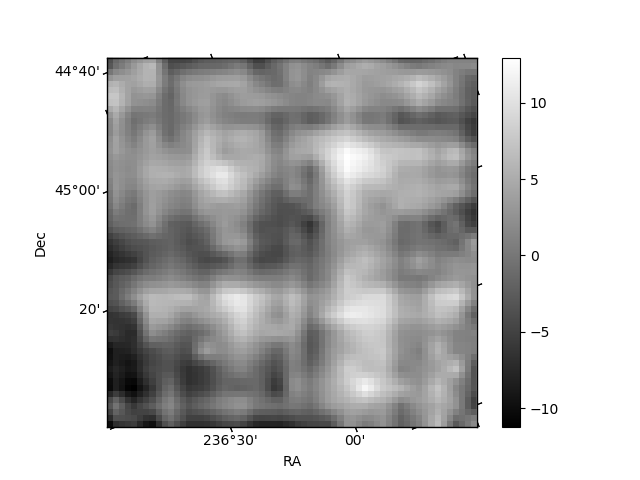
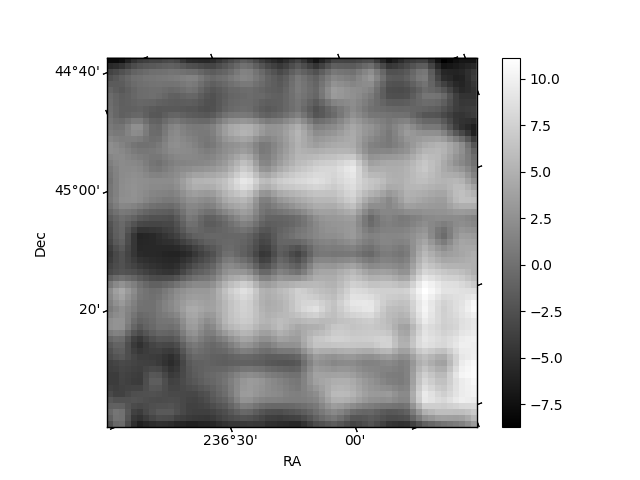
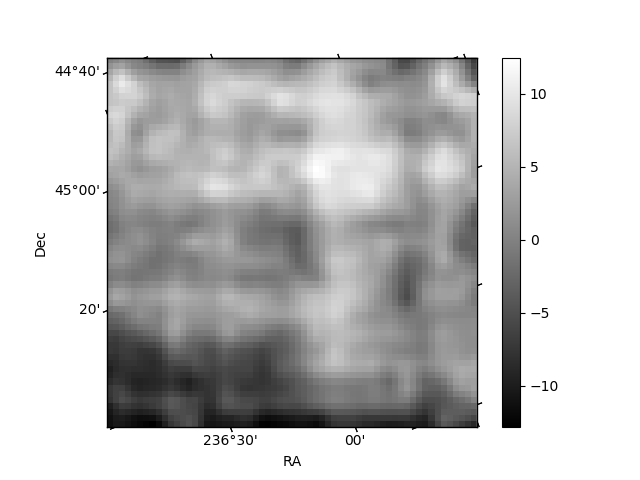
Histogram calculated using DETX and DETY for each event in the final _common_clean file
| Quadrant A | 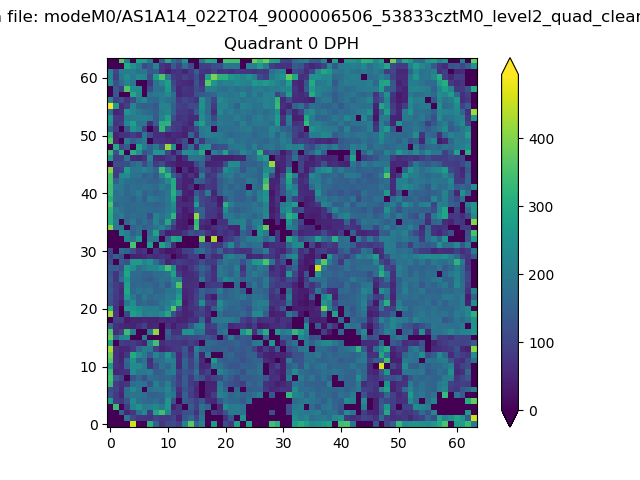 |
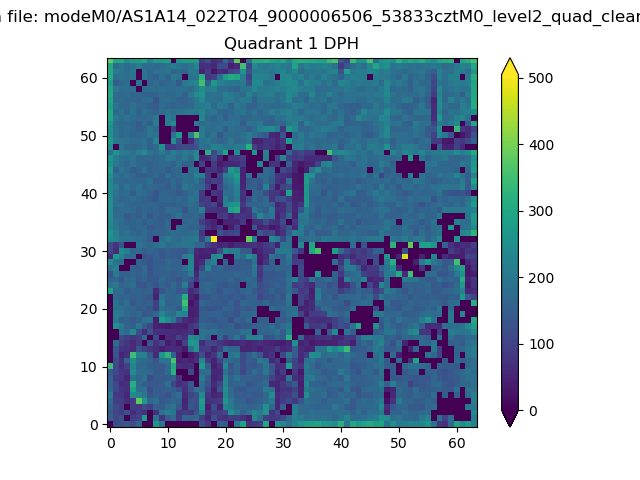 |
Quadrant B |
|---|---|---|---|
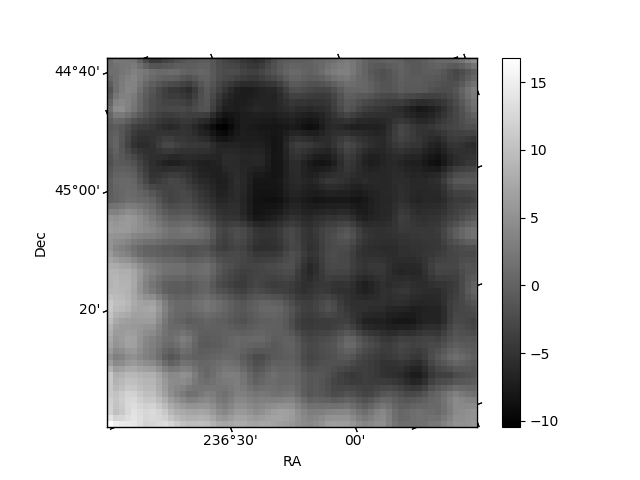
| Quadrant D | 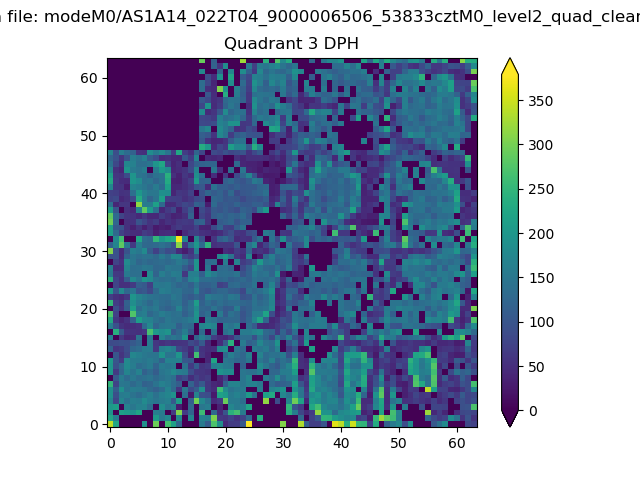 |
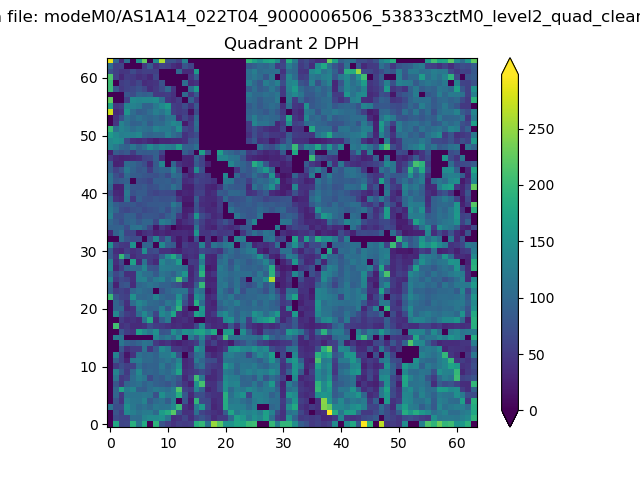 |
Quadrant C |
| Plot type | Count rate plots | Images |
|---|---|---|
| Comparison with Poisson distribution Blue bars denote a histogram of data divided into 1 sec bins. Red curve is a Poisson curve with rate = median count rate of data. |
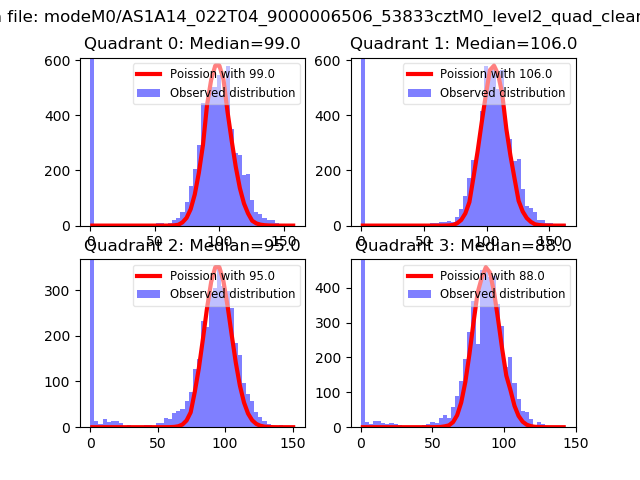 |
 |
| Quadrant-wise count rates Data is divided into 100 sec bins |
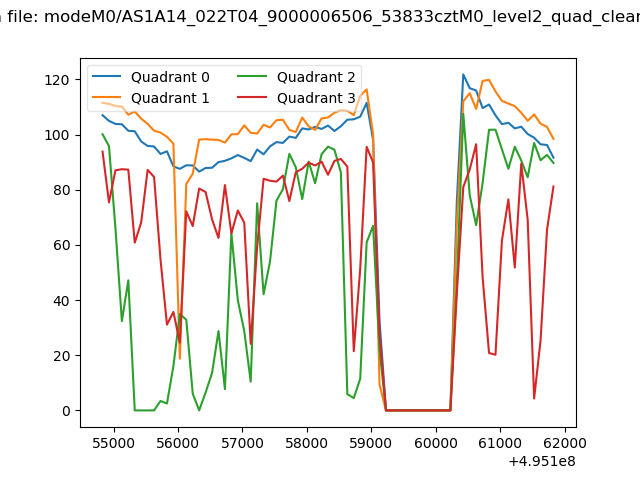 |
|
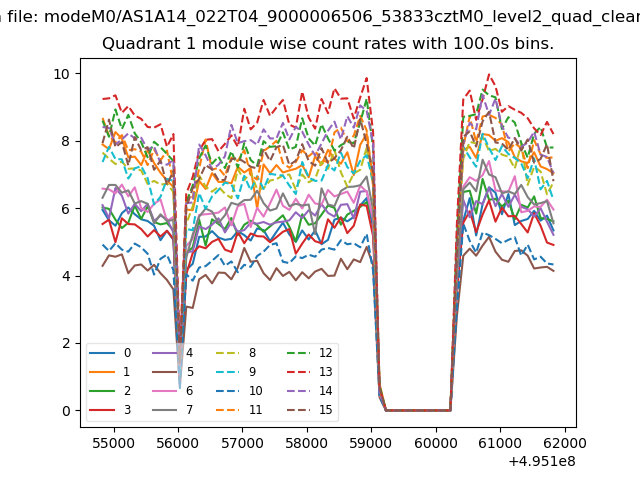
| Module-wise count rates for Quadrant A Data is divided into 100 sec bins |
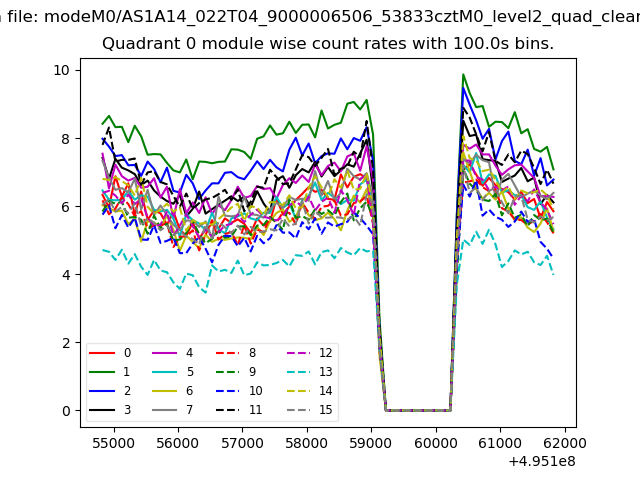 |
 |
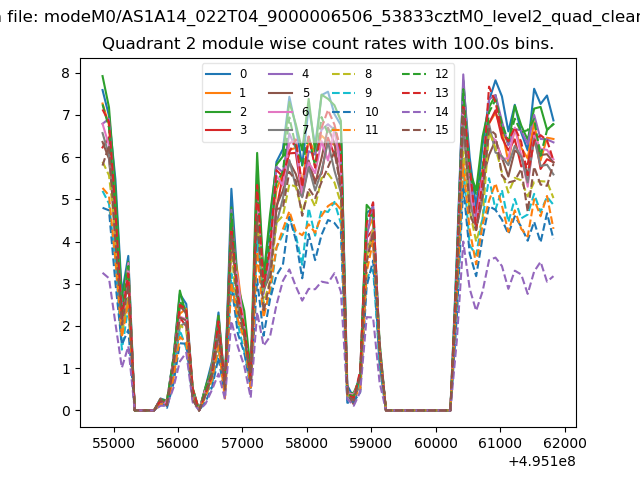
| Module-wise count rates for Quadrant B Data is divided into 100 sec bins |
 |
 |
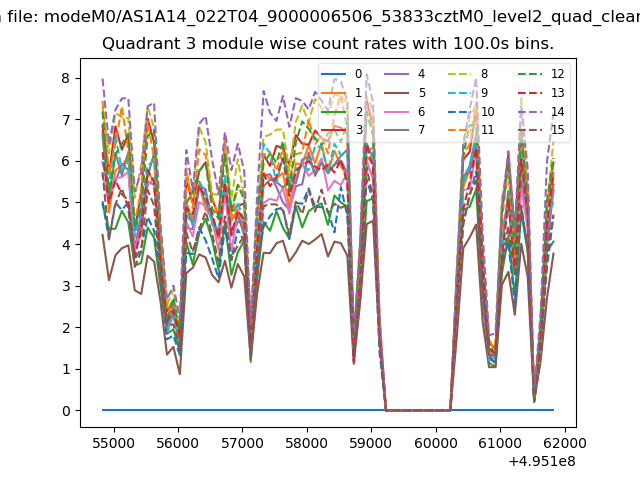
| Module-wise count rates for Quadrant C Data is divided into 100 sec bins |
 |
 |
| Module-wise count rates for Quadrant D Data is divided into 100 sec bins |
 |
 |
| Parameter | Plot |
|---|---|
| CZT HV Monitor | 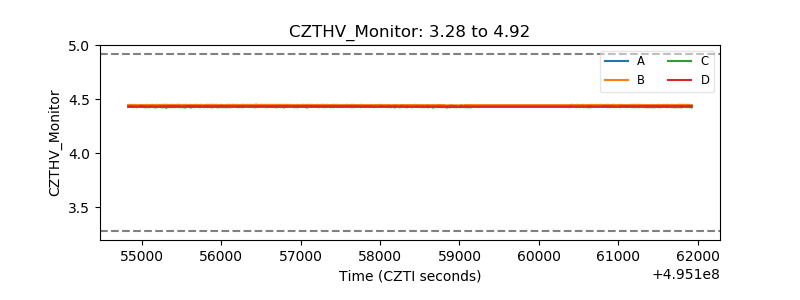 |
| D_VDD | 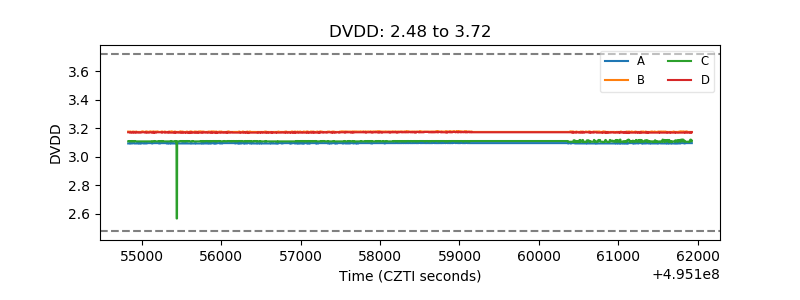 |
| Temperature 1 | 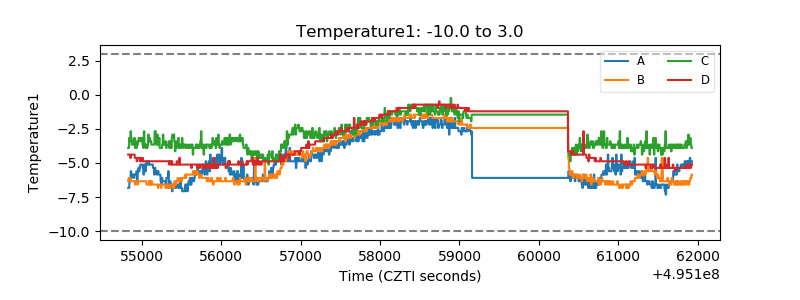 |
| Veto HV Monitor | 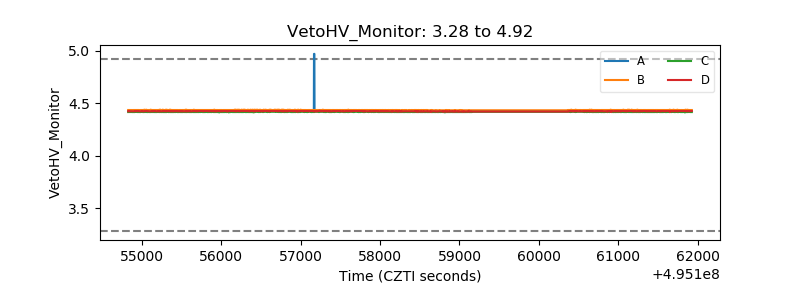 |
| Veto LLD | 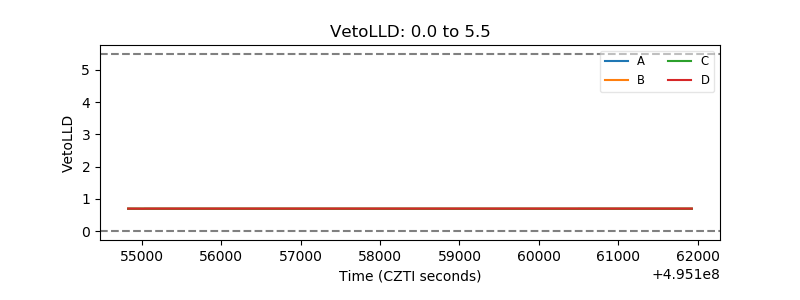 |
| Alpha Counter | 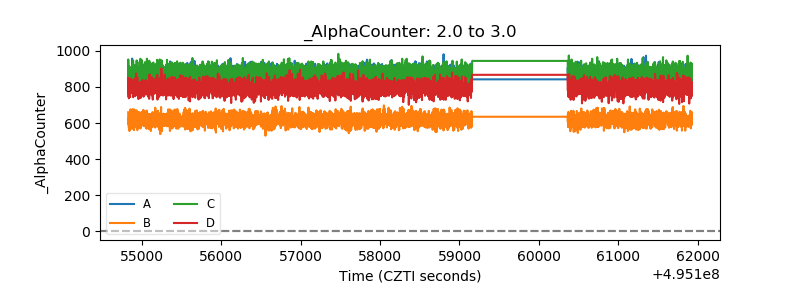 |
| _CPM_Rate | 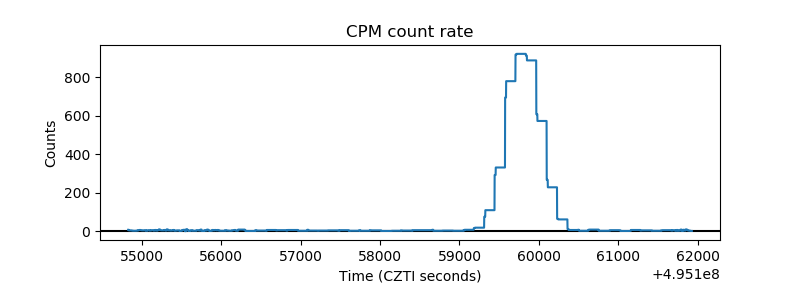 |
| CZT Counter | 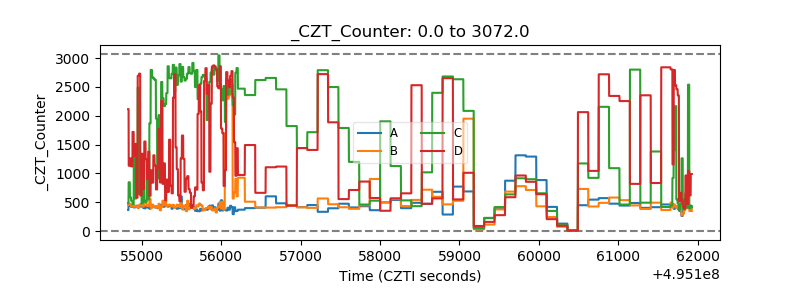 |
| +2.5 Volts monitor |  |
| +5 Volts monitor | 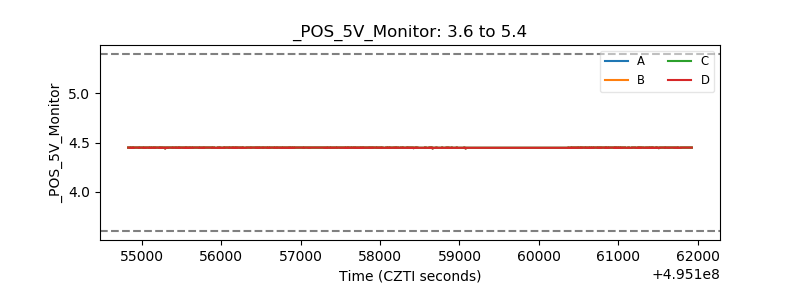 |
| _ROLL_ROT | 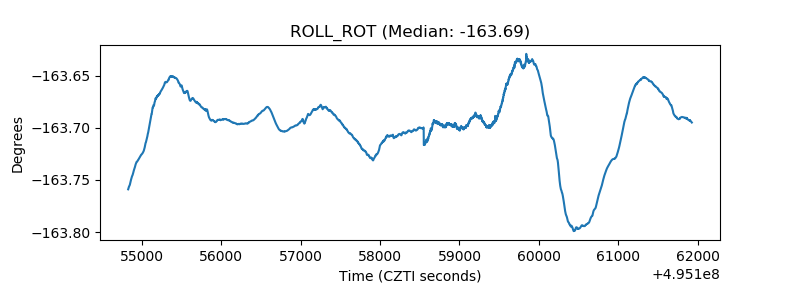 |
| _Roll_DEC | 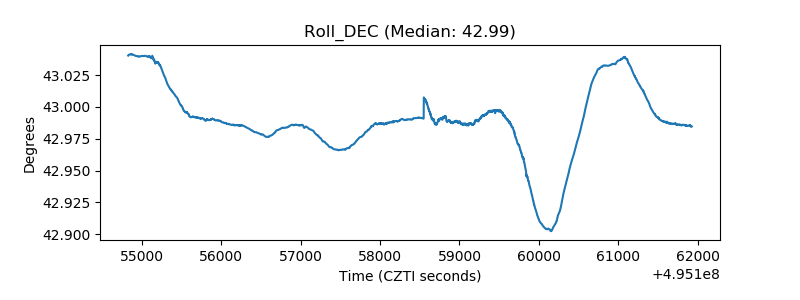 |
| _Roll_RA | 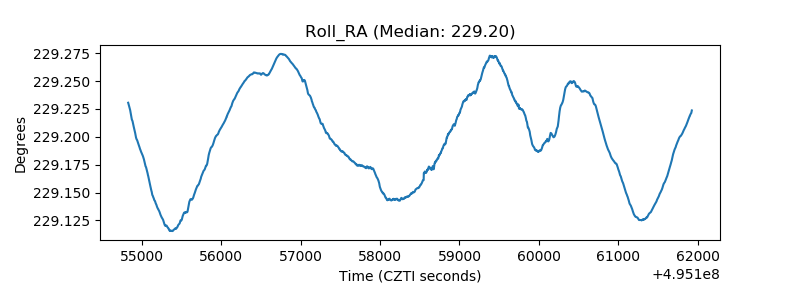 |
| Veto Counter | 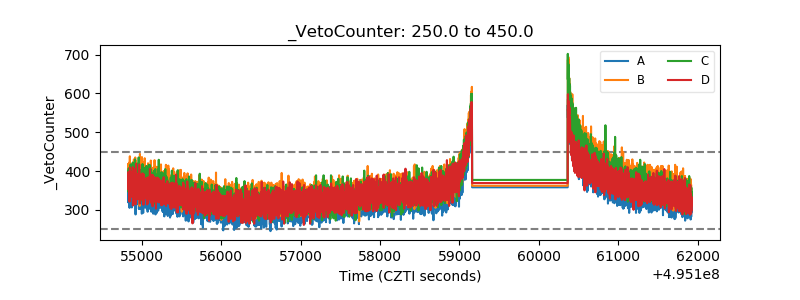 |