| Param | Original file | Final file |
|---|---|---|
| Filename | modeM0/AS1A14_022T04_9000006506_53834cztM0_level2.fits | modeM0/AS1A14_022T04_9000006506_53834cztM0_level2_quad_clean.evt |
| Size (bytes) | 542,116,800 | 82,820,160 |
| Size | 517.0 MB | 79.0 MB |
| Events in quadrant A | 2,844,748 | 582,105 |
| Events in quadrant B | 3,918,296 | 616,145 |
| Events in quadrant C | 7,461,739 | 419,962 |
| Events in quadrant D | 5,384,024 | 476,978 |
| Mode M0 | |||
|---|---|---|---|
| Quadrant | BADHDUFLAG | Total packets | Discarded packets |
| A | 0 | 12631 | 6 |
| B | 0 | 15848 | 1 |
| C | 0 | 26227 | 1 |
| D | 0 | 20049 | 1 |
| Mode SS | |||
|---|---|---|---|
| Quadrant | BADHDUFLAG | Total packets | Discarded packets |
| A | 0 | 120 | 0 |
| B | 0 | 120 | 0 |
| C | 0 | 120 | 0 |
| D | 0 | 120 | 0 |
| Mode M9 | |||
|---|---|---|---|
| Quadrant | BADHDUFLAG | Total packets | Discarded packets |
| A | 0 | 11 | 0 |
| B | 0 | 11 | 0 |
| C | 0 | 11 | 0 |
| D | 0 | 11 | 0 |
| Quadrant | Total seconds | Saturated seconds | Saturation percentage |
|---|---|---|---|
| A | 5905 | 87 | 1.473328% |
| B | 5905 | 212 | 3.590178% |
| C | 5905 | 1639 | 27.756139% |
| D | 5906 | 706 | 11.953945% |
Noise dominated data is calculated using 1-second bins in cleaned event files. If a bin has >2000 counts, and if more than 50% of those come from <1% of pixels, then it is considered to be noise-dominated and hence unusable.
| Quadrant | # 1 sec bins | Bins with >0 counts | Bins with >2000 counts | High rate bins dominated by noise | Noise dominated (total time) | Noise dominated (detector-on time) | Marked lightcurve |
|---|---|---|---|---|---|---|---|
| A | 7039 | 5905 | 20 | 20 | 0.28% | 0.34% | 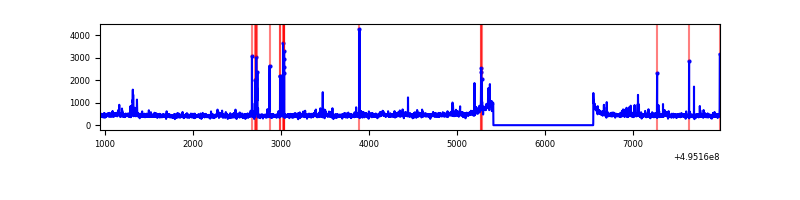 |
| B | 7040 | 5905 | 119 | 119 | 1.69% | 2.02% | 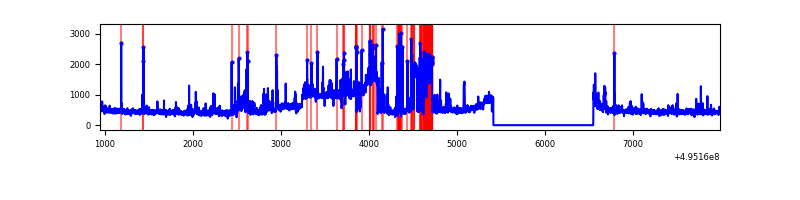 |
| C | 7040 | 5905 | 1584 | 1584 | 22.50% | 26.82% | 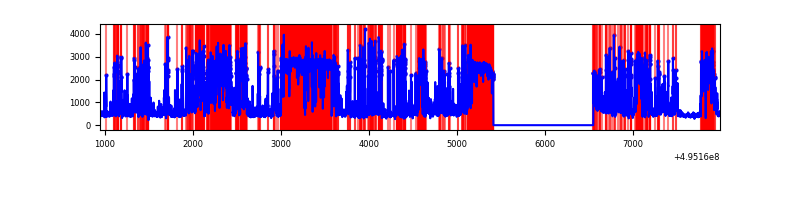 |
| D | 7041 | 5907 | 650 | 650 | 9.23% | 11.00% | 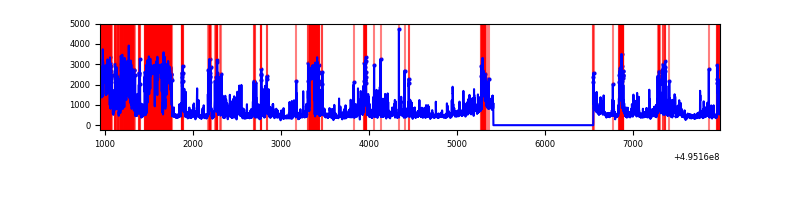 |
Top three noisy pixels from each quadrant. If the there are fewer than three noisy pixels in the level2.evt file, extra rows are filled as -1
| Pixel properties | Quadrant properties | ||||||
|---|---|---|---|---|---|---|---|
| Quadrant | DetID | PixID | Counts | Sigma | Mean | Median | Sigma |
| A | 0 | 8 | 88204 | 550.78 | 649 | 633 | 159.0 |
| A | 4 | 249 | 78749 | 491.31 | 649 | 633 | 159.0 |
| A | 8 | 249 | 65049 | 405.15 | 649 | 633 | 159.0 |
| B | 5 | 172 | 899745 | 6508.33 | 641 | 619 | 138.1 |
| B | 5 | 185 | 263402 | 1902.16 | 641 | 619 | 138.1 |
| B | 4 | 158 | 128801 | 927.85 | 641 | 619 | 138.1 |
| C | 1 | 241 | 3322616 | 22214.79 | 539 | 535 | 149.5 |
| C | 15 | 224 | 1242078 | 8302.21 | 539 | 535 | 149.5 |
| C | 10 | 171 | 296725 | 1980.62 | 539 | 535 | 149.5 |
| D | 15 | 93 | 2391713 | 14219.95 | 597 | 571 | 168.2 |
| D | 10 | 172 | 110321 | 652.68 | 597 | 571 | 168.2 |
| D | 3 | 224 | 101092 | 597.79 | 597 | 571 | 168.2 |
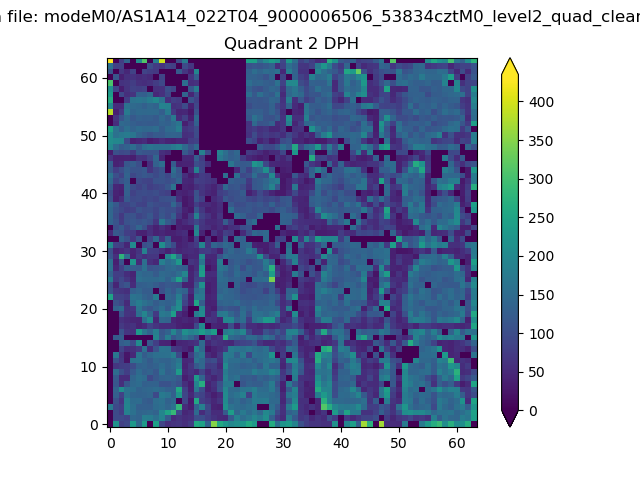
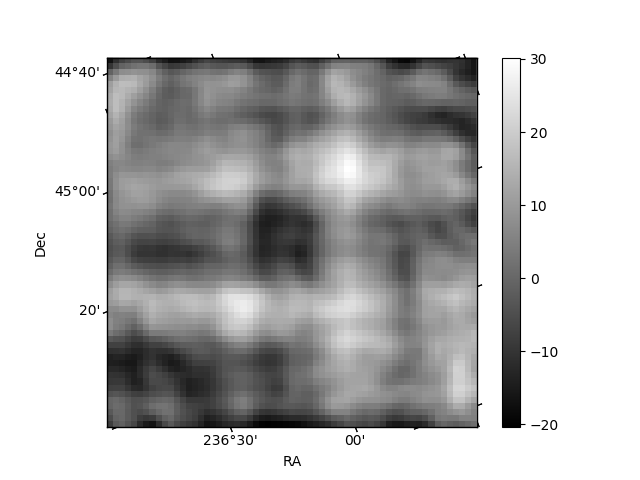
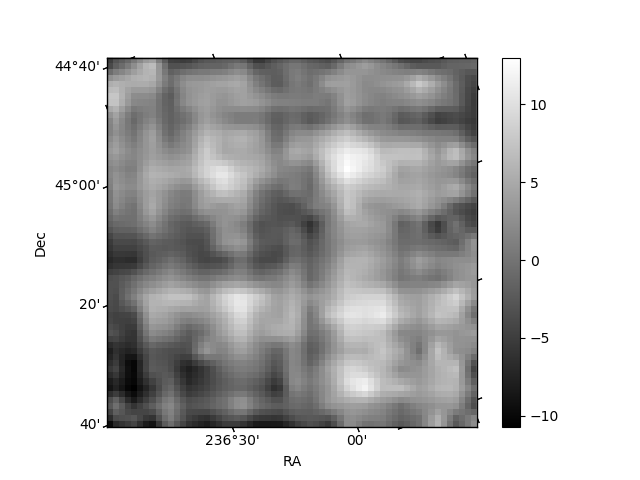
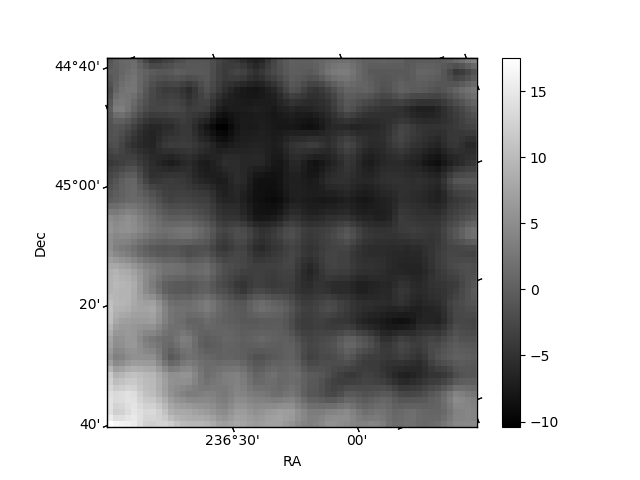
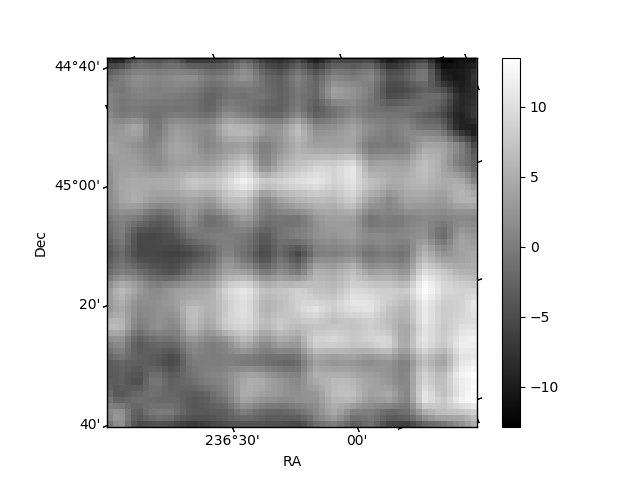
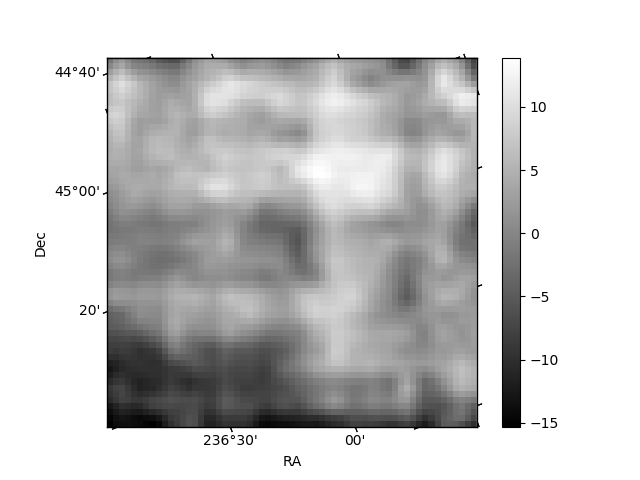
Histogram calculated using DETX and DETY for each event in the final _common_clean file
| Quadrant A | 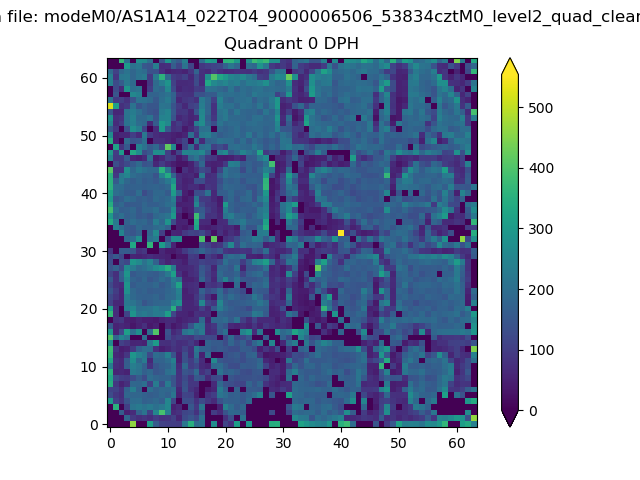 |
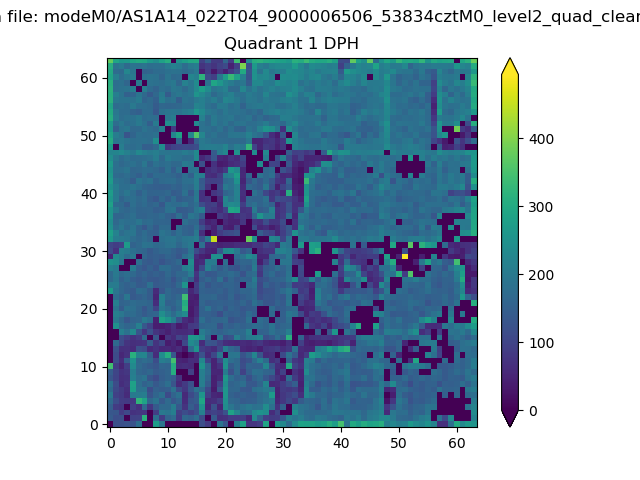 |
Quadrant B |
|---|---|---|---|
| Quadrant D | 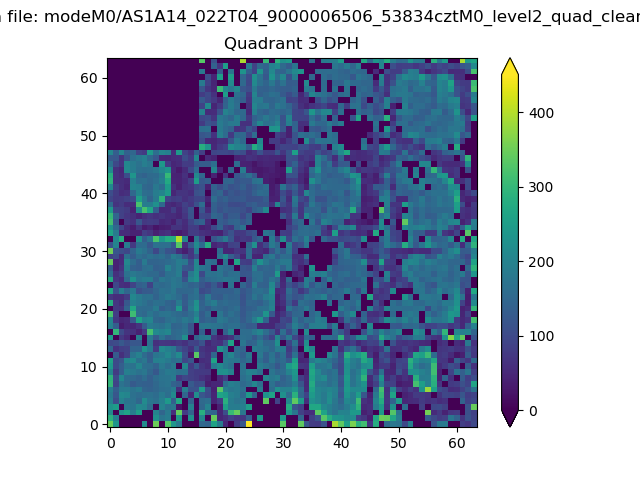 |
 |
Quadrant C |
| Plot type | Count rate plots | Images |
|---|---|---|
| Comparison with Poisson distribution Blue bars denote a histogram of data divided into 1 sec bins. Red curve is a Poisson curve with rate = median count rate of data. |
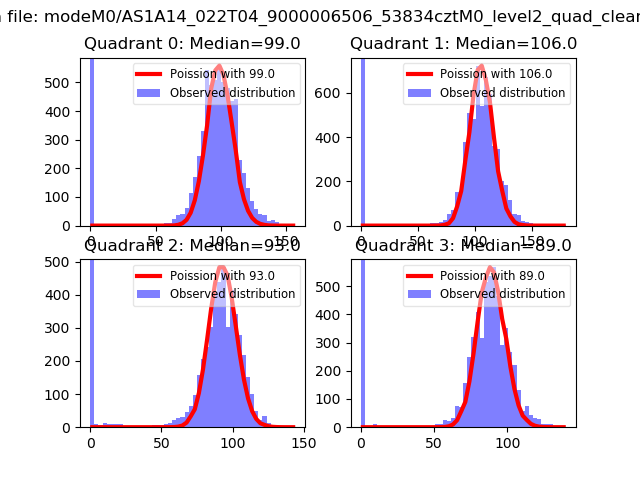 |
 |
| Quadrant-wise count rates Data is divided into 100 sec bins |
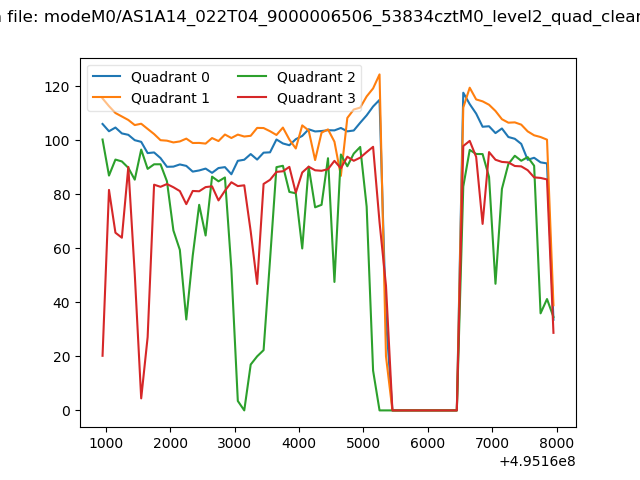 |
|
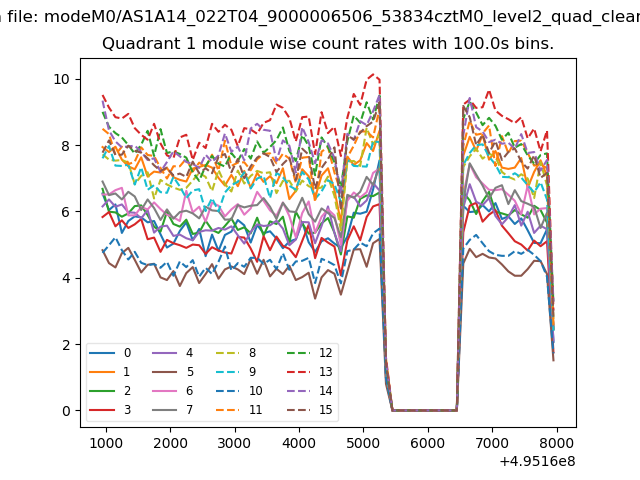
| Module-wise count rates for Quadrant A Data is divided into 100 sec bins |
 |
 |
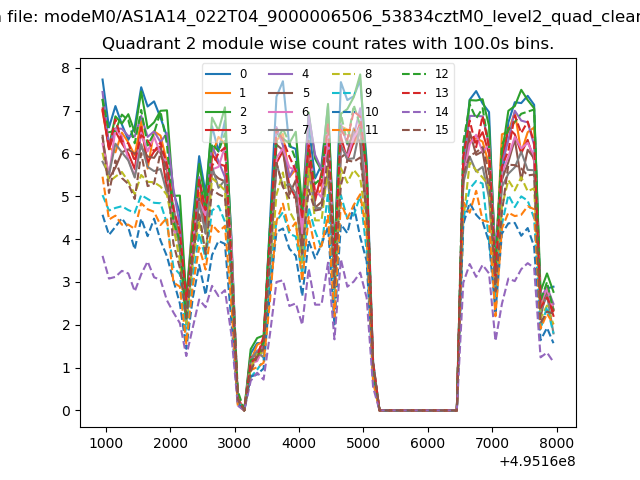
| Module-wise count rates for Quadrant B Data is divided into 100 sec bins |
 |
 |
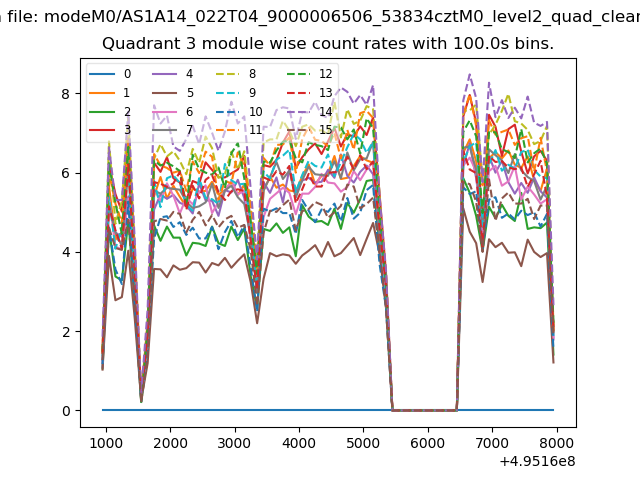
| Module-wise count rates for Quadrant C Data is divided into 100 sec bins |
 |
 |
| Module-wise count rates for Quadrant D Data is divided into 100 sec bins |
 |
 |
| Parameter | Plot |
|---|---|
| CZT HV Monitor | 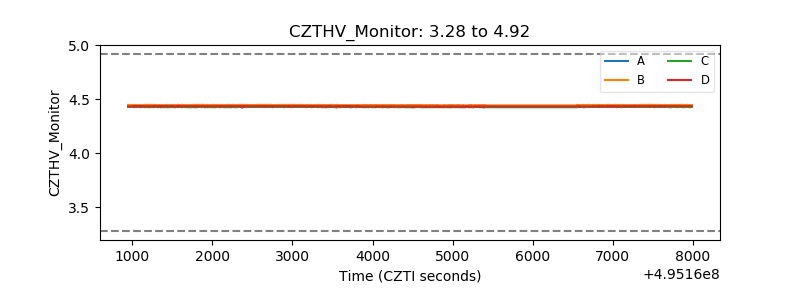 |
| D_VDD | 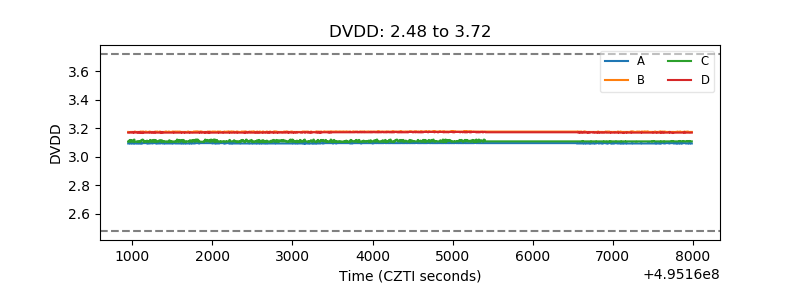 |
| Temperature 1 | 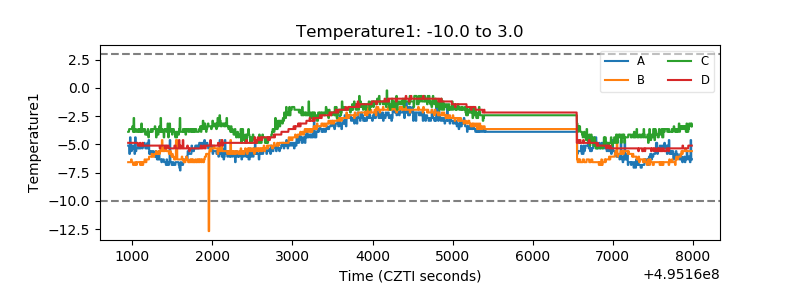 |
| Veto HV Monitor | 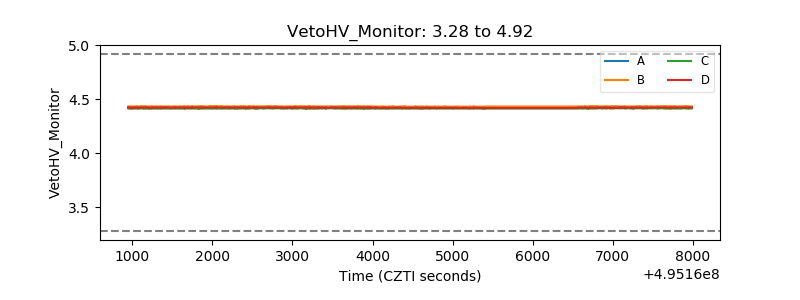 |
| Veto LLD | 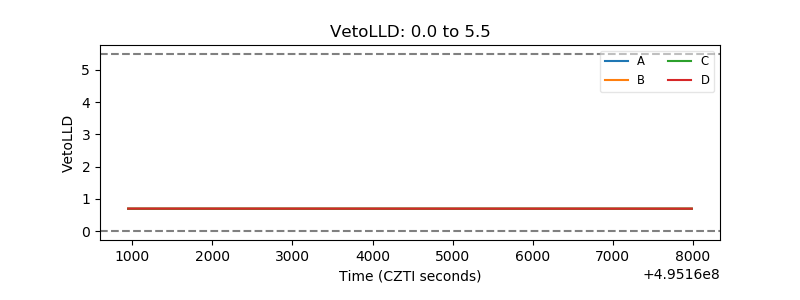 |
| Alpha Counter | 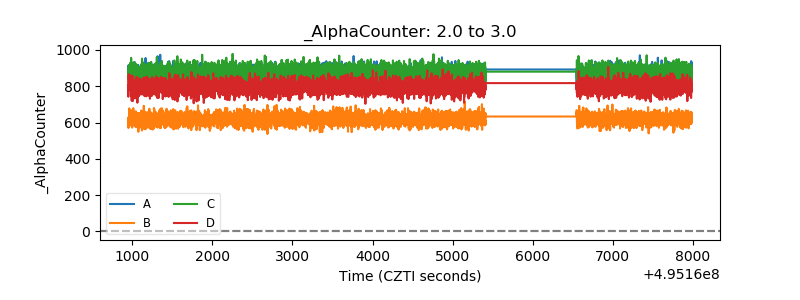 |
| _CPM_Rate | 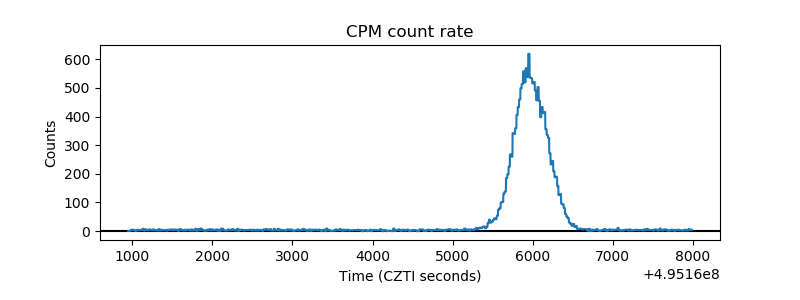 |
| CZT Counter | 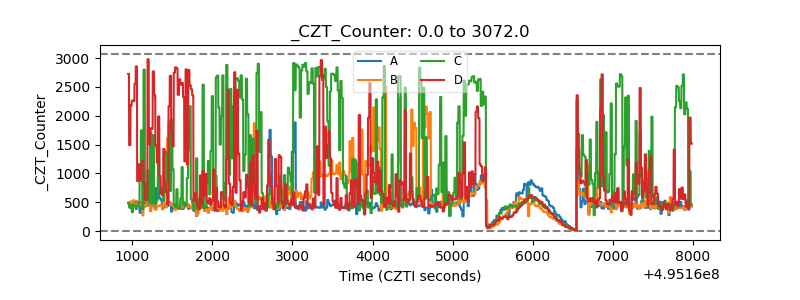 |
| +2.5 Volts monitor |  |
| +5 Volts monitor |  |
| _ROLL_ROT | 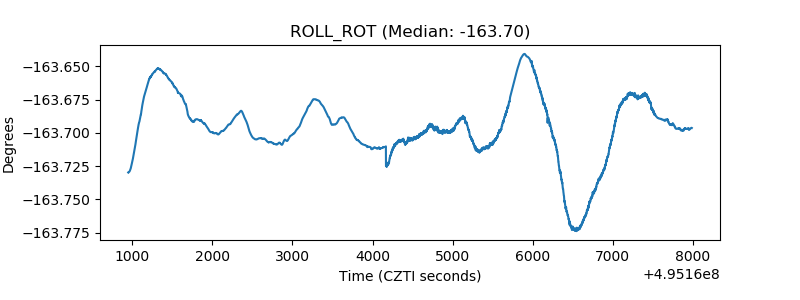 |
| _Roll_DEC | 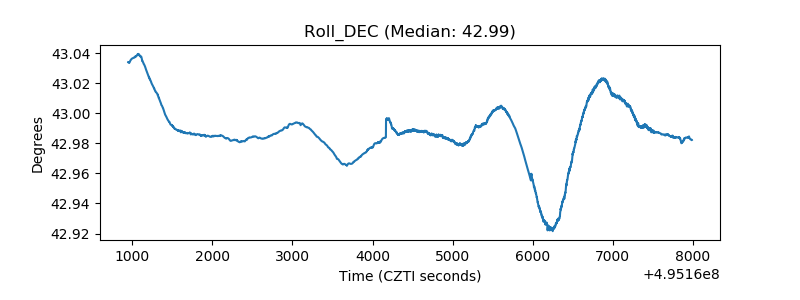 |
| _Roll_RA | 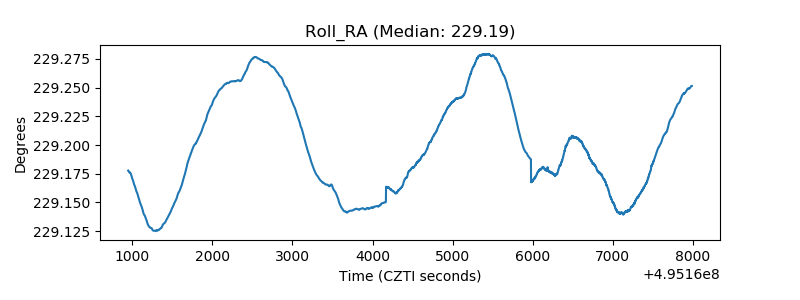 |
| Veto Counter | 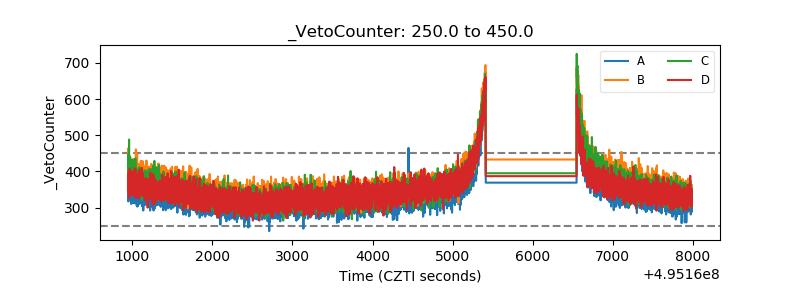 |