| Param | Original file | Final file |
|---|---|---|
| Filename | modeM0/AS1A14_022T04_9000006506_53835cztM0_level2.fits | modeM0/AS1A14_022T04_9000006506_53835cztM0_level2_quad_clean.evt |
| Size (bytes) | 517,170,240 | 95,791,680 |
| Size | 493.2 MB | 91.4 MB |
| Events in quadrant A | 3,170,995 | 643,272 |
| Events in quadrant B | 3,256,868 | 681,333 |
| Events in quadrant C | 5,864,604 | 560,249 |
| Events in quadrant D | 6,332,719 | 550,436 |
| Mode M0 | |||
|---|---|---|---|
| Quadrant | BADHDUFLAG | Total packets | Discarded packets |
| A | 0 | 14250 | 2 |
| B | 0 | 14511 | 2 |
| C | 0 | 22111 | 2 |
| D | 0 | 23434 | 2 |
| Mode SS | |||
|---|---|---|---|
| Quadrant | BADHDUFLAG | Total packets | Discarded packets |
| A | 0 | 134 | 0 |
| B | 0 | 134 | 0 |
| C | 0 | 134 | 0 |
| D | 0 | 134 | 0 |
| Mode M9 | |||
|---|---|---|---|
| Quadrant | BADHDUFLAG | Total packets | Discarded packets |
| A | 0 | 10 | 0 |
| B | 0 | 11 | 0 |
| C | 0 | 11 | 0 |
| D | 0 | 11 | 0 |
| Quadrant | Total seconds | Saturated seconds | Saturation percentage |
|---|---|---|---|
| A | 6679 | 156 | 2.335679% |
| B | 6679 | 195 | 2.919599% |
| C | 6679 | 815 | 12.202426% |
| D | 6679 | 580 | 8.683935% |
Noise dominated data is calculated using 1-second bins in cleaned event files. If a bin has >2000 counts, and if more than 50% of those come from <1% of pixels, then it is considered to be noise-dominated and hence unusable.
| Quadrant | # 1 sec bins | Bins with >0 counts | Bins with >2000 counts | High rate bins dominated by noise | Noise dominated (total time) | Noise dominated (detector-on time) | Marked lightcurve |
|---|---|---|---|---|---|---|---|
| A | 7644 | 6679 | 7 | 7 | 0.09% | 0.10% | 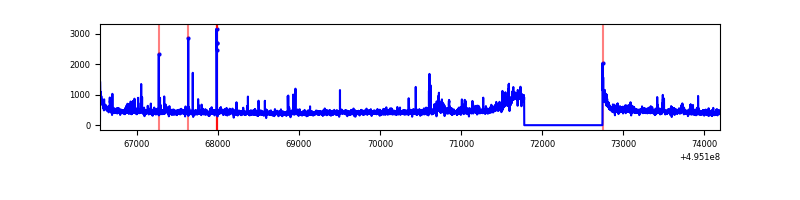 |
| B | 7644 | 6679 | 27 | 27 | 0.35% | 0.40% | 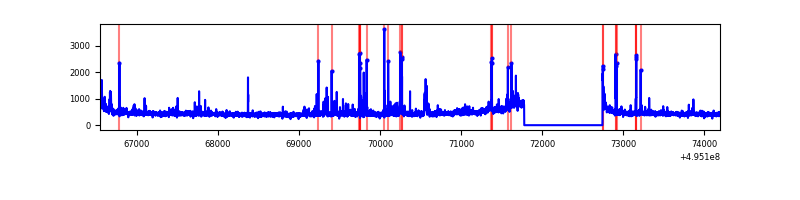 |
| C | 7644 | 6679 | 652 | 652 | 8.53% | 9.76% | 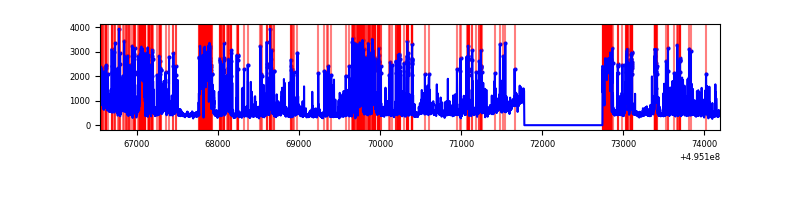 |
| D | 7644 | 6679 | 507 | 507 | 6.63% | 7.59% | 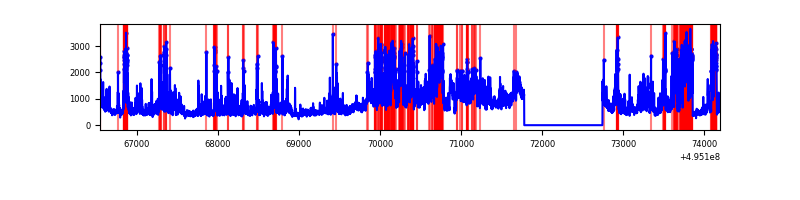 |
Top three noisy pixels from each quadrant. If the there are fewer than three noisy pixels in the level2.evt file, extra rows are filled as -1
| Pixel properties | Quadrant properties | ||||||
|---|---|---|---|---|---|---|---|
| Quadrant | DetID | PixID | Counts | Sigma | Mean | Median | Sigma |
| A | 8 | 249 | 53726 | 288.4 | 745 | 724 | 183.8 |
| A | 10 | 253 | 51858 | 278.23 | 745 | 724 | 183.8 |
| A | 8 | 6 | 51183 | 274.56 | 745 | 724 | 183.8 |
| B | 5 | 185 | 128228 | 814.82 | 732 | 704 | 156.5 |
| B | 8 | 234 | 54082 | 341.06 | 732 | 704 | 156.5 |
| B | 10 | 247 | 47407 | 298.41 | 732 | 704 | 156.5 |
| C | 15 | 224 | 1661706 | 8793.0 | 690 | 683 | 188.9 |
| C | 1 | 241 | 591636 | 3128.34 | 690 | 683 | 188.9 |
| C | 12 | 2 | 365301 | 1930.19 | 690 | 683 | 188.9 |
| D | 15 | 93 | 1990185 | 10165.41 | 696 | 665 | 195.7 |
| D | 10 | 172 | 980075 | 5004.27 | 696 | 665 | 195.7 |
| D | 2 | 172 | 326413 | 1664.4 | 696 | 665 | 195.7 |
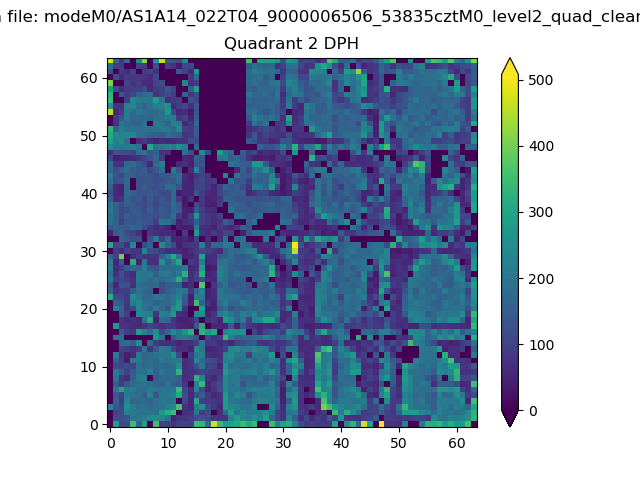
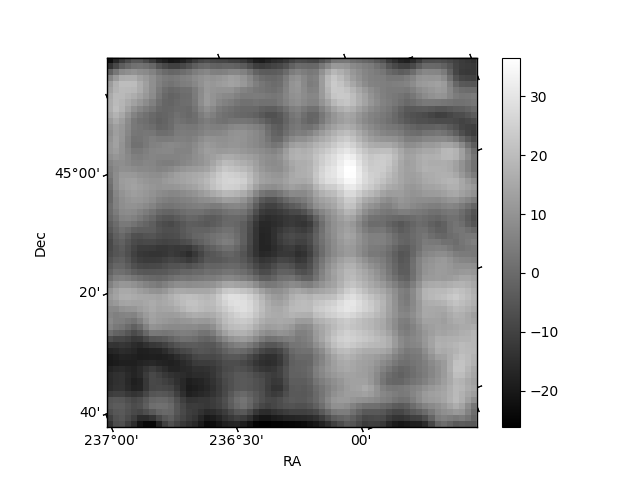
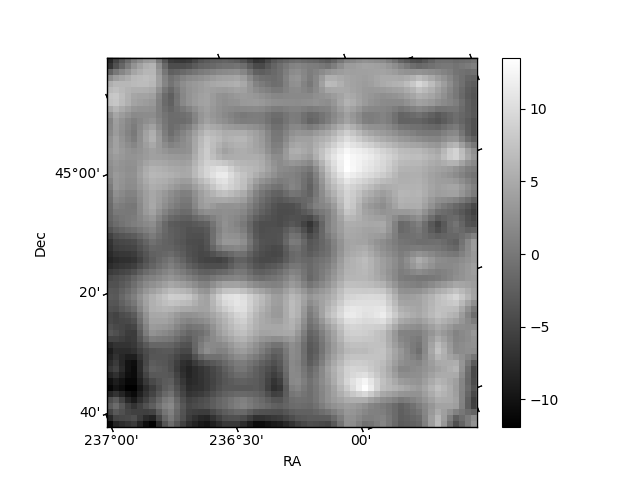
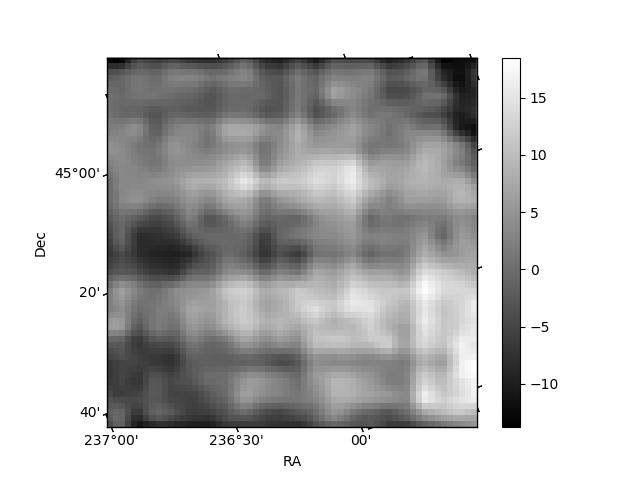
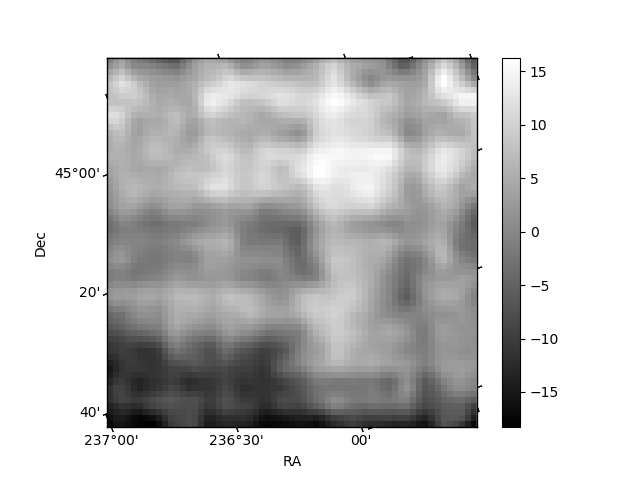
Histogram calculated using DETX and DETY for each event in the final _common_clean file
| Quadrant A | 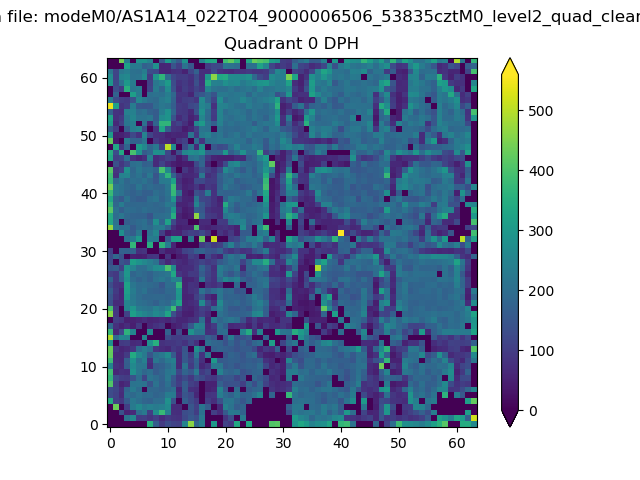 |
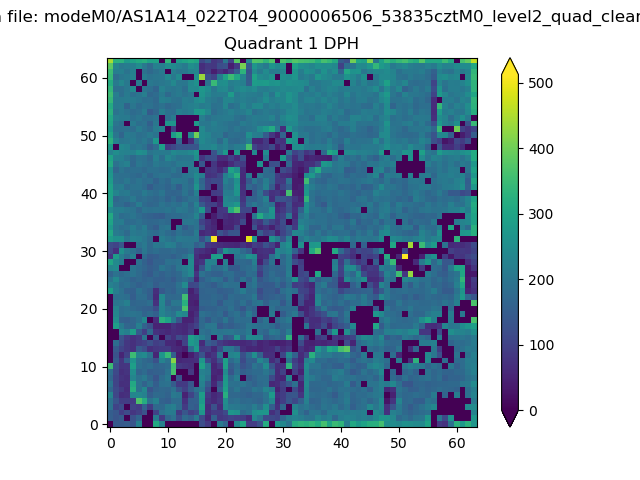 |
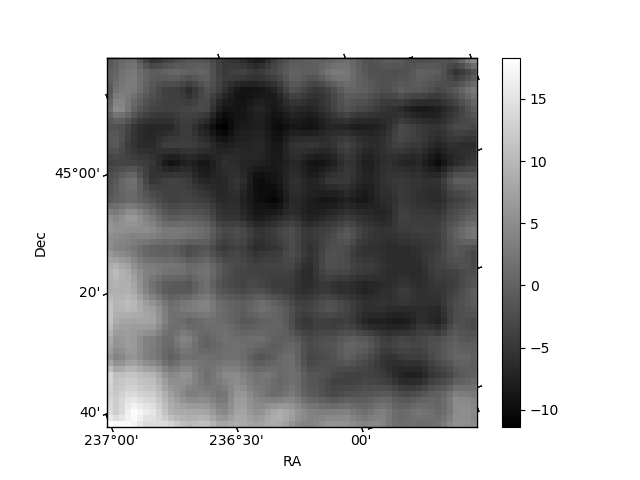
Quadrant B |
|---|---|---|---|
| Quadrant D | 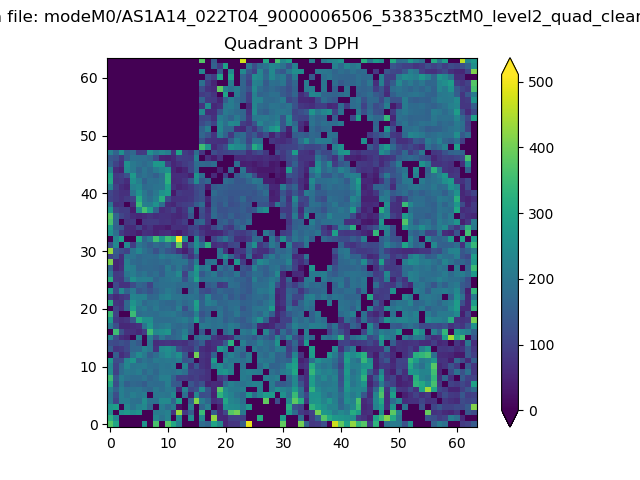 |
 |
Quadrant C |
| Plot type | Count rate plots | Images |
|---|---|---|
| Comparison with Poisson distribution Blue bars denote a histogram of data divided into 1 sec bins. Red curve is a Poisson curve with rate = median count rate of data. |
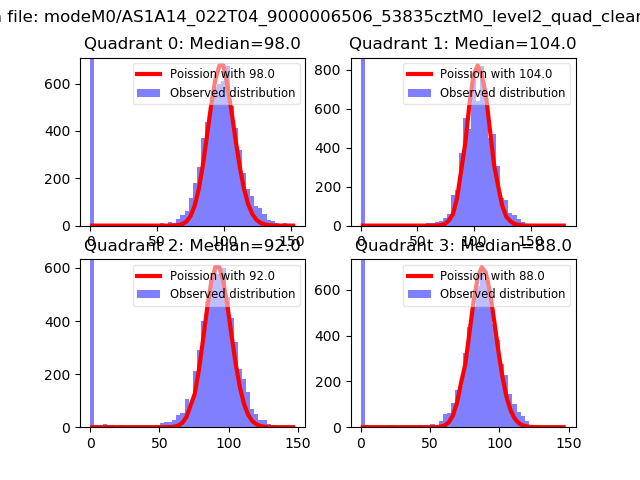 |
 |
| Quadrant-wise count rates Data is divided into 100 sec bins |
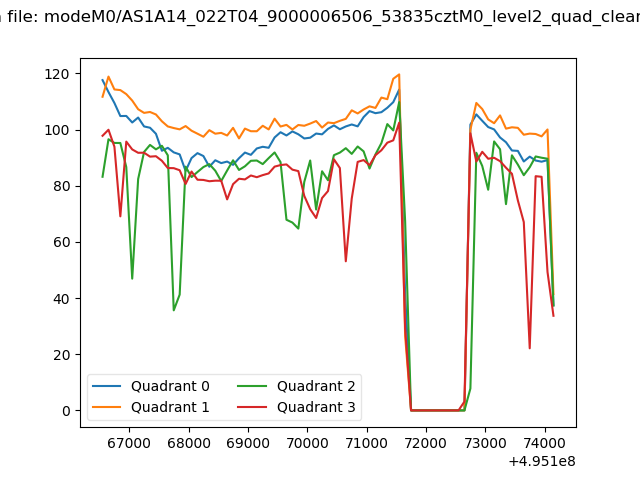 |
|
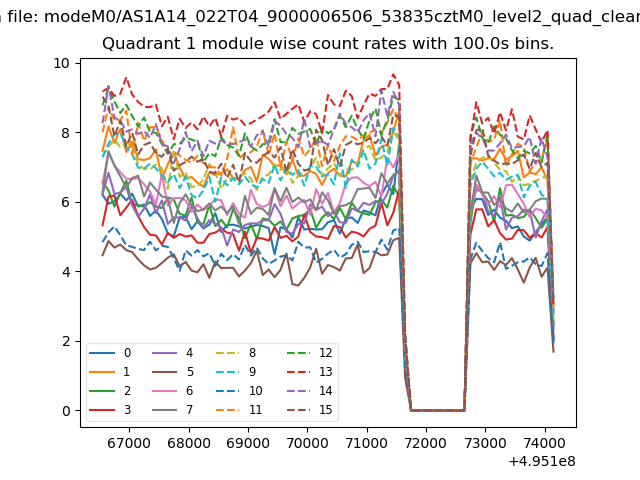
| Module-wise count rates for Quadrant A Data is divided into 100 sec bins |
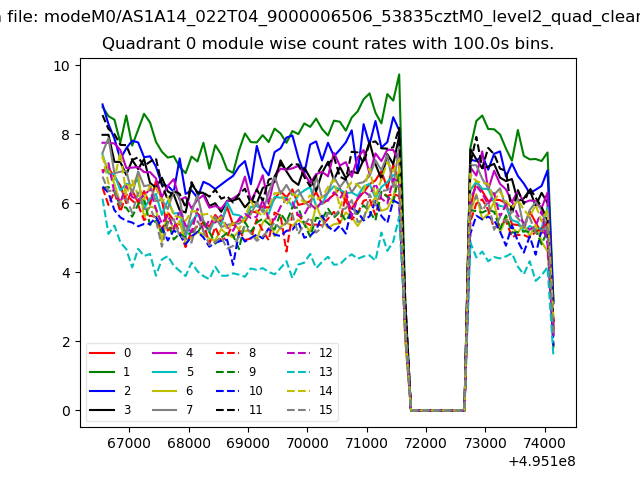 |
 |
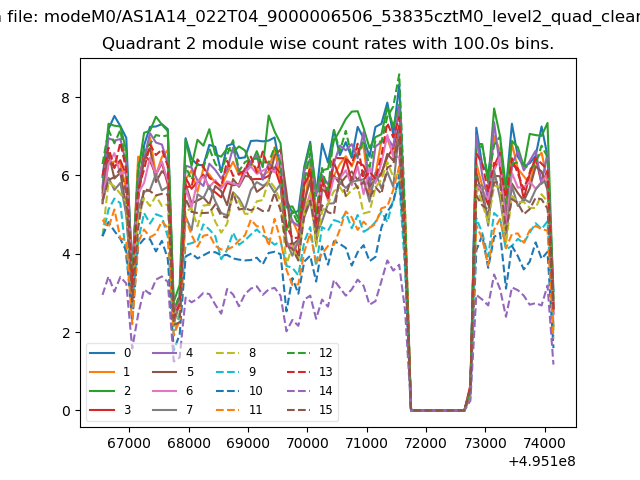
| Module-wise count rates for Quadrant B Data is divided into 100 sec bins |
 |
 |
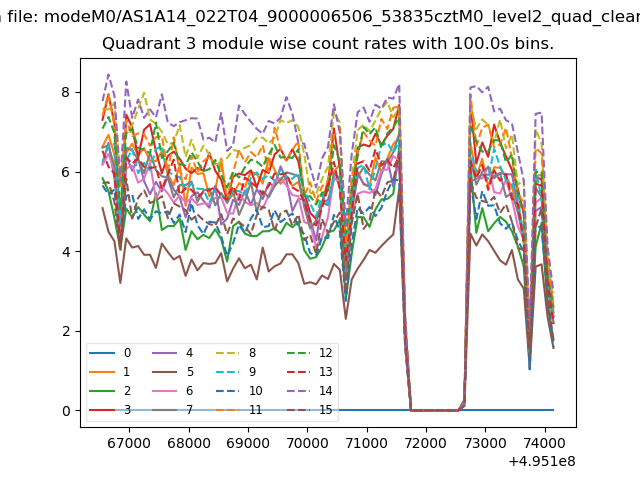
| Module-wise count rates for Quadrant C Data is divided into 100 sec bins |
 |
 |
| Module-wise count rates for Quadrant D Data is divided into 100 sec bins |
 |
 |
| Parameter | Plot |
|---|---|
| CZT HV Monitor | 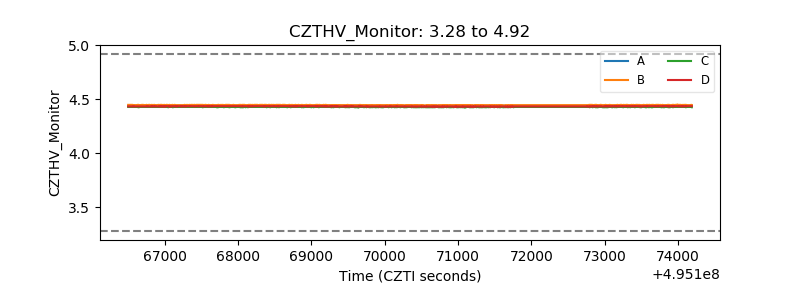 |
| D_VDD | 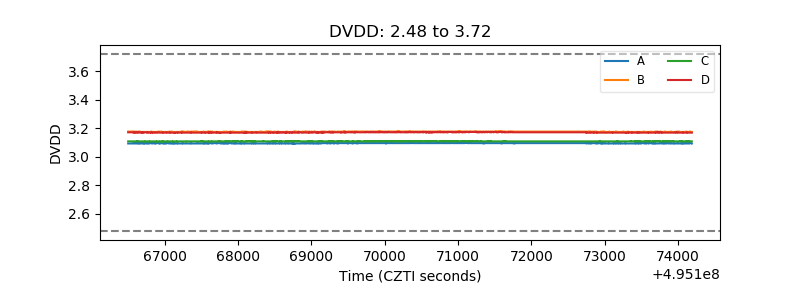 |
| Temperature 1 | 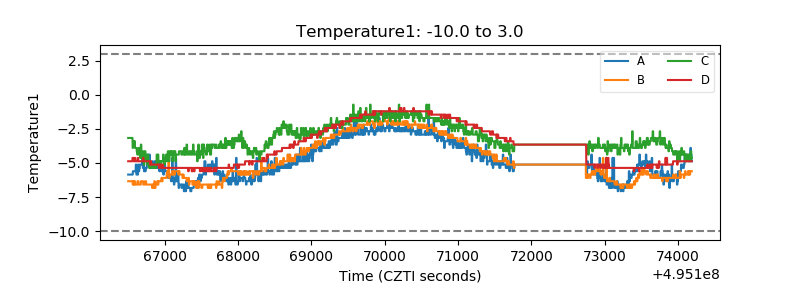 |
| Veto HV Monitor | 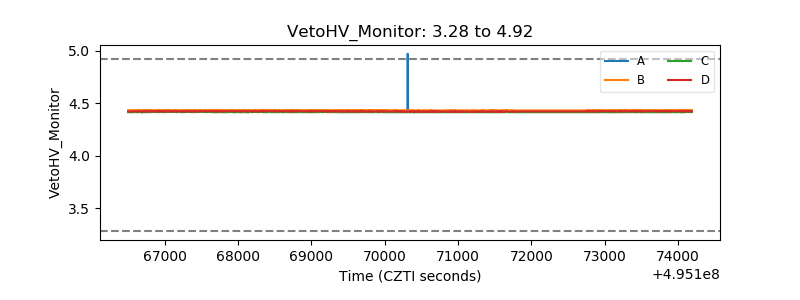 |
| Veto LLD | 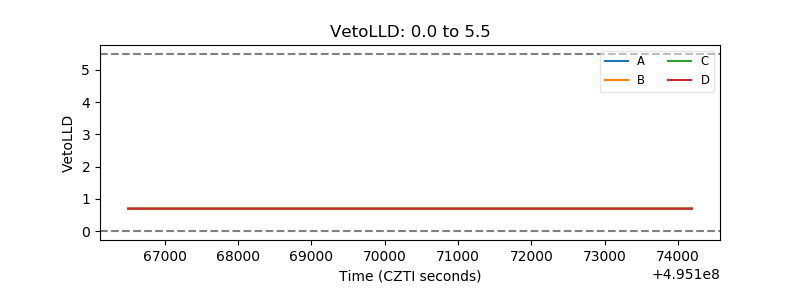 |
| Alpha Counter | 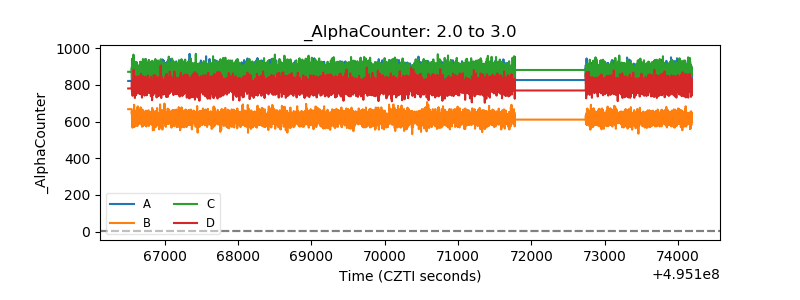 |
| _CPM_Rate | 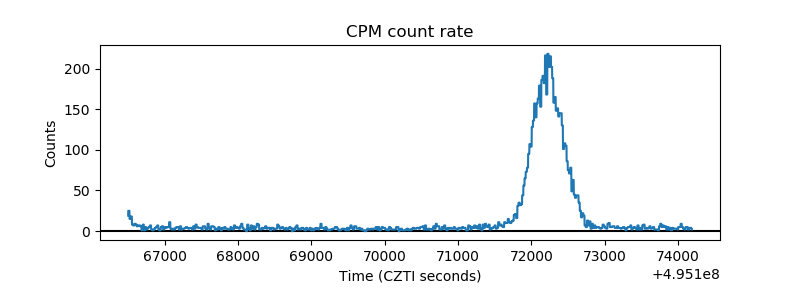 |
| CZT Counter | 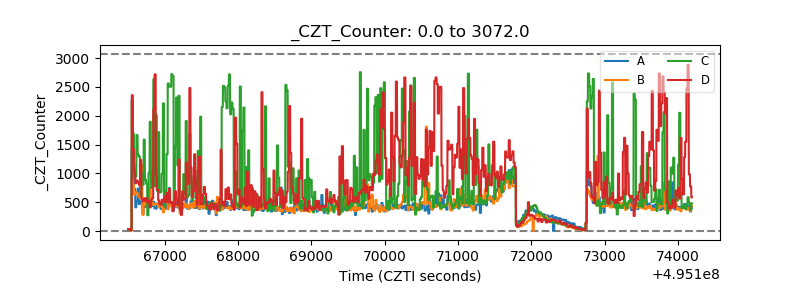 |
| +2.5 Volts monitor | 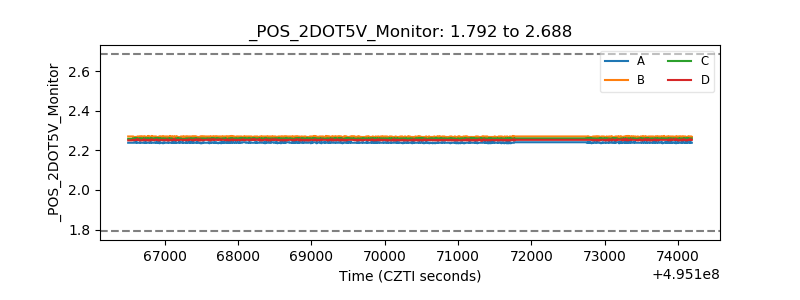 |
| +5 Volts monitor | 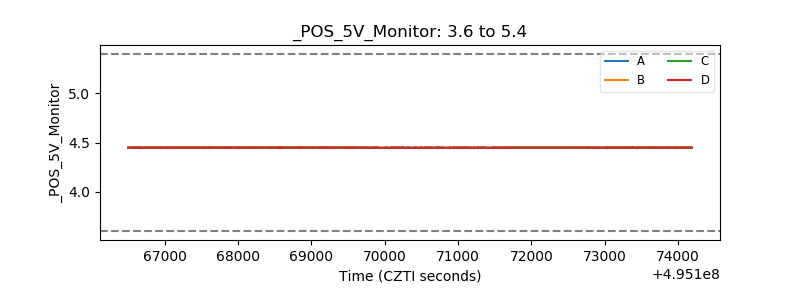 |
| _ROLL_ROT | 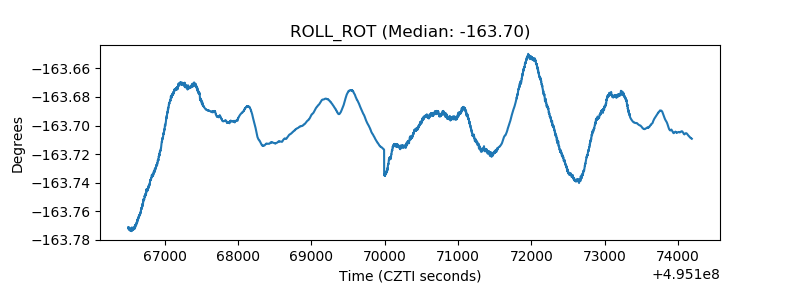 |
| _Roll_DEC | 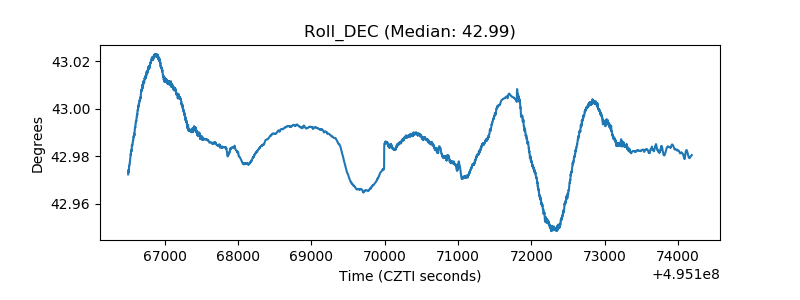 |
| _Roll_RA | 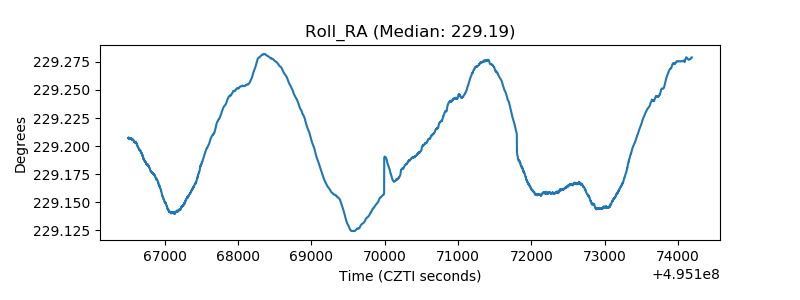 |
| Veto Counter | 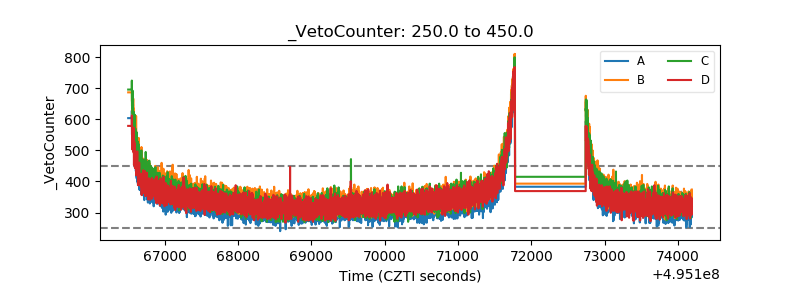 |