| Param | Original file | Final file |
|---|---|---|
| Filename | modeM0/AS1A14_022T04_9000006506_53836cztM0_level2.fits | modeM0/AS1A14_022T04_9000006506_53836cztM0_level2_quad_clean.evt |
| Size (bytes) | 347,304,960 | 57,072,960 |
| Size | 331.2 MB | 54.4 MB |
| Events in quadrant A | 2,063,200 | 391,944 |
| Events in quadrant B | 1,814,456 | 415,801 |
| Events in quadrant C | 3,694,067 | 336,855 |
| Events in quadrant D | 4,961,320 | 291,171 |
| Mode M0 | |||
|---|---|---|---|
| Quadrant | BADHDUFLAG | Total packets | Discarded packets |
| A | 0 | 9090 | 0 |
| B | 0 | 8630 | 0 |
| C | 0 | 13969 | 0 |
| D | 0 | 17637 | 0 |
| Mode SS | |||
|---|---|---|---|
| Quadrant | BADHDUFLAG | Total packets | Discarded packets |
| A | 0 | 84 | 0 |
| B | 0 | 84 | 0 |
| C | 0 | 84 | 0 |
| D | 0 | 84 | 0 |
| Quadrant | Total seconds | Saturated seconds | Saturation percentage |
|---|---|---|---|
| A | 4144 | 2 | 0.048263% |
| B | 4145 | 19 | 0.458384% |
| C | 4145 | 468 | 11.290712% |
| D | 4145 | 805 | 19.420989% |
Noise dominated data is calculated using 1-second bins in cleaned event files. If a bin has >2000 counts, and if more than 50% of those come from <1% of pixels, then it is considered to be noise-dominated and hence unusable.
| Quadrant | # 1 sec bins | Bins with >0 counts | Bins with >2000 counts | High rate bins dominated by noise | Noise dominated (total time) | Noise dominated (detector-on time) | Marked lightcurve |
|---|---|---|---|---|---|---|---|
| A | 4144 | 4144 | 3 | 3 | 0.07% | 0.07% | 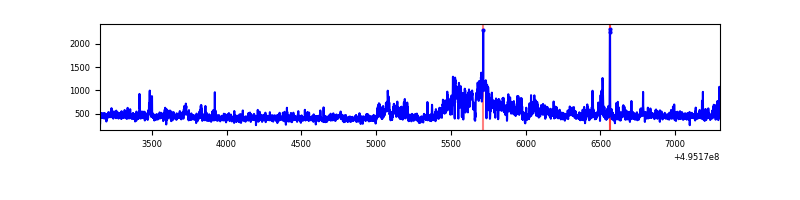 |
| B | 4145 | 4145 | 17 | 17 | 0.41% | 0.41% | 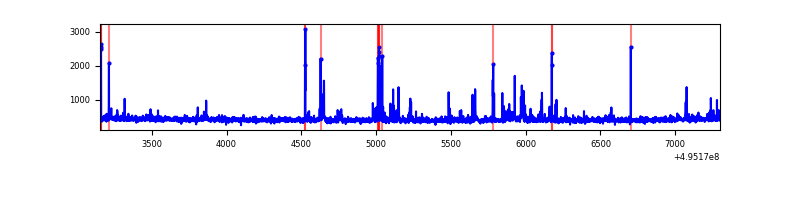 |
| C | 4145 | 4145 | 472 | 472 | 11.39% | 11.39% | 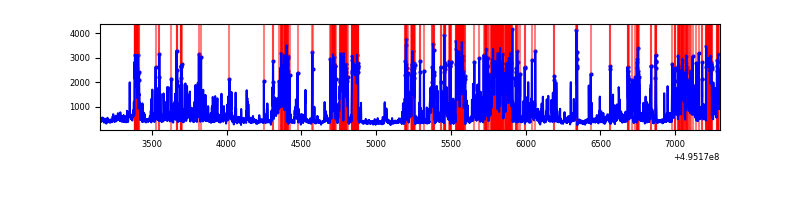 |
| D | 4144 | 4144 | 855 | 855 | 20.63% | 20.63% | 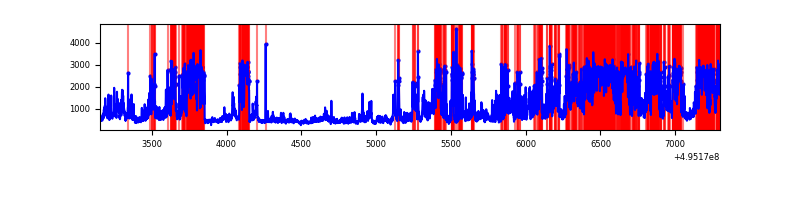 |
Top three noisy pixels from each quadrant. If the there are fewer than three noisy pixels in the level2.evt file, extra rows are filled as -1
| Pixel properties | Quadrant properties | ||||||
|---|---|---|---|---|---|---|---|
| Quadrant | DetID | PixID | Counts | Sigma | Mean | Median | Sigma |
| A | 8 | 249 | 303155 | 2872.68 | 422 | 410 | 105.4 |
| A | 8 | 6 | 61134 | 576.2 | 422 | 410 | 105.4 |
| A | 8 | 206 | 17087 | 158.24 | 422 | 410 | 105.4 |
| B | 5 | 185 | 42957 | 472.29 | 415 | 401 | 90.1 |
| B | 10 | 247 | 37869 | 415.83 | 415 | 401 | 90.1 |
| B | 8 | 234 | 26730 | 292.2 | 415 | 401 | 90.1 |
| C | 1 | 241 | 948153 | 8797.02 | 388 | 384 | 107.7 |
| C | 15 | 224 | 844257 | 7832.67 | 388 | 384 | 107.7 |
| C | 12 | 252 | 120765 | 1117.35 | 388 | 384 | 107.7 |
| D | 15 | 93 | 2007364 | 18848.52 | 372 | 355 | 106.5 |
| D | 8 | 176 | 579207 | 5436.2 | 372 | 355 | 106.5 |
| D | 2 | 172 | 535652 | 5027.16 | 372 | 355 | 106.5 |
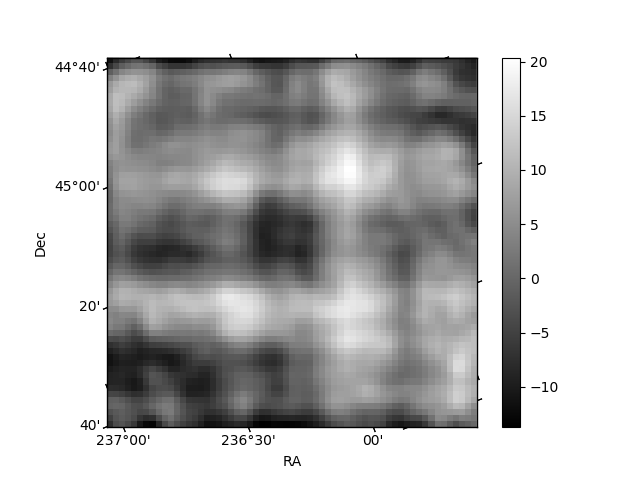
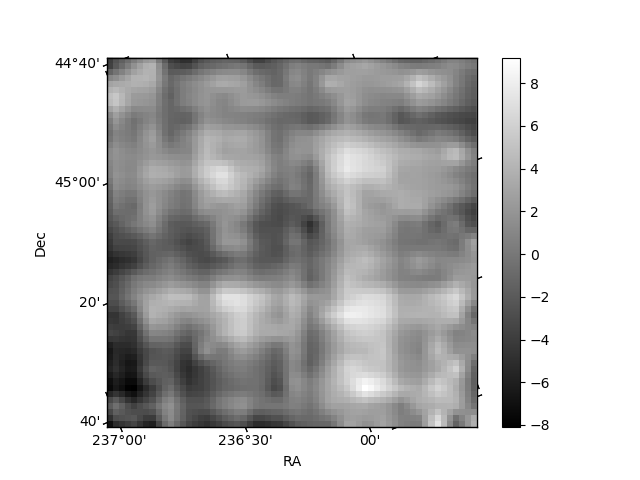
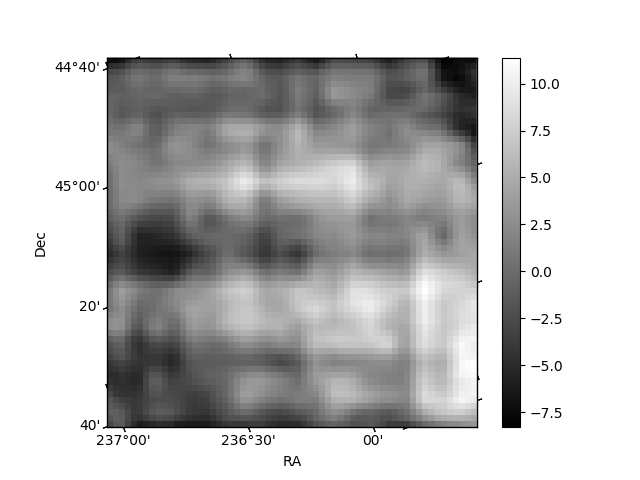
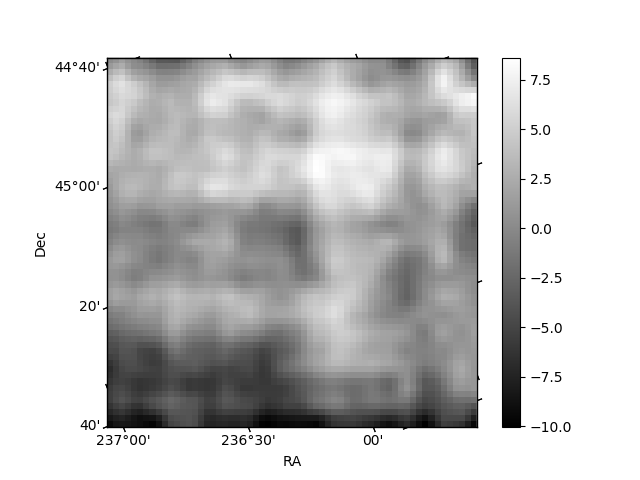
Histogram calculated using DETX and DETY for each event in the final _common_clean file
| Quadrant A | 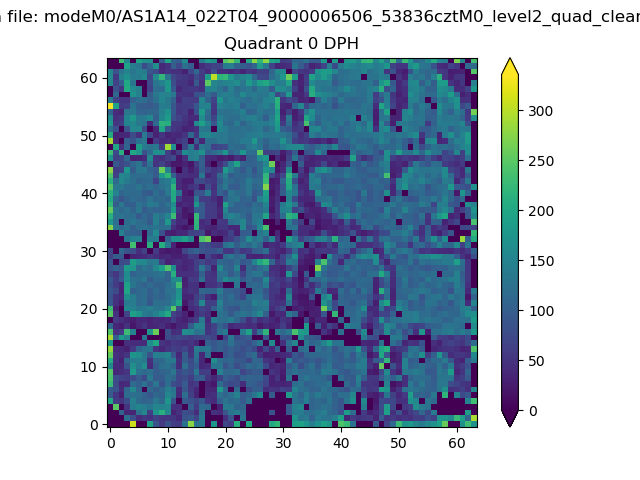 |
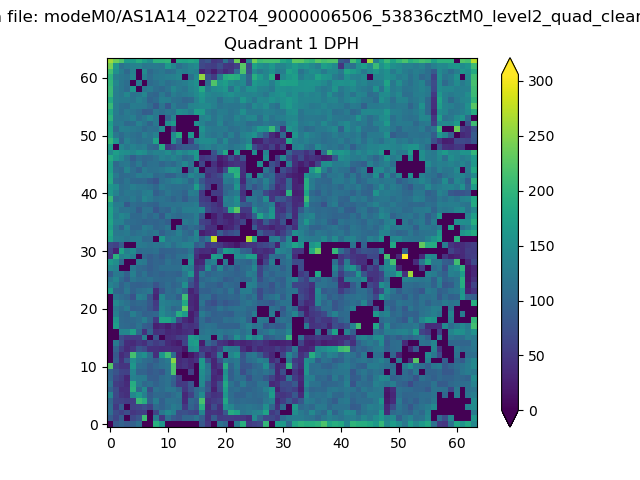 |
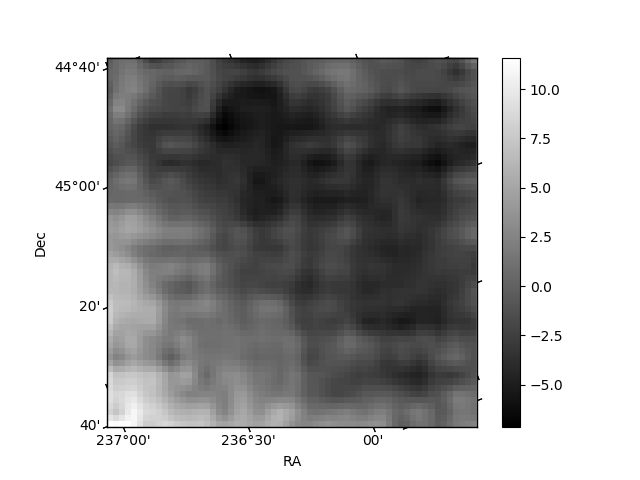
Quadrant B |
|---|---|---|---|
| Quadrant D | 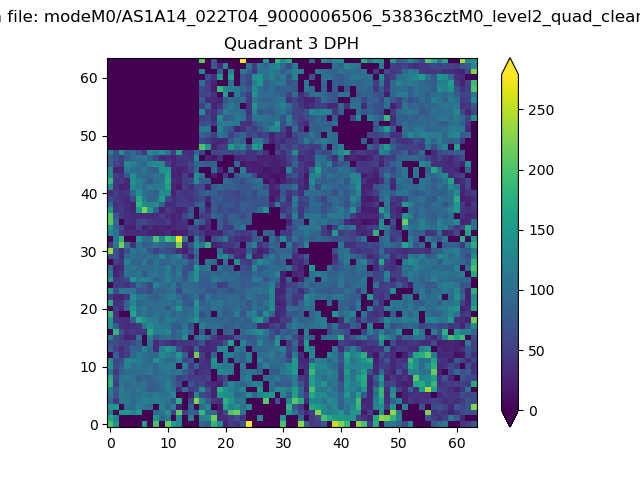 |
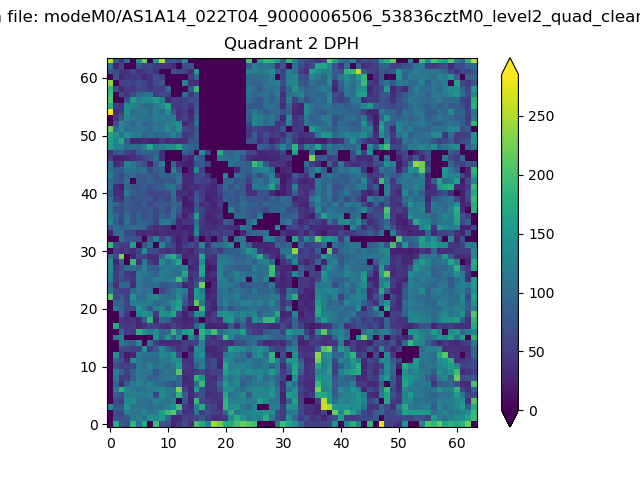 |
Quadrant C |
| Plot type | Count rate plots | Images |
|---|---|---|
| Comparison with Poisson distribution Blue bars denote a histogram of data divided into 1 sec bins. Red curve is a Poisson curve with rate = median count rate of data. |
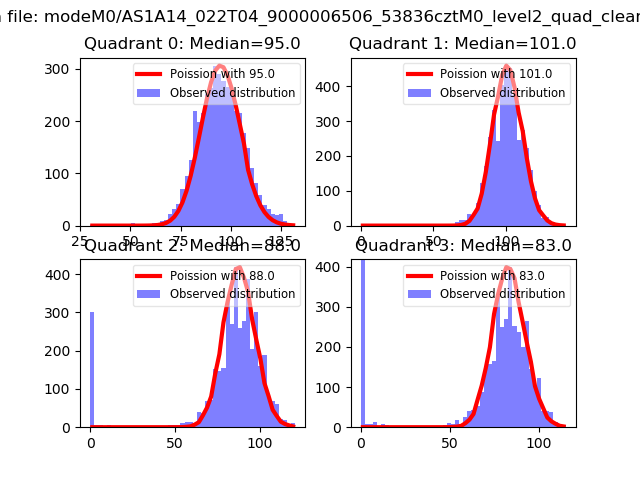 |
 |
| Quadrant-wise count rates Data is divided into 100 sec bins |
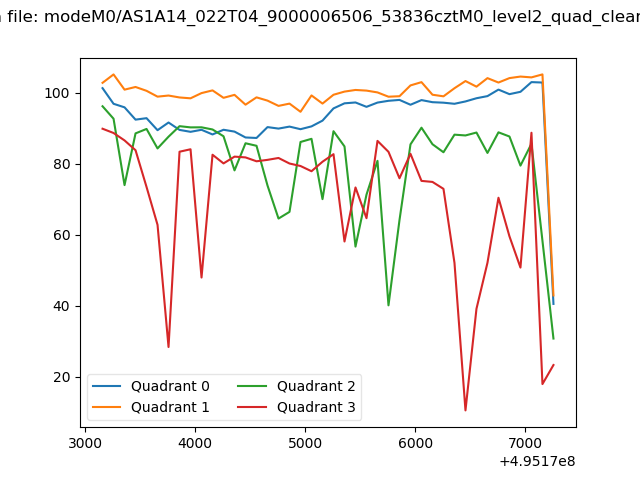 |
|
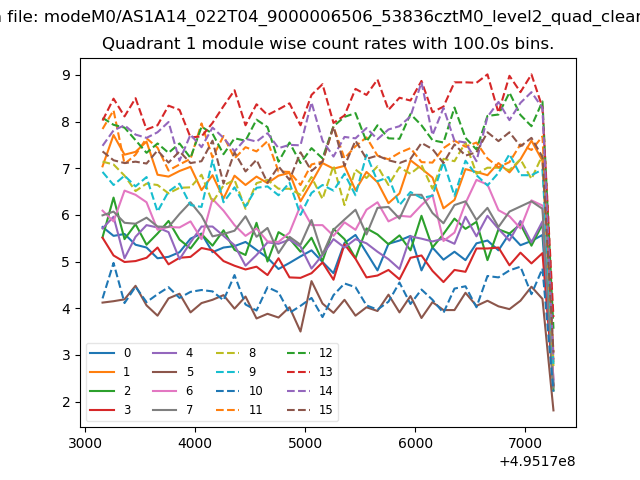
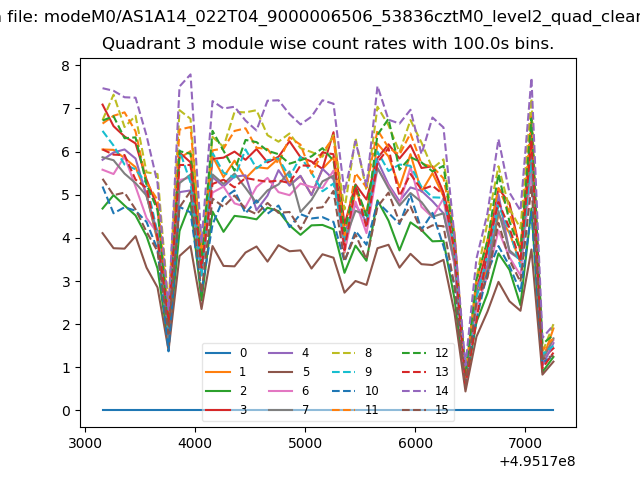
| Module-wise count rates for Quadrant A Data is divided into 100 sec bins |
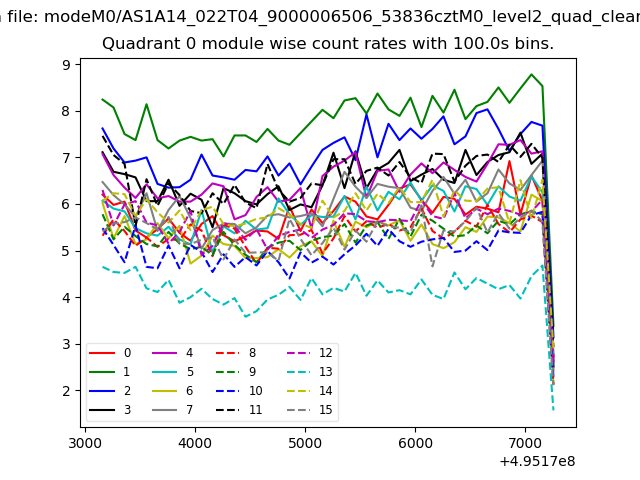 |
 |
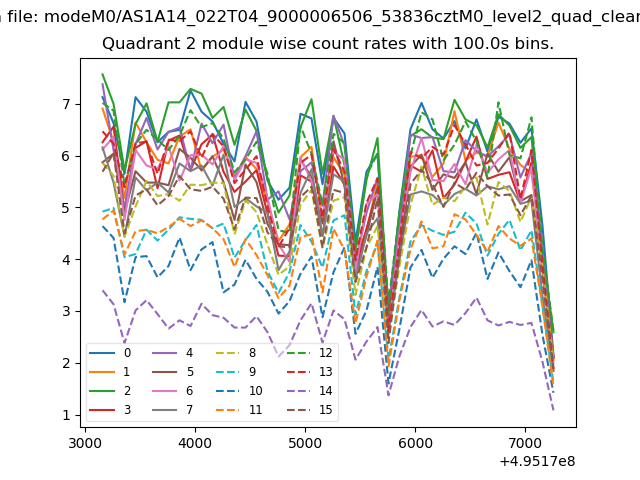
| Module-wise count rates for Quadrant B Data is divided into 100 sec bins |
 |
 |
| Module-wise count rates for Quadrant C Data is divided into 100 sec bins |
 |
 |
| Module-wise count rates for Quadrant D Data is divided into 100 sec bins |
 |
 |
| Parameter | Plot |
|---|---|
| CZT HV Monitor | 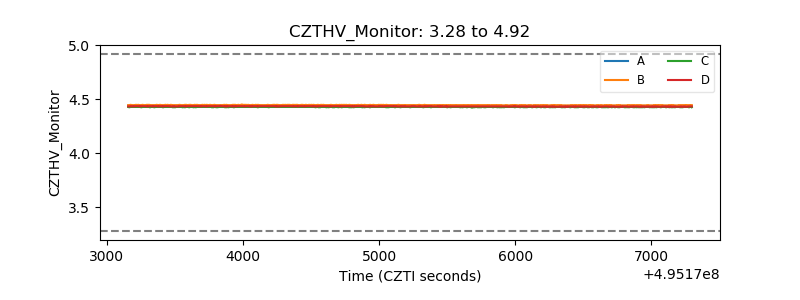 |
| D_VDD | 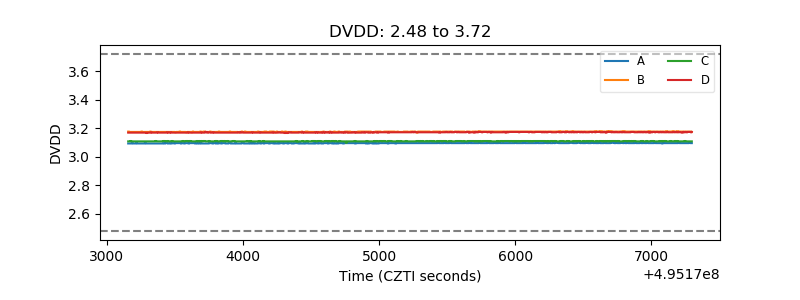 |
| Temperature 1 | 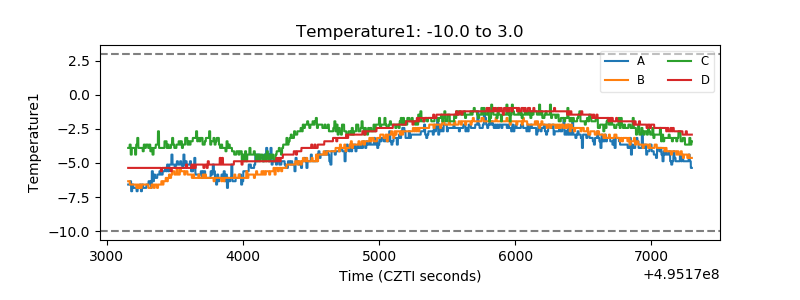 |
| Veto HV Monitor | 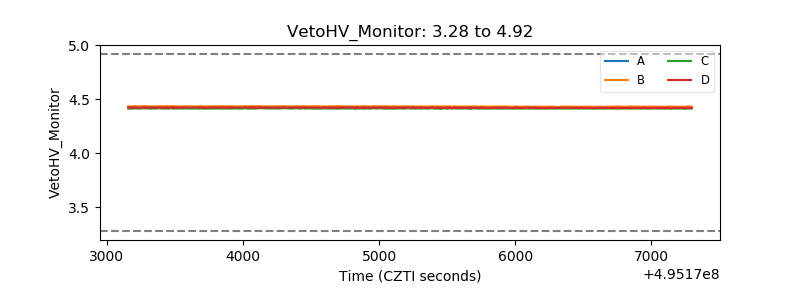 |
| Veto LLD | 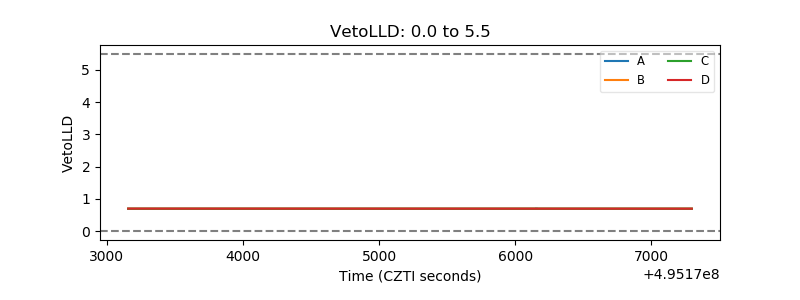 |
| Alpha Counter | 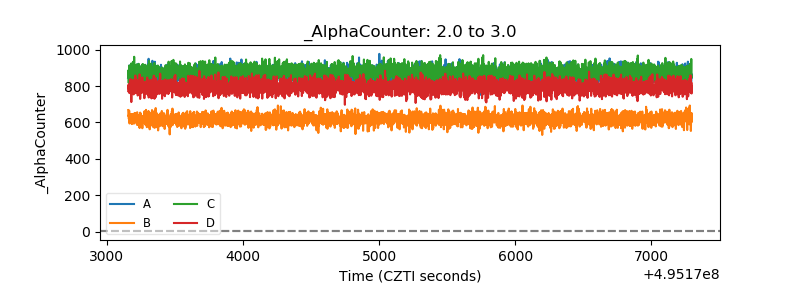 |
| _CPM_Rate | 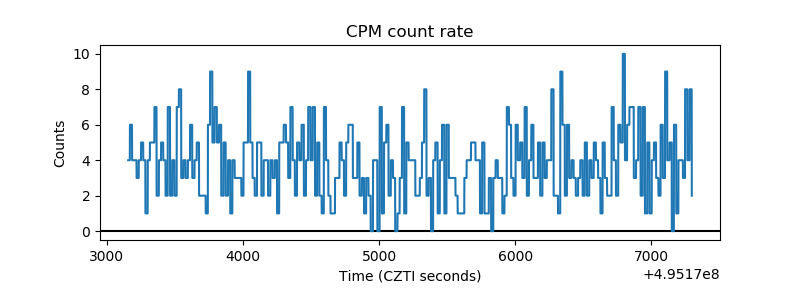 |
| CZT Counter | 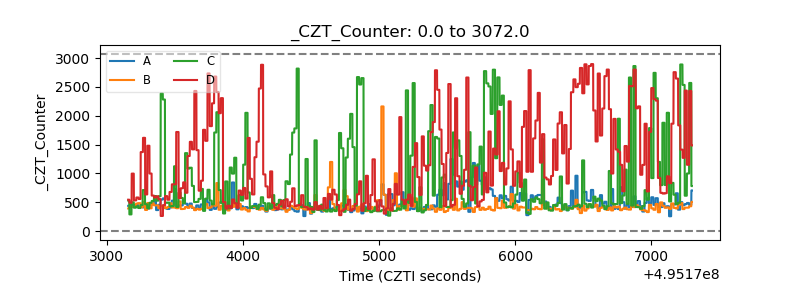 |
| +2.5 Volts monitor | 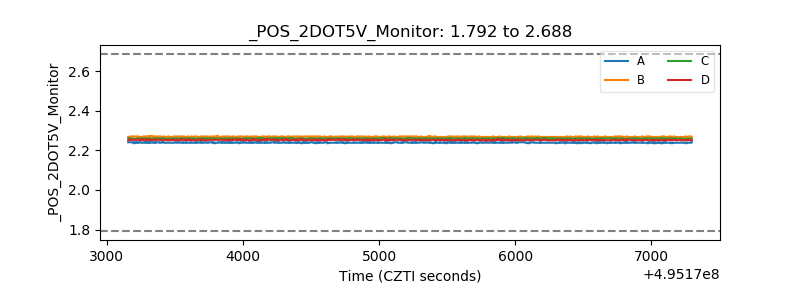 |
| +5 Volts monitor | 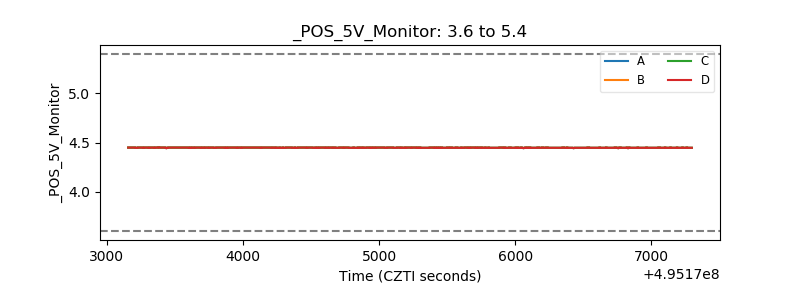 |
| _ROLL_ROT | 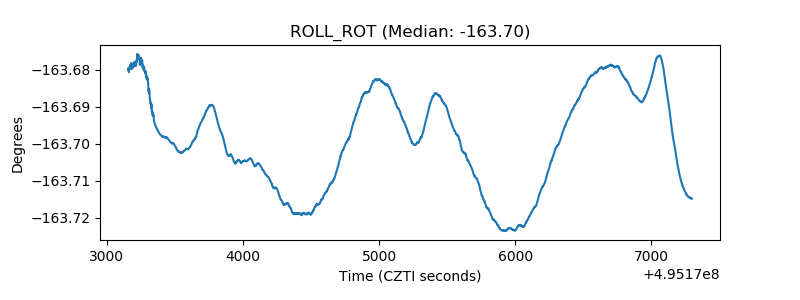 |
| _Roll_DEC | 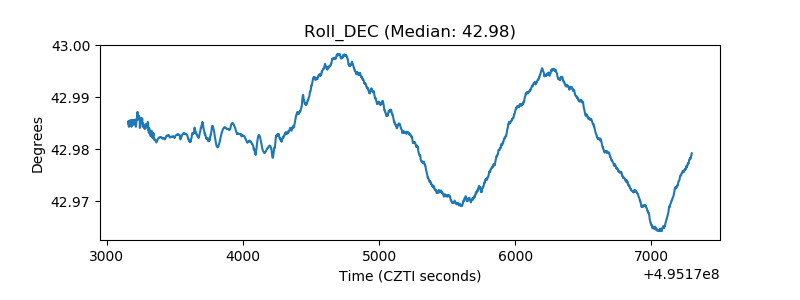 |
| _Roll_RA | 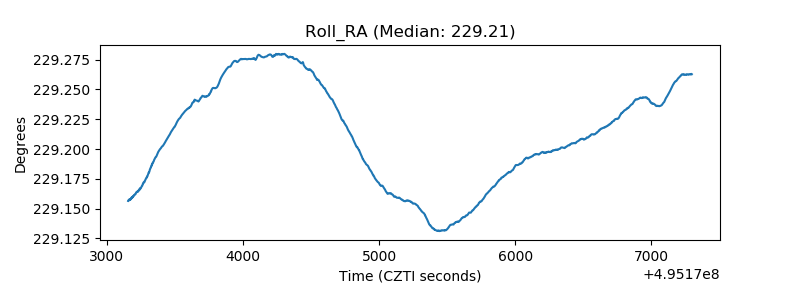 |
| Veto Counter | 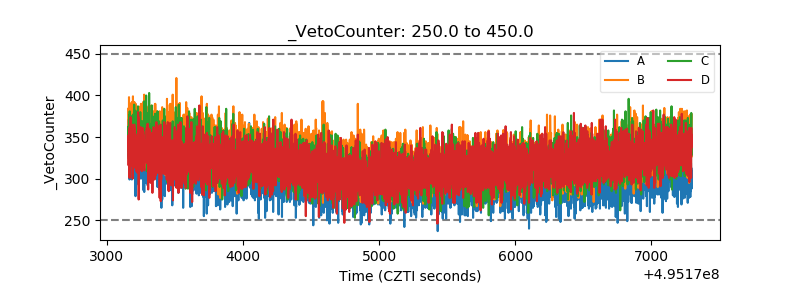 |