| Param | Original file | Final file |
|---|---|---|
| Filename | modeM0/AS1A14_057T04_9000006508cztM0_level2.fits | modeM0/AS1A14_057T04_9000006508cztM0_level2_quad_clean.evt |
| Size (bytes) | 8,150,172,480 | 2,197,264,320 |
| Size | 7.6 GB | 2.0 GB |
| Events in quadrant A | 65,239,304 | 7,439,666 |
| Events in quadrant B | 64,912,757 | 7,207,912 |
| Events in quadrant C | 56,377,738 | 5,857,022 |
| Events in quadrant D | 16,785,237 | 2,661,989 |
| Mode M0 | |||
|---|---|---|---|
| Quadrant | BADHDUFLAG | Total packets | Discarded packets |
| A | 0 | 1525938 | 0 |
| B | 0 | 1564928 | 0 |
| C | 0 | 2373016 | 0 |
| D | 0 | 3511031 | 0 |
| Mode SS | |||
|---|---|---|---|
| Quadrant | BADHDUFLAG | Total packets | Discarded packets |
| A | 0 | 12647 | 0 |
| B | 0 | 12636 | 0 |
| C | 0 | 12714 | 0 |
| D | 0 | 12622 | 0 |
| Mode M9 | |||
|---|---|---|---|
| Quadrant | BADHDUFLAG | Total packets | Discarded packets |
| A | 0 | 769 | 0 |
| B | 0 | 763 | 0 |
| C | 0 | 769 | 0 |
| D | 0 | 762 | 0 |
| Quadrant | Total seconds | Saturated seconds | Saturation percentage |
|---|---|---|---|
| A | 633991 | 20534 | 3.238847% |
| B | 634179 | 25461 | 4.014797% |
| C | 632715 | 118818 | 18.779071% |
| D | 633103 | 320775 | 50.667111% |
Noise dominated data is calculated using 1-second bins in cleaned event files. If a bin has >2000 counts, and if more than 50% of those come from <1% of pixels, then it is considered to be noise-dominated and hence unusable.
| Quadrant | # 1 sec bins | Bins with >0 counts | Bins with >2000 counts | High rate bins dominated by noise | Noise dominated (total time) | Noise dominated (detector-on time) | Marked lightcurve |
|---|---|---|---|---|---|---|---|
| A | 763263 | 635987 | 0 | 0 | 0.00% | 0.00% | 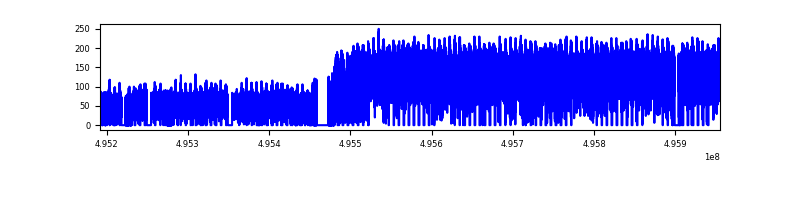 |
| B | 763263 | 636403 | 0 | 0 | 0.00% | 0.00% | 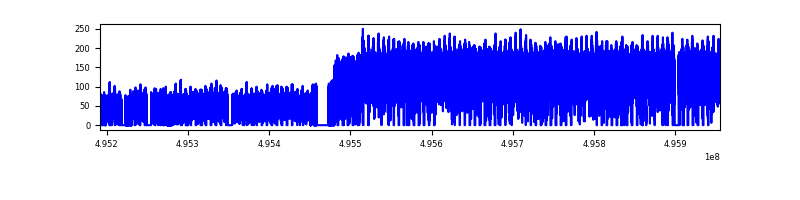 |
| C | 763263 | 632592 | 0 | 0 | 0.00% | 0.00% | 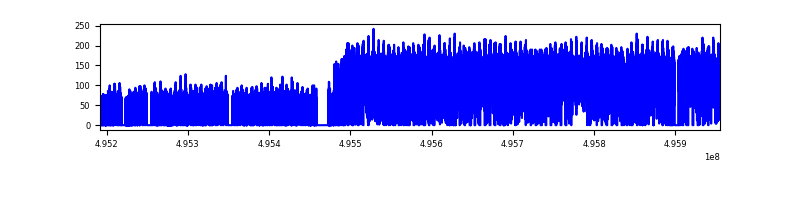 |
| D | 763264 | 553629 | 0 | 0 | 0.00% | 0.00% | 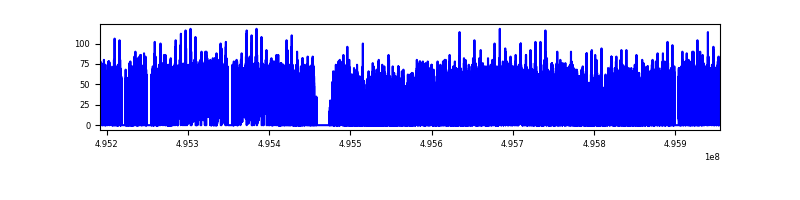 |
Top three noisy pixels from each quadrant. If the there are fewer than three noisy pixels in the level2.evt file, extra rows are filled as -1
| Pixel properties | Quadrant properties | ||||||
|---|---|---|---|---|---|---|---|
| Quadrant | DetID | PixID | Counts | Sigma | Mean | Median | Sigma |
| A | 14 | 188 | 47665 | 7.28 | 17346 | 16571 | 4269.2 |
| A | 9 | 255 | 41610 | 5.86 | 17346 | 16571 | 4269.2 |
| A | 14 | 204 | 41259 | 5.78 | 17346 | 16571 | 4269.2 |
| B | 2 | 9 | 45249 | 7.64 | 17487 | 16900 | 3712.1 |
| B | 2 | 8 | 38408 | 5.79 | 17487 | 16900 | 3712.1 |
| B | 5 | 63 | 38169 | 5.73 | 17487 | 16900 | 3712.1 |
| C | 6 | 179 | 42793 | 6.69 | 15263 | 14653 | 4207.4 |
| C | -1 | -1 | -1 | -1.0 | 15263 | 14653 | 4207.4 |
| C | -1 | -1 | -1 | -1.0 | 15263 | 14653 | 4207.4 |
| D | 6 | 218 | 21756 | 10.85 | 4809 | 4257 | 1612.5 |
| D | 15 | 11 | 16258 | 7.44 | 4809 | 4257 | 1612.5 |
| D | 3 | 30 | 14942 | 6.63 | 4809 | 4257 | 1612.5 |
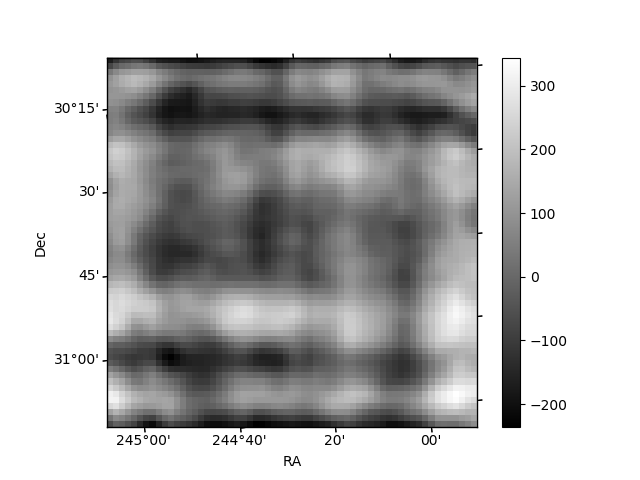
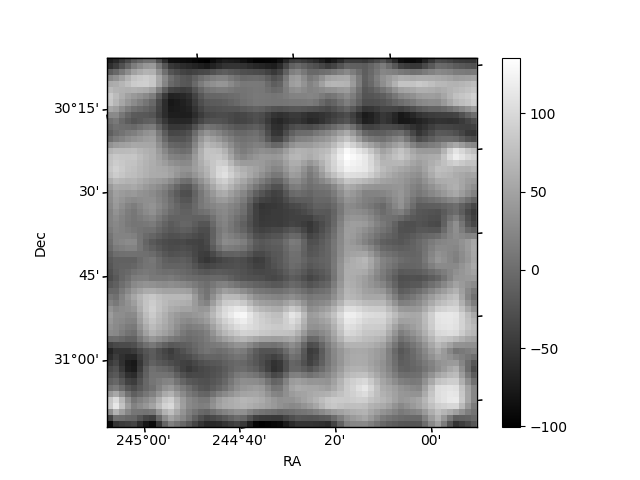
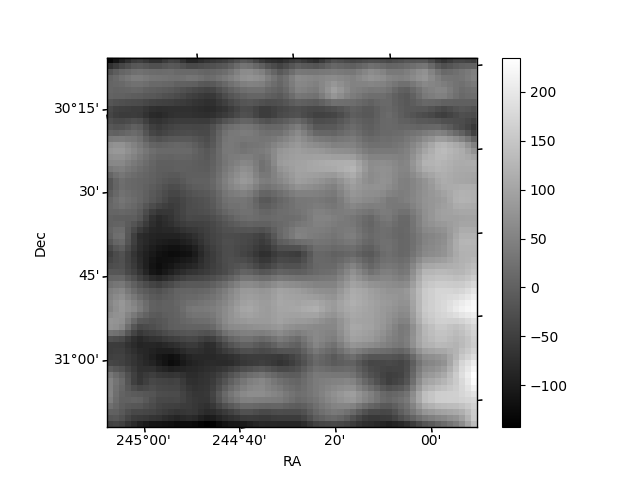
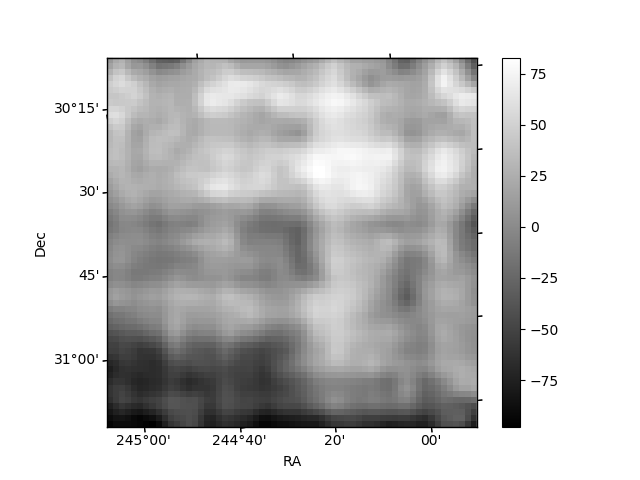
Histogram calculated using DETX and DETY for each event in the final _common_clean file
| Quadrant A | 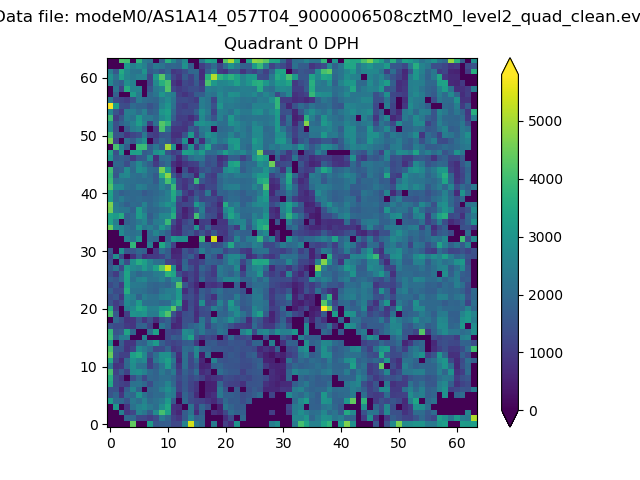 |
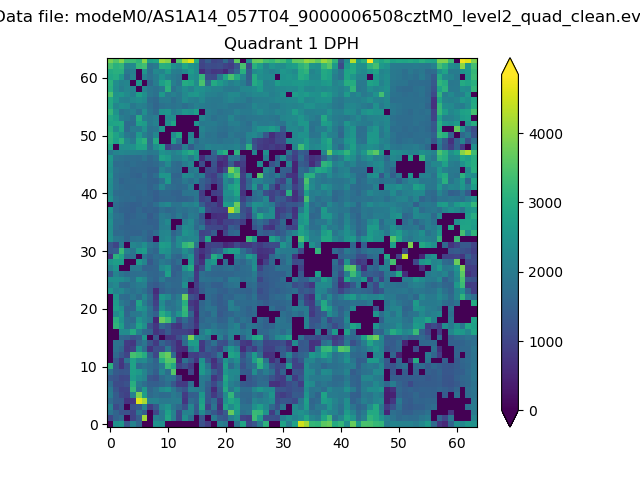 |
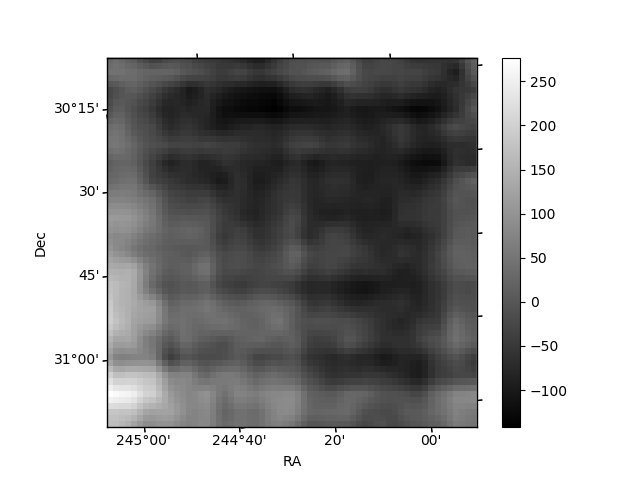
Quadrant B |
|---|---|---|---|
| Quadrant D | 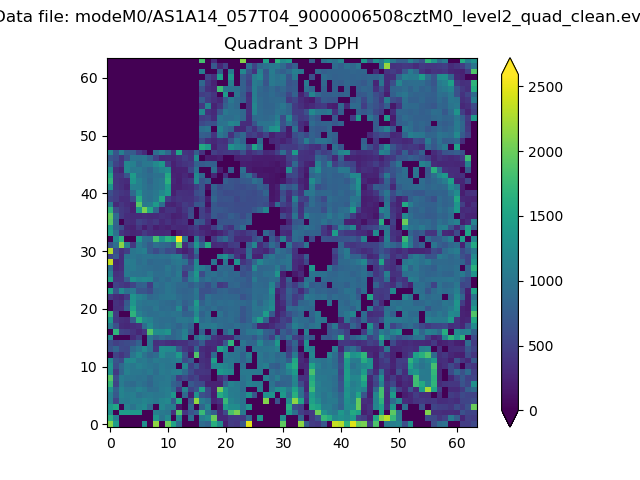 |
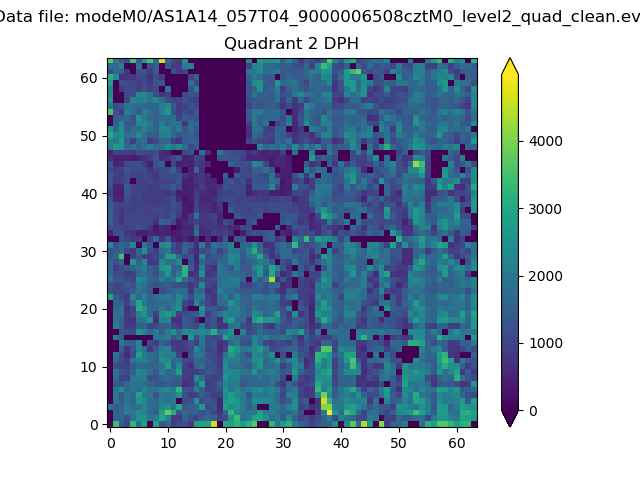 |
Quadrant C |
| Plot type | Count rate plots | Images |
|---|---|---|
| Comparison with Poisson distribution Blue bars denote a histogram of data divided into 1 sec bins. Red curve is a Poisson curve with rate = median count rate of data. |
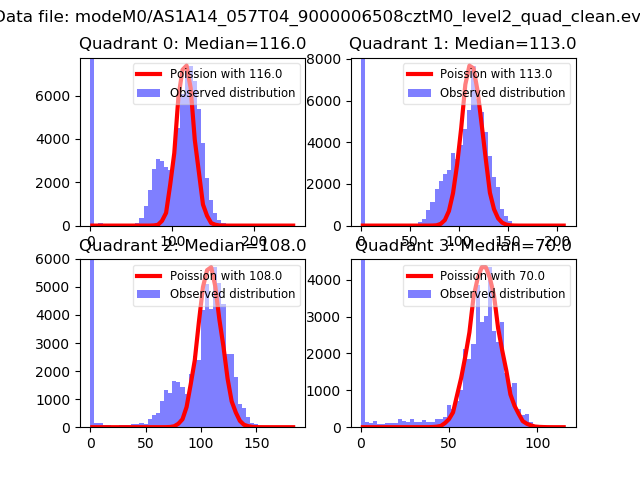 |
 |
| Quadrant-wise count rates Data is divided into 100 sec bins |
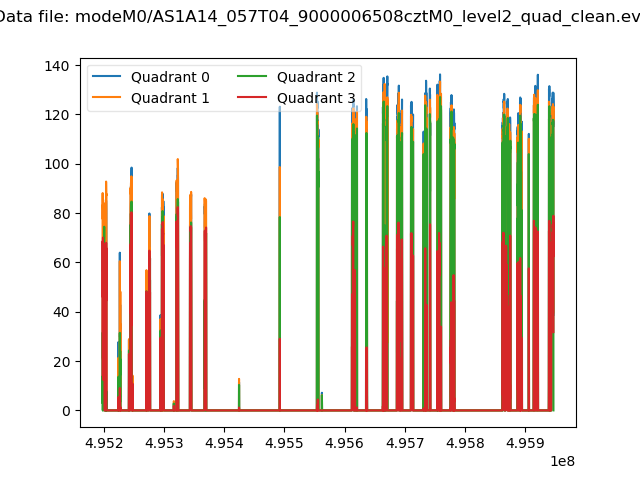 |
|
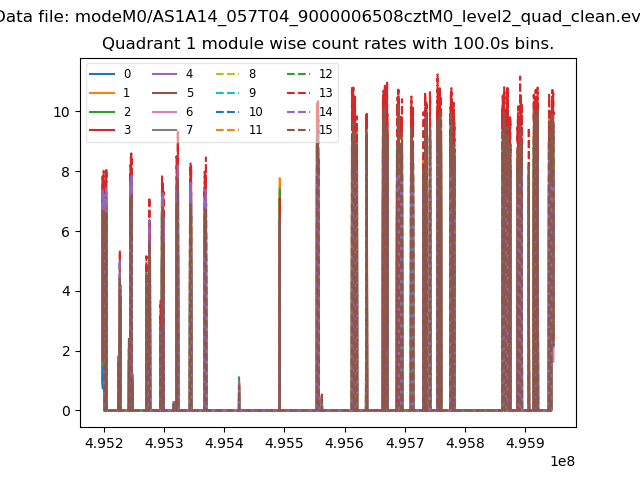
| Module-wise count rates for Quadrant A Data is divided into 100 sec bins |
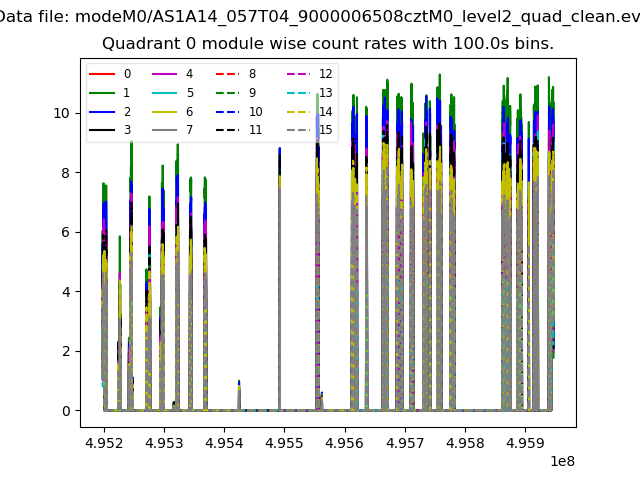 |
 |
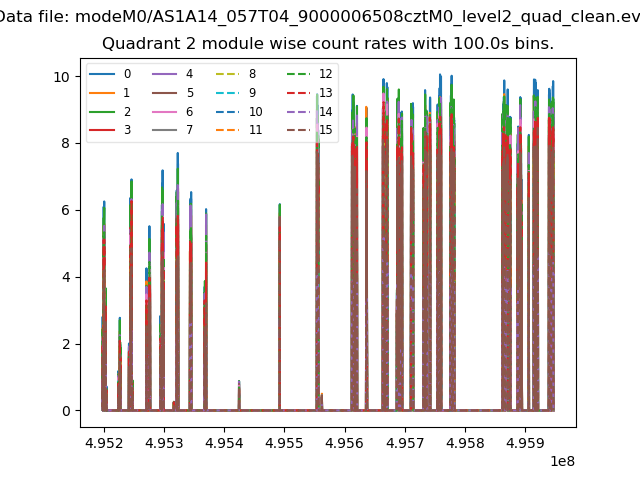
| Module-wise count rates for Quadrant B Data is divided into 100 sec bins |
 |
 |
| Module-wise count rates for Quadrant C Data is divided into 100 sec bins |
 |
 |
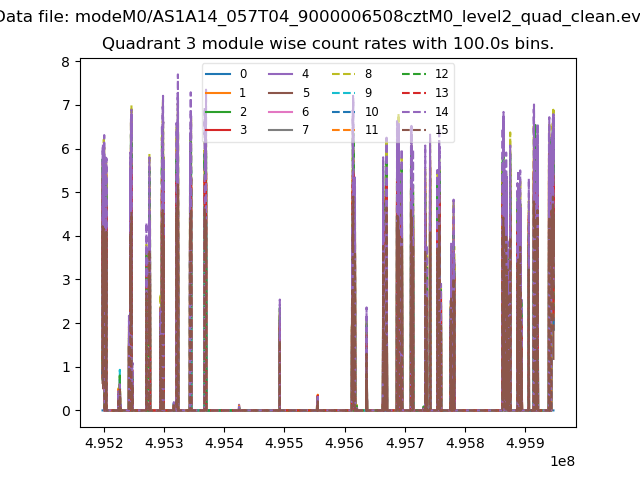
| Module-wise count rates for Quadrant D Data is divided into 100 sec bins |
 |
 |
| Parameter | Plot |
|---|---|
| CZT HV Monitor | 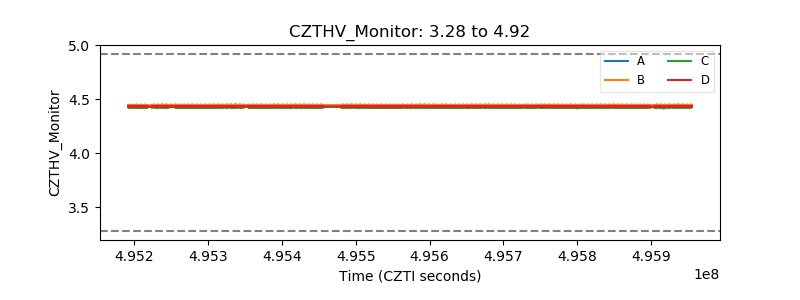 |
| D_VDD | 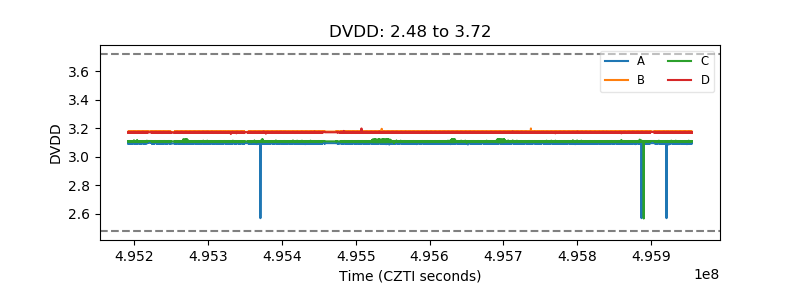 |
| Temperature 1 | 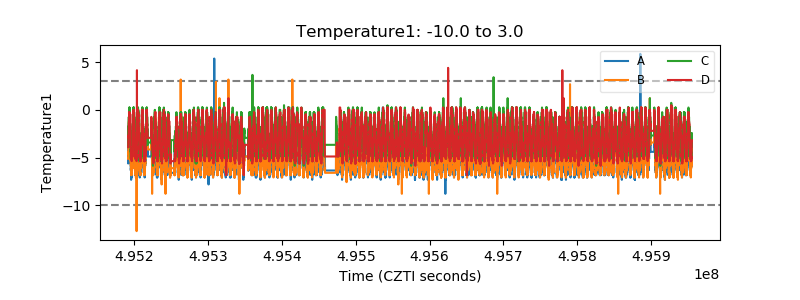 |
| Veto HV Monitor | 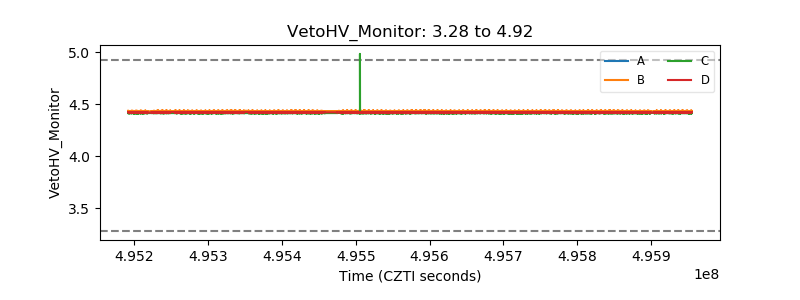 |
| Veto LLD | 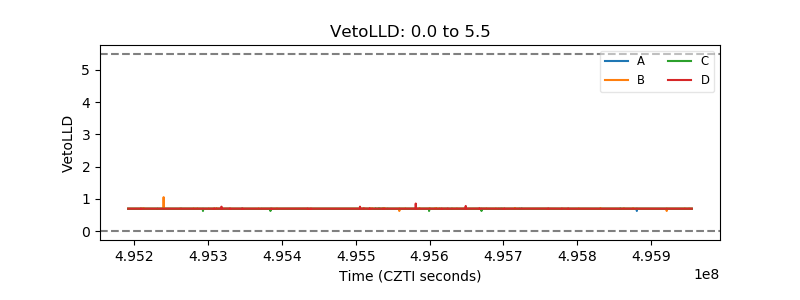 |
| Alpha Counter | 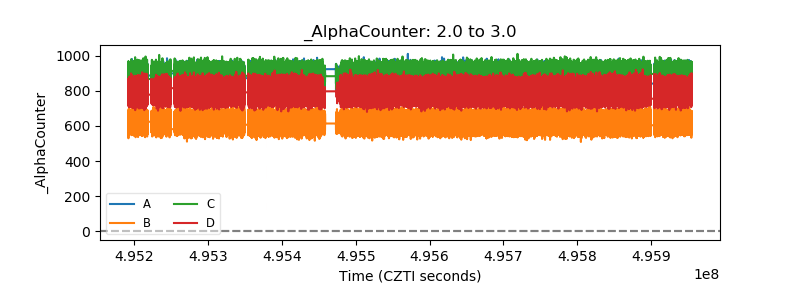 |
| _CPM_Rate | 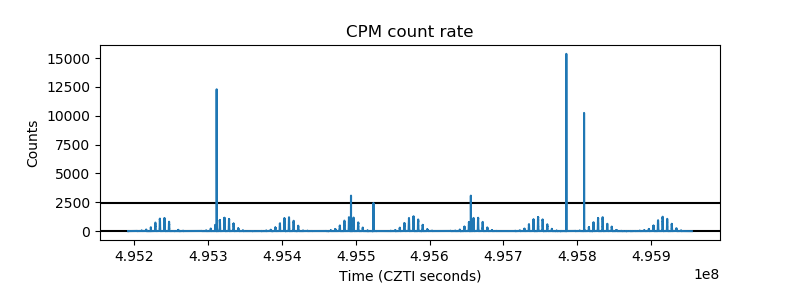 |
| CZT Counter | 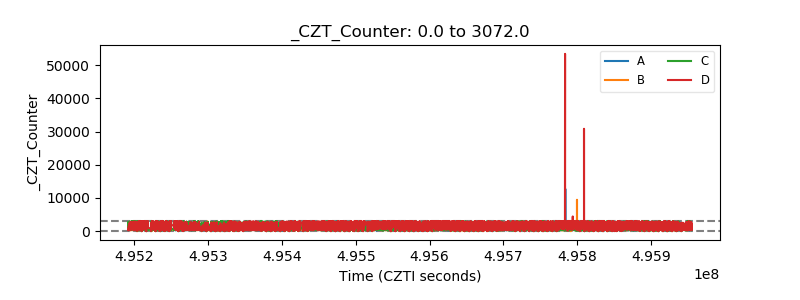 |
| +2.5 Volts monitor | 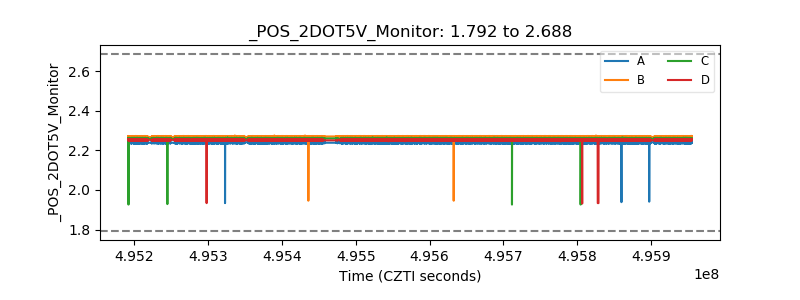 |
| +5 Volts monitor | 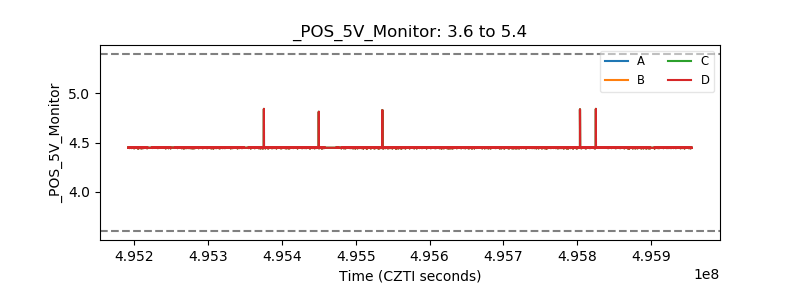 |
| _ROLL_ROT | 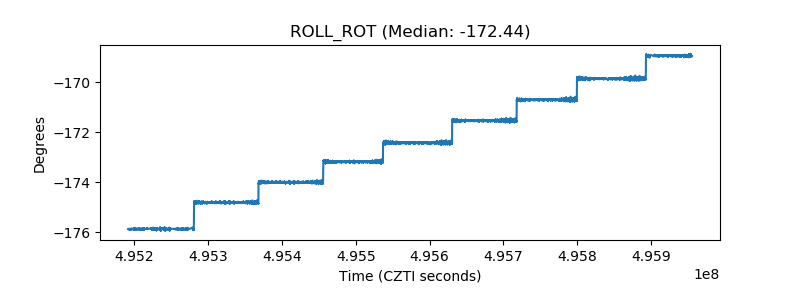 |
| _Roll_DEC | 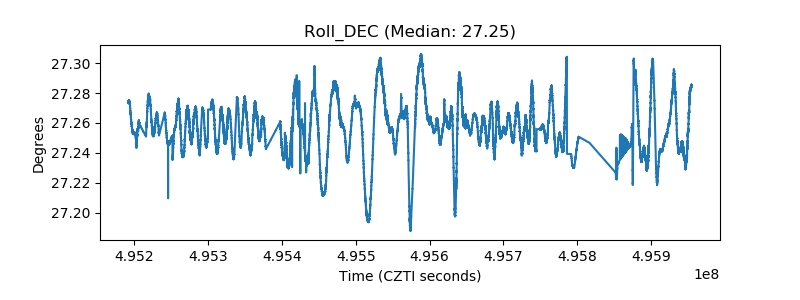 |
| _Roll_RA | 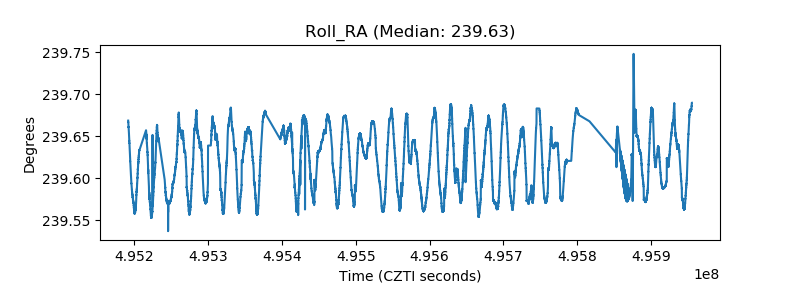 |
| Veto Counter | 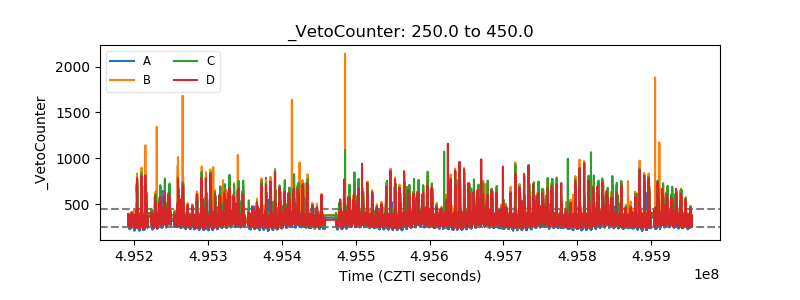 |