| Param | Original file | Final file |
|---|---|---|
| Filename | modeM0/AS1A14_057T04_9000006508_53839cztM0_level2.fits | modeM0/AS1A14_057T04_9000006508_53839cztM0_level2_quad_clean.evt |
| Size (bytes) | 570,479,040 | 61,873,920 |
| Size | 544.1 MB | 59.0 MB |
| Events in quadrant A | 3,582,824 | 450,889 |
| Events in quadrant B | 2,779,722 | 496,413 |
| Events in quadrant C | 9,514,101 | 197,030 |
| Events in quadrant D | 4,858,655 | 382,966 |
| Mode M0 | |||
|---|---|---|---|
| Quadrant | BADHDUFLAG | Total packets | Discarded packets |
| A | 0 | 15611 | 1706 |
| B | 0 | 12442 | 894 |
| C | 0 | 34301 | 2708 |
| D | 0 | 19632 | 1816 |
| Mode SS | |||
|---|---|---|---|
| Quadrant | BADHDUFLAG | Total packets | Discarded packets |
| A | 0 | 107 | 5 |
| B | 0 | 105 | 4 |
| C | 0 | 108 | 6 |
| D | 0 | 105 | 5 |
| Quadrant | Total seconds | Saturated seconds | Saturation percentage |
|---|---|---|---|
| A | 4911 | 202 | 4.113215% |
| B | 4992 | 19 | 0.380609% |
| C | 4883 | 2891 | 59.205407% |
| D | 4905 | 462 | 9.418960% |
Noise dominated data is calculated using 1-second bins in cleaned event files. If a bin has >2000 counts, and if more than 50% of those come from <1% of pixels, then it is considered to be noise-dominated and hence unusable.
| Quadrant | # 1 sec bins | Bins with >0 counts | Bins with >2000 counts | High rate bins dominated by noise | Noise dominated (total time) | Noise dominated (detector-on time) | Marked lightcurve |
|---|---|---|---|---|---|---|---|
| A | 7583 | 5005 | 163 | 163 | 2.15% | 3.26% | 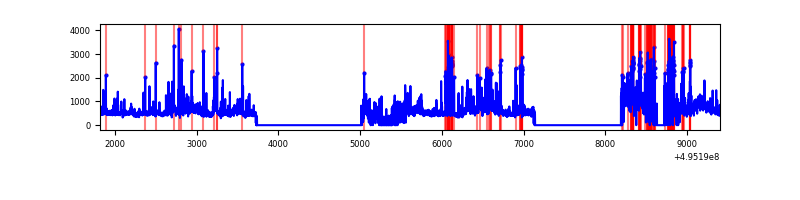 |
| B | 7583 | 5092 | 14 | 14 | 0.18% | 0.27% | 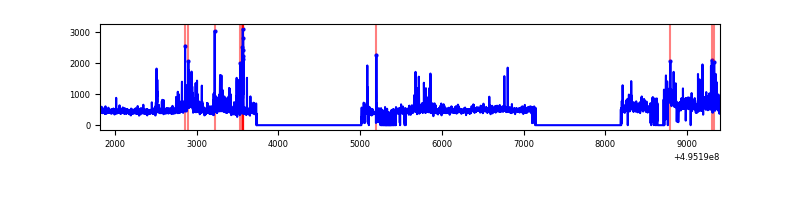 |
| C | 7582 | 4940 | 2785 | 2785 | 36.73% | 56.38% | 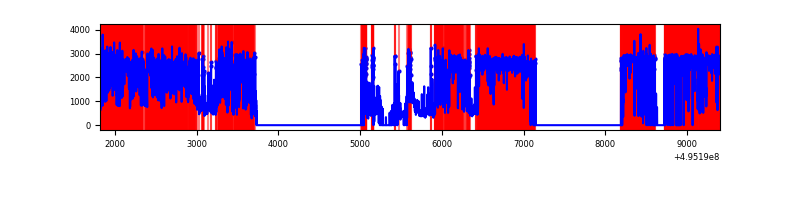 |
| D | 7583 | 5003 | 515 | 515 | 6.79% | 10.29% | 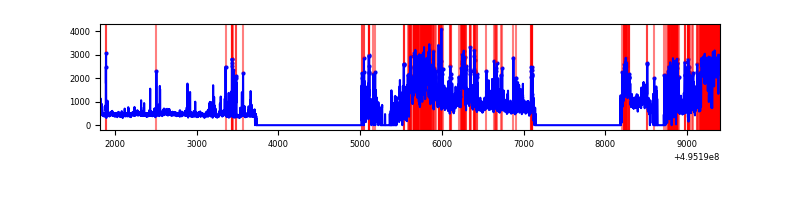 |
Top three noisy pixels from each quadrant. If the there are fewer than three noisy pixels in the level2.evt file, extra rows are filled as -1
| Pixel properties | Quadrant properties | ||||||
|---|---|---|---|---|---|---|---|
| Quadrant | DetID | PixID | Counts | Sigma | Mean | Median | Sigma |
| A | 4 | 249 | 627409 | 4829.16 | 517 | 504 | 129.8 |
| A | 8 | 249 | 616493 | 4745.07 | 517 | 504 | 129.8 |
| A | 10 | 253 | 218969 | 1682.87 | 517 | 504 | 129.8 |
| B | 7 | 0 | 327690 | 2901.13 | 524 | 505 | 112.8 |
| B | 8 | 234 | 116828 | 1031.43 | 524 | 505 | 112.8 |
| B | 5 | 185 | 115935 | 1023.51 | 524 | 505 | 112.8 |
| C | 1 | 241 | 4385654 | 45106.19 | 348 | 346 | 97.2 |
| C | 12 | 249 | 1680150 | 17278.05 | 348 | 346 | 97.2 |
| C | 15 | 158 | 799258 | 8217.41 | 348 | 346 | 97.2 |
| D | 15 | 93 | 1313189 | 9451.46 | 489 | 466 | 138.9 |
| D | 10 | 172 | 902228 | 6492.59 | 489 | 466 | 138.9 |
| D | 2 | 120 | 136385 | 978.6 | 489 | 466 | 138.9 |
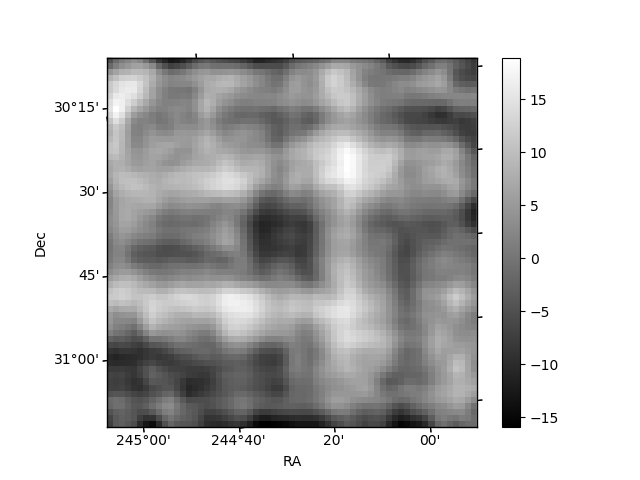
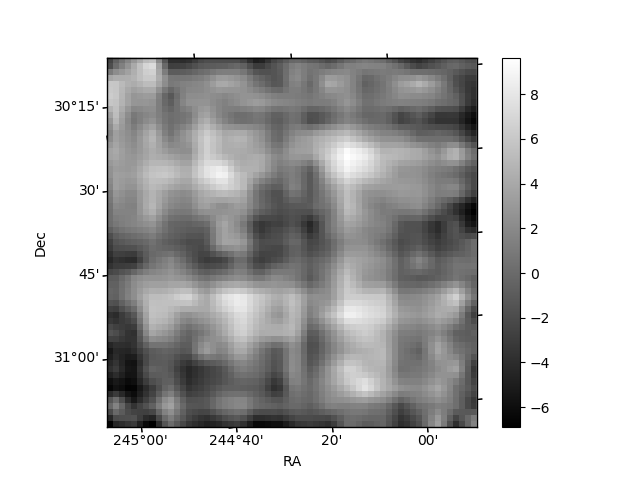
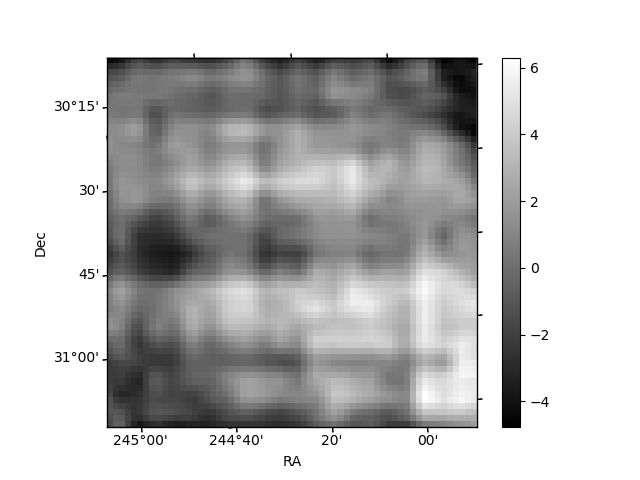
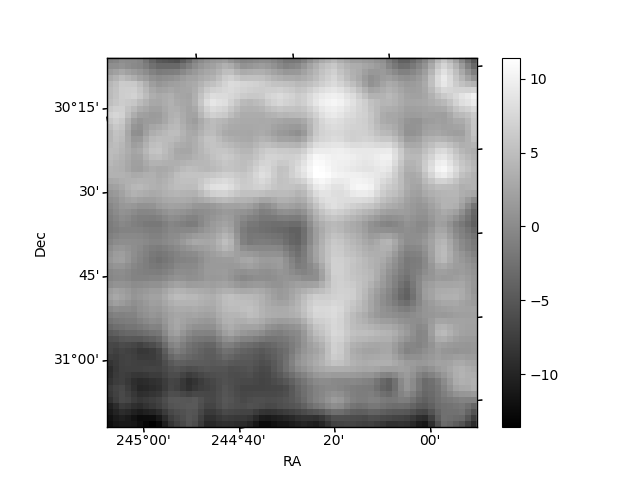
Histogram calculated using DETX and DETY for each event in the final _common_clean file
| Quadrant A | 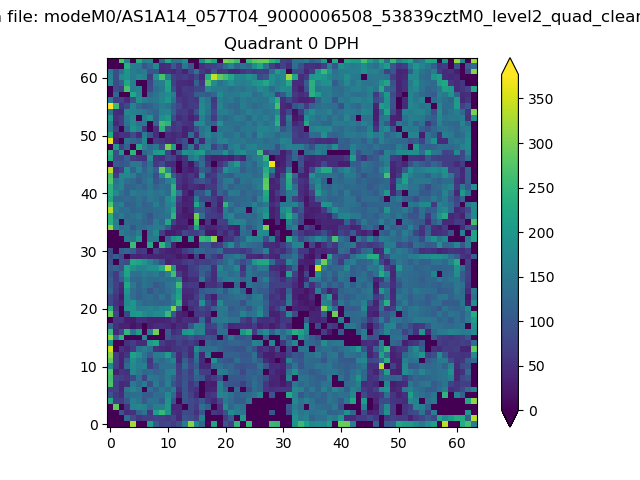 |
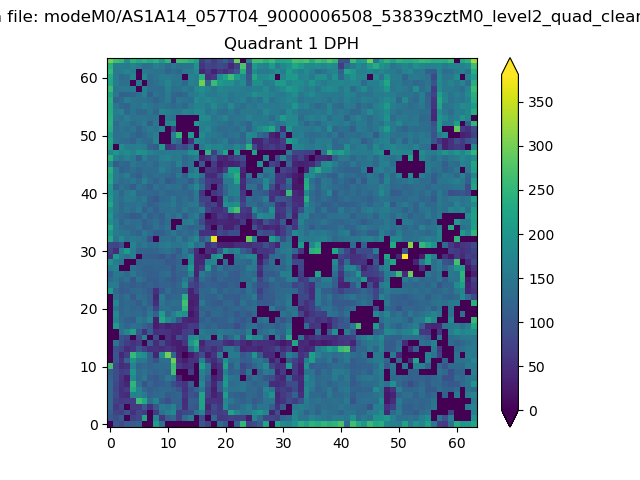 |
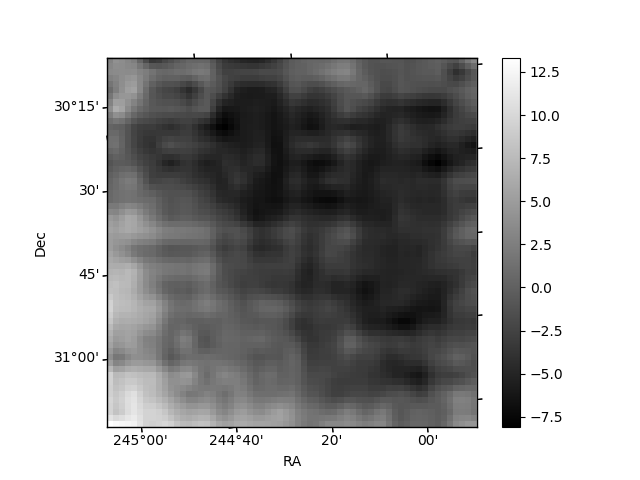
Quadrant B |
|---|---|---|---|
| Quadrant D | 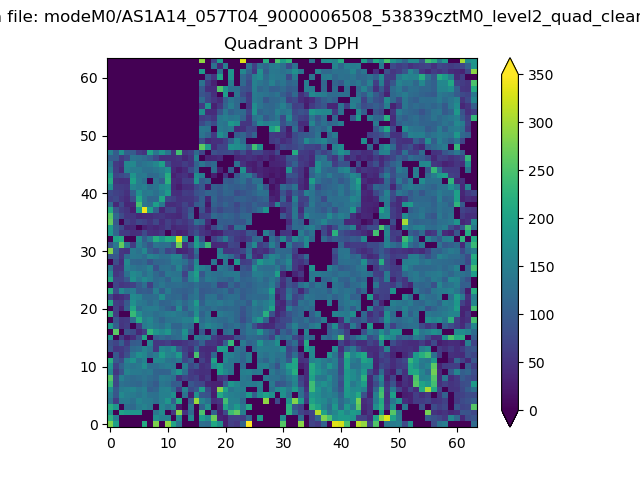 |
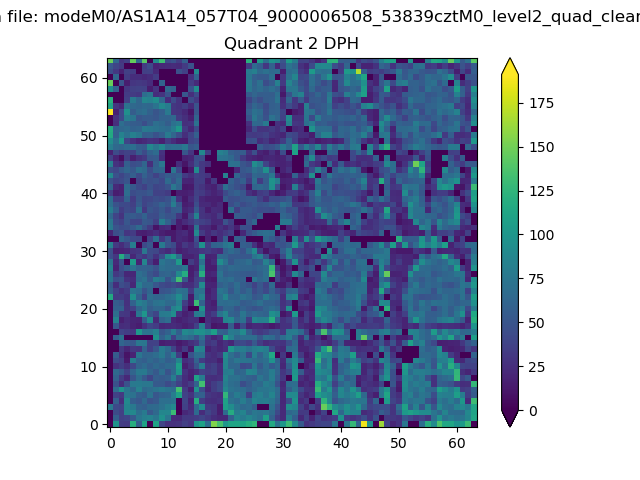 |
Quadrant C |
| Plot type | Count rate plots | Images |
|---|---|---|
| Comparison with Poisson distribution Blue bars denote a histogram of data divided into 1 sec bins. Red curve is a Poisson curve with rate = median count rate of data. |
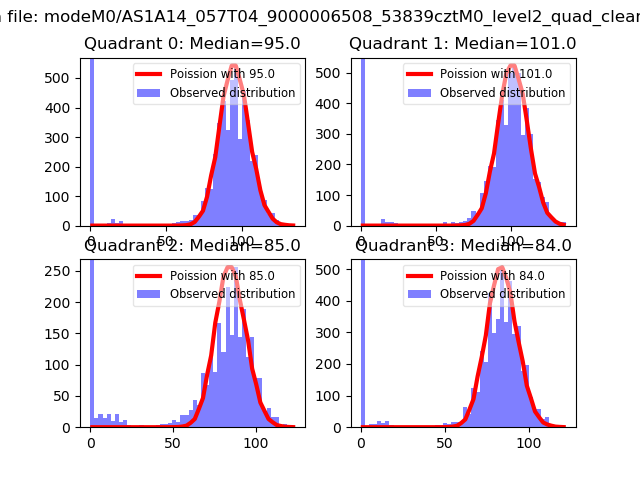 |
 |
| Quadrant-wise count rates Data is divided into 100 sec bins |
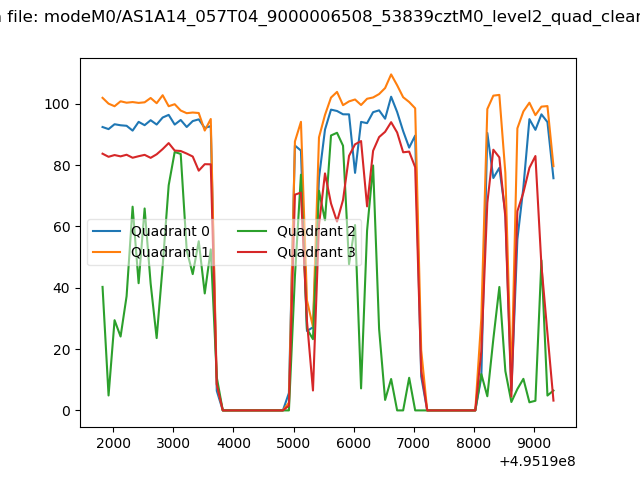 |
|
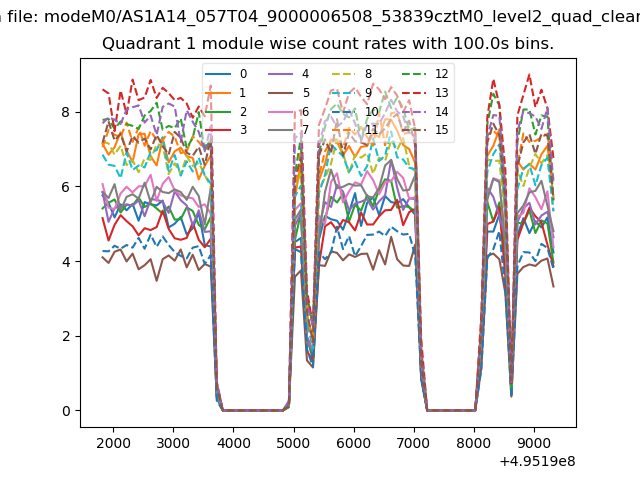
| Module-wise count rates for Quadrant A Data is divided into 100 sec bins |
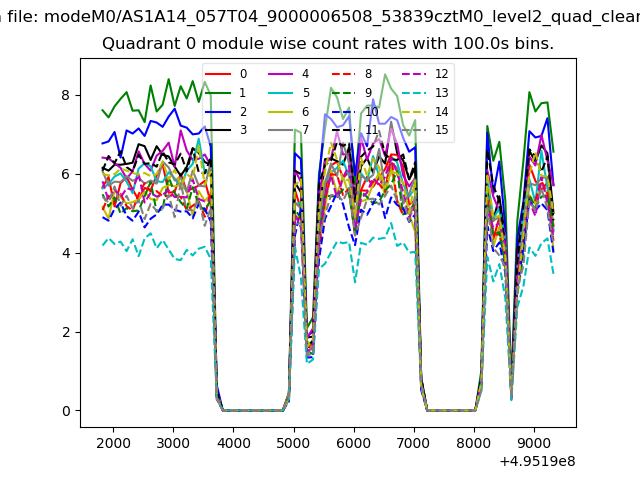 |
 |
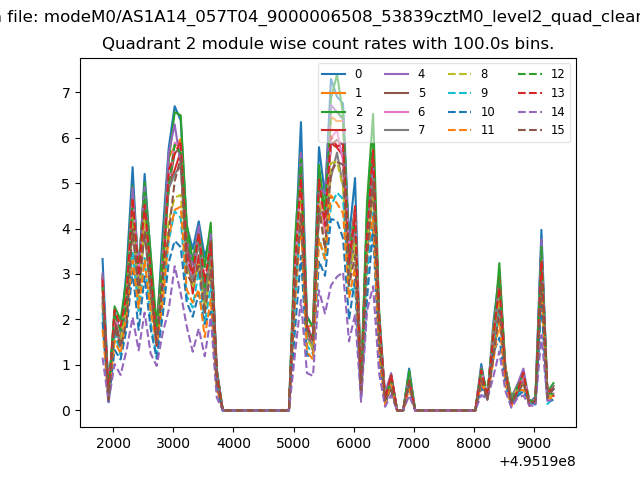
| Module-wise count rates for Quadrant B Data is divided into 100 sec bins |
 |
 |
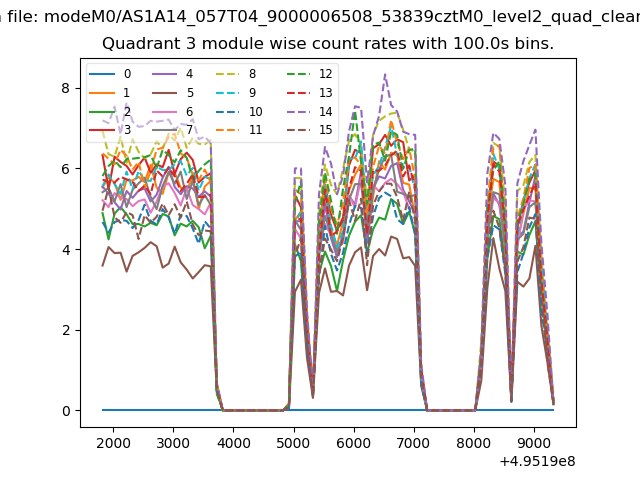
| Module-wise count rates for Quadrant C Data is divided into 100 sec bins |
 |
 |
| Module-wise count rates for Quadrant D Data is divided into 100 sec bins |
 |
 |
| Parameter | Plot |
|---|---|
| CZT HV Monitor | 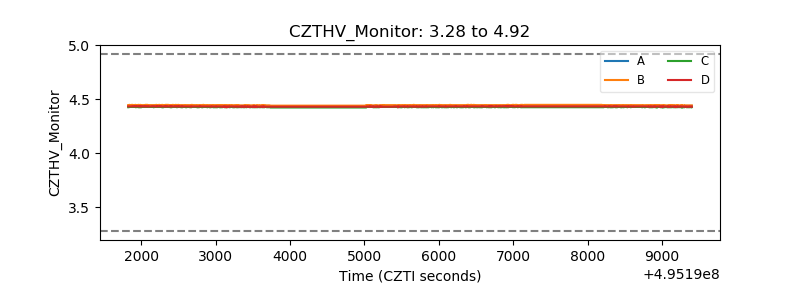 |
| D_VDD | 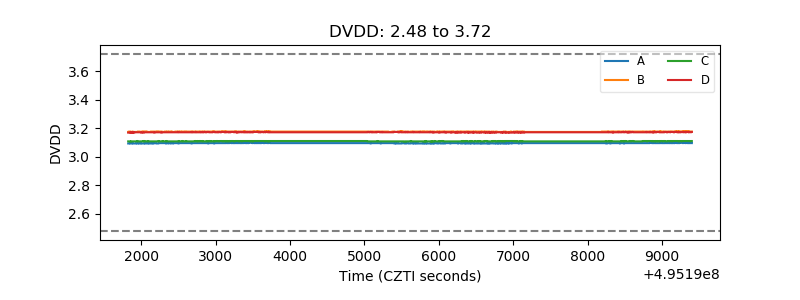 |
| Temperature 1 | 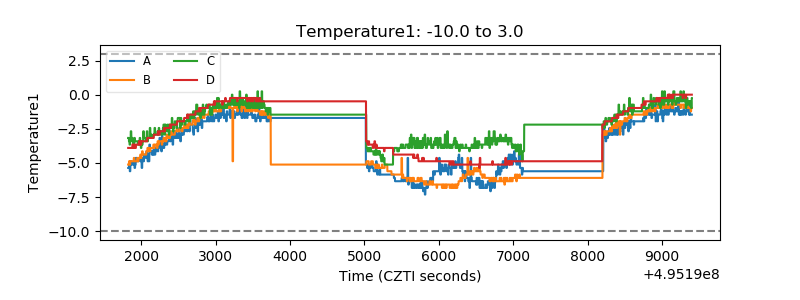 |
| Veto HV Monitor |  |
| Veto LLD | 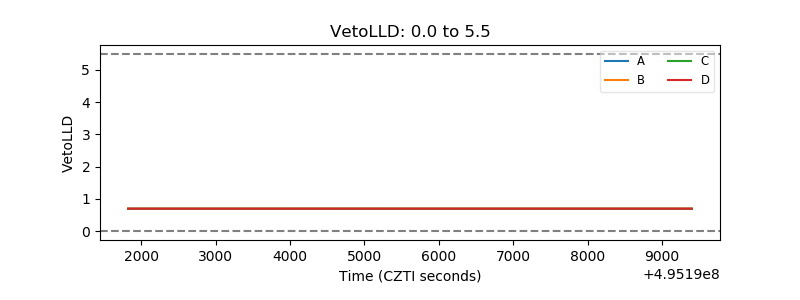 |
| Alpha Counter | 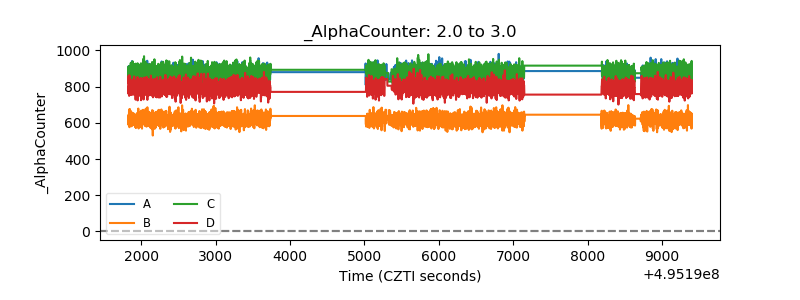 |
| _CPM_Rate | 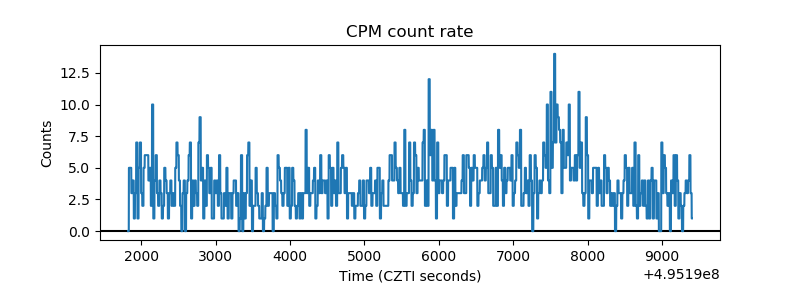 |
| CZT Counter | 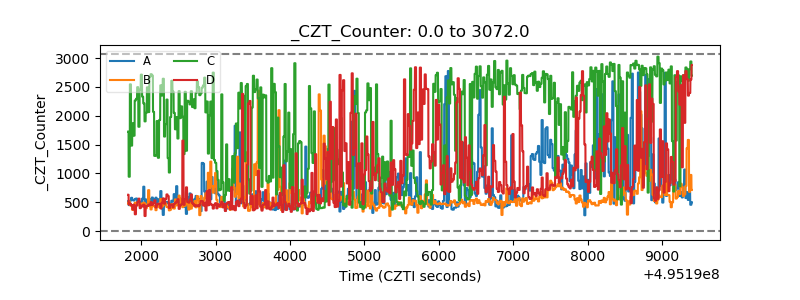 |
| +2.5 Volts monitor | 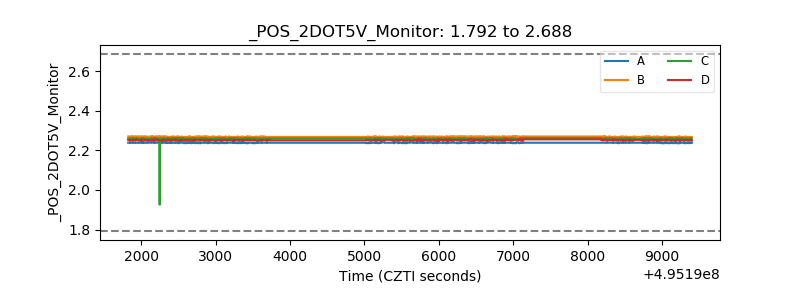 |
| +5 Volts monitor | 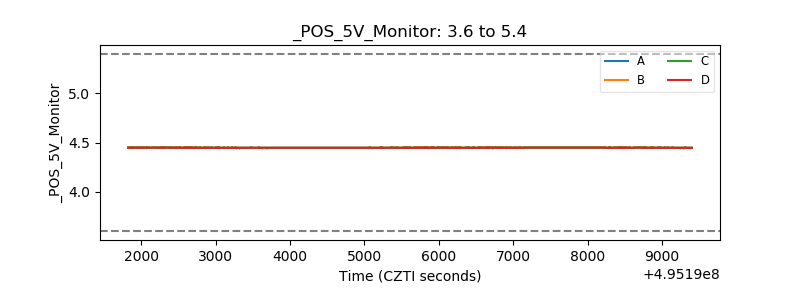 |
| _ROLL_ROT | 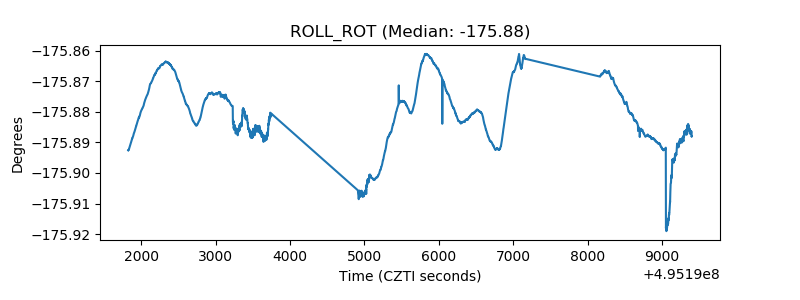 |
| _Roll_DEC | 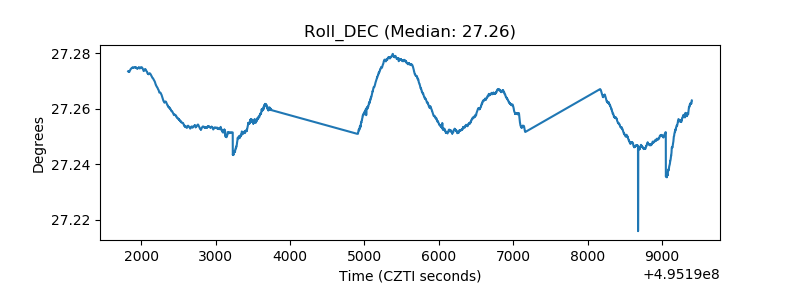 |
| _Roll_RA | 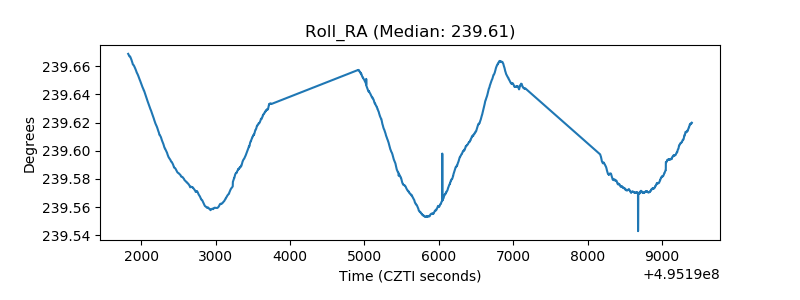 |
| Veto Counter | 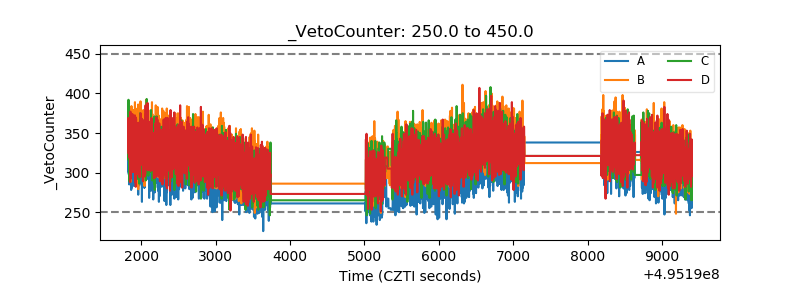 |