| Param | Original file | Final file |
|---|---|---|
| Filename | modeM0/AS1A14_057T04_9000006508_53842cztM0_level2.fits | modeM0/AS1A14_057T04_9000006508_53842cztM0_level2_quad_clean.evt |
| Size (bytes) | 2,379,021,120 | 212,068,800 |
| Size | 2.2 GB | 202.2 MB |
| Events in quadrant A | 13,269,978 | 1,568,581 |
| Events in quadrant B | 14,235,310 | 1,642,681 |
| Events in quadrant C | 26,145,921 | 1,078,386 |
| Events in quadrant D | 33,006,056 | 870,152 |
| Mode M0 | |||
|---|---|---|---|
| Quadrant | BADHDUFLAG | Total packets | Discarded packets |
| A | 0 | 51867 | 9 |
| B | 0 | 55154 | 18 |
| C | 0 | 90289 | 29 |
| D | 0 | 110689 | 38 |
| Mode SS | |||
|---|---|---|---|
| Quadrant | BADHDUFLAG | Total packets | Discarded packets |
| A | 0 | 370 | 0 |
| B | 0 | 370 | 0 |
| C | 0 | 370 | 0 |
| D | 0 | 370 | 0 |
| Mode M9 | |||
|---|---|---|---|
| Quadrant | BADHDUFLAG | Total packets | Discarded packets |
| A | 0 | 12 | 0 |
| B | 0 | 12 | 0 |
| C | 0 | 12 | 0 |
| D | 0 | 12 | 0 |
| Quadrant | Total seconds | Saturated seconds | Saturation percentage |
|---|---|---|---|
| A | 18282 | 1434 | 7.843781% |
| B | 18277 | 1736 | 9.498277% |
| C | 18277 | 6218 | 34.020901% |
| D | 18278 | 8327 | 45.557501% |
Noise dominated data is calculated using 1-second bins in cleaned event files. If a bin has >2000 counts, and if more than 50% of those come from <1% of pixels, then it is considered to be noise-dominated and hence unusable.
| Quadrant | # 1 sec bins | Bins with >0 counts | Bins with >2000 counts | High rate bins dominated by noise | Noise dominated (total time) | Noise dominated (detector-on time) | Marked lightcurve |
|---|---|---|---|---|---|---|---|
| A | 19576 | 18286 | 1044 | 1044 | 5.33% | 5.71% | 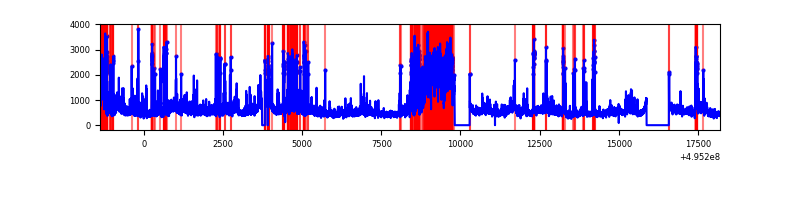 |
| B | 19575 | 18284 | 1237 | 1237 | 6.32% | 6.77% | 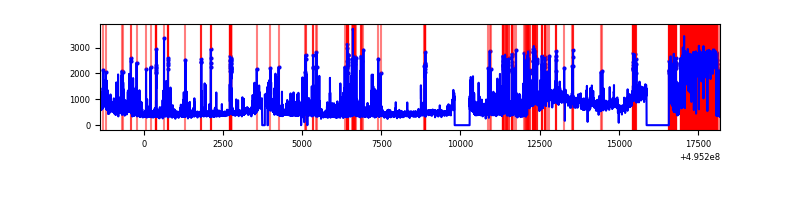 |
| C | 19575 | 18284 | 5915 | 5915 | 30.22% | 32.35% | 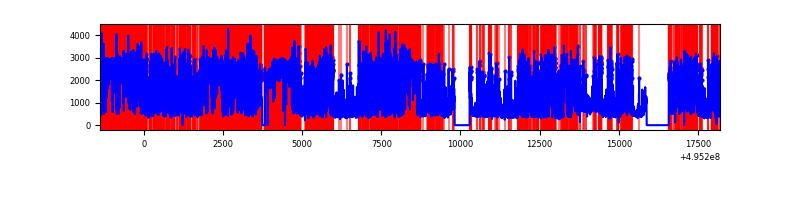 |
| D | 19574 | 18284 | 8472 | 8472 | 43.28% | 46.34% | 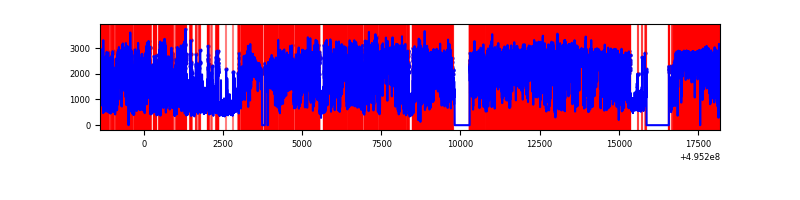 |
Top three noisy pixels from each quadrant. If the there are fewer than three noisy pixels in the level2.evt file, extra rows are filled as -1
| Pixel properties | Quadrant properties | ||||||
|---|---|---|---|---|---|---|---|
| Quadrant | DetID | PixID | Counts | Sigma | Mean | Median | Sigma |
| A | 4 | 249 | 2535917 | 5321.76 | 1915 | 1866 | 476.2 |
| A | 8 | 249 | 1836116 | 3852.11 | 1915 | 1866 | 476.2 |
| A | 0 | 8 | 668201 | 1399.37 | 1915 | 1866 | 476.2 |
| B | 5 | 172 | 4141912 | 10269.3 | 1894 | 1826 | 403.2 |
| B | 0 | 213 | 611041 | 1511.13 | 1894 | 1826 | 403.2 |
| B | 5 | 185 | 560560 | 1385.92 | 1894 | 1826 | 403.2 |
| C | 1 | 241 | 10114447 | 23352.93 | 1584 | 1573 | 433.0 |
| C | 15 | 224 | 5008960 | 11563.2 | 1584 | 1573 | 433.0 |
| C | 9 | 38 | 979307 | 2257.81 | 1584 | 1573 | 433.0 |
| D | 15 | 93 | 17685561 | 39844.41 | 1548 | 1476 | 443.8 |
| D | 10 | 172 | 4638781 | 10448.42 | 1548 | 1476 | 443.8 |
| D | 2 | 172 | 2010461 | 4526.49 | 1548 | 1476 | 443.8 |
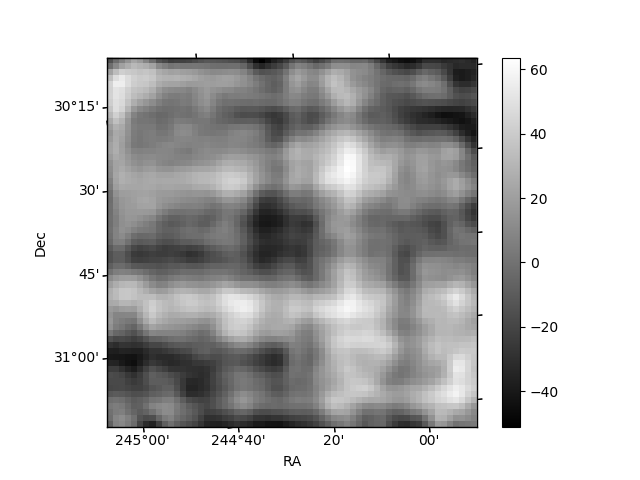
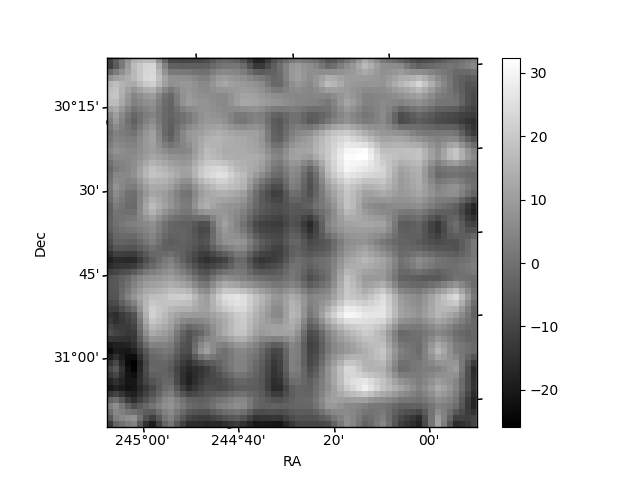
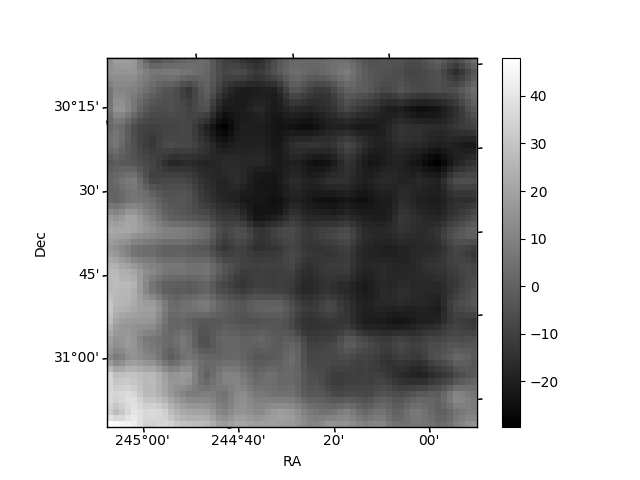
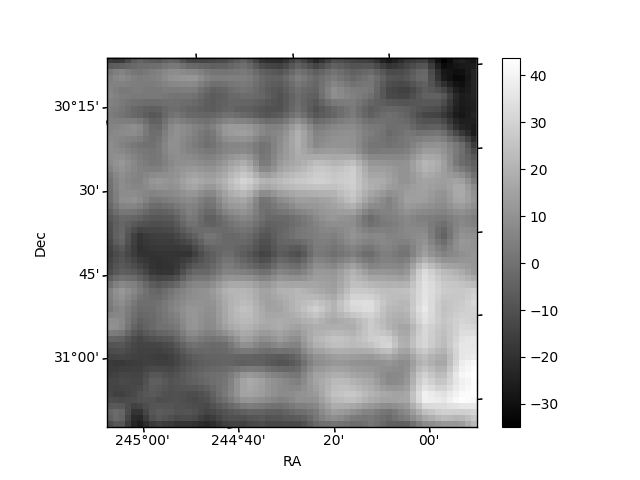
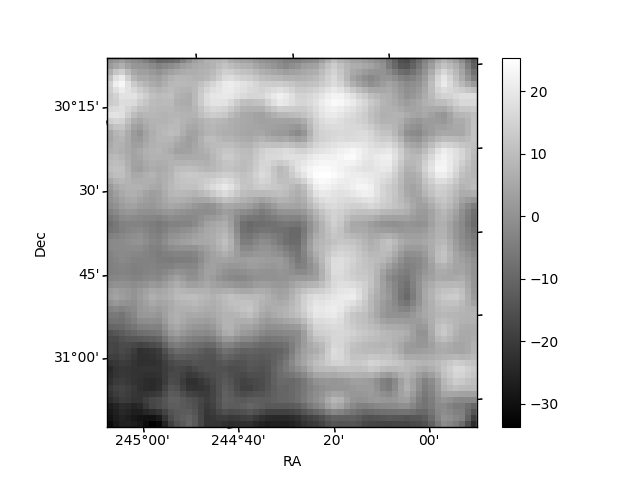
Histogram calculated using DETX and DETY for each event in the final _common_clean file
| Quadrant A | 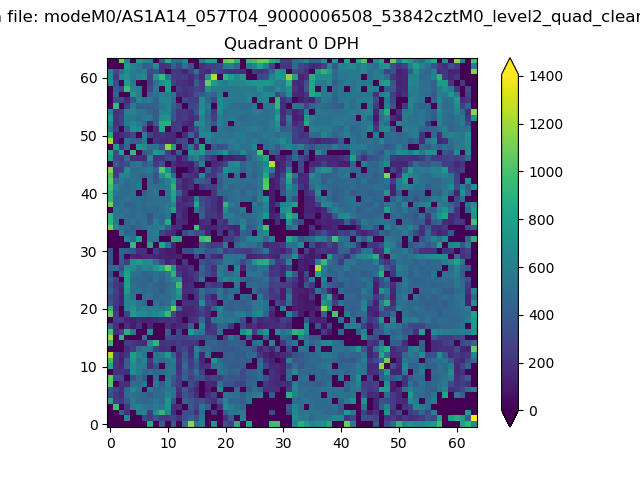 |
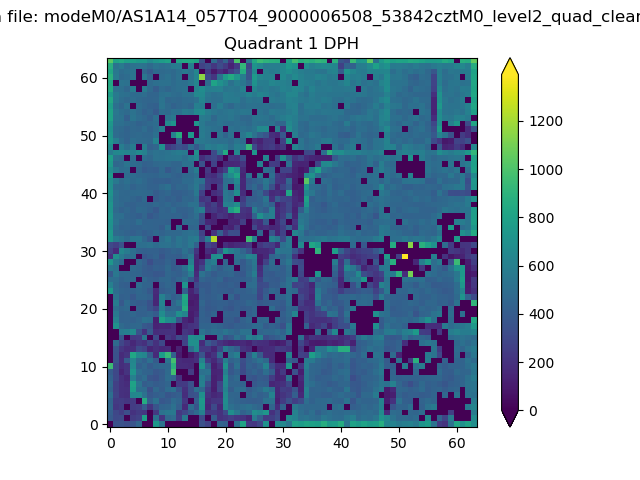 |
Quadrant B |
|---|---|---|---|
| Quadrant D | 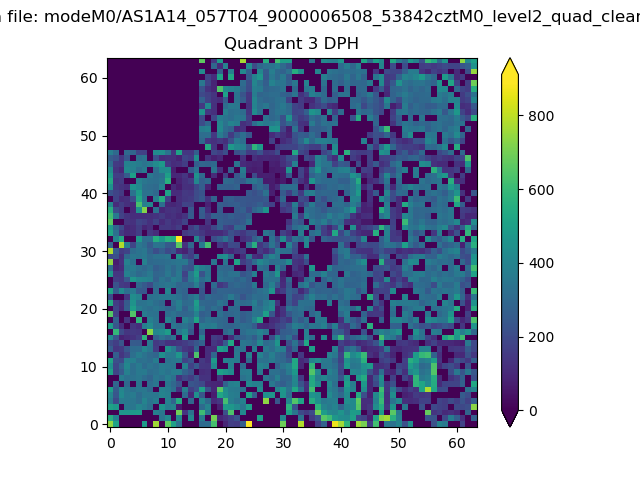 |
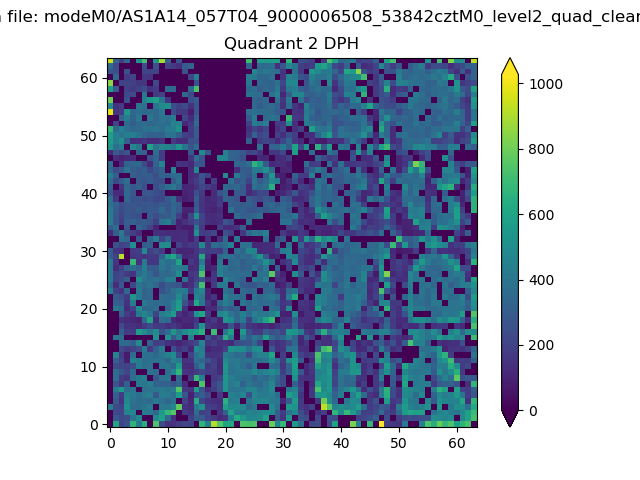 |
Quadrant C |
| Plot type | Count rate plots | Images |
|---|---|---|
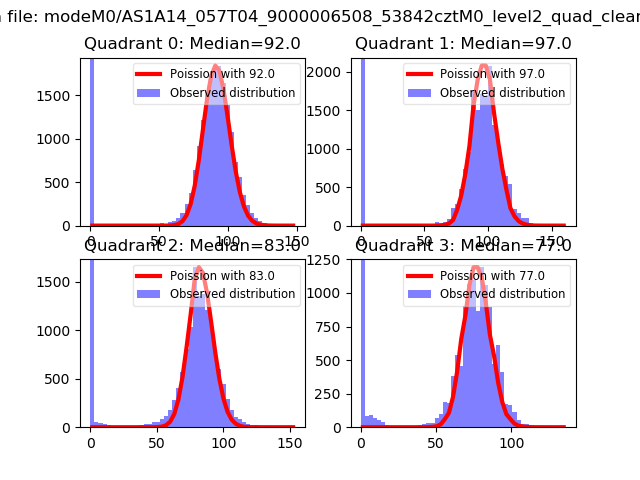
| Comparison with Poisson distribution Blue bars denote a histogram of data divided into 1 sec bins. Red curve is a Poisson curve with rate = median count rate of data. |
 |
 |
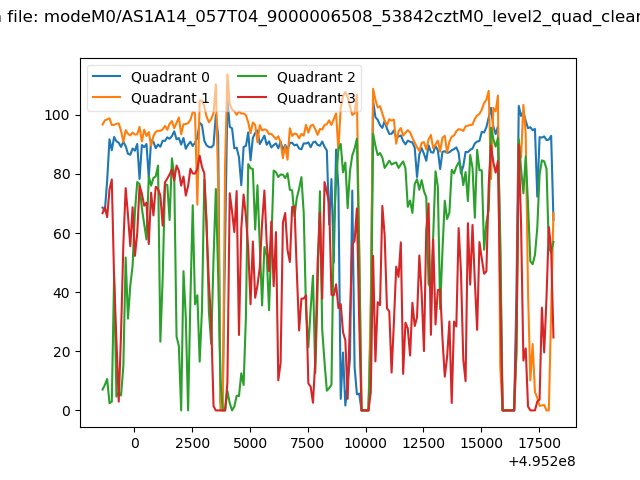
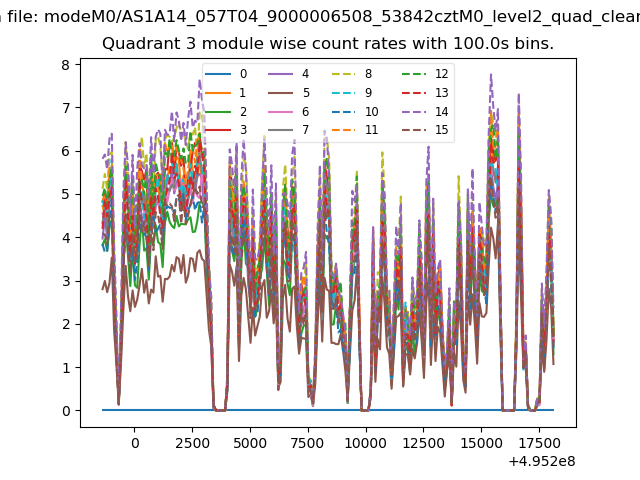
| Quadrant-wise count rates Data is divided into 100 sec bins |
 |
|
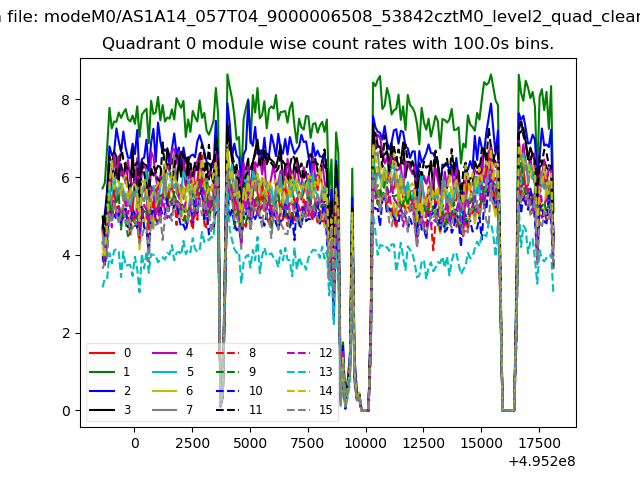
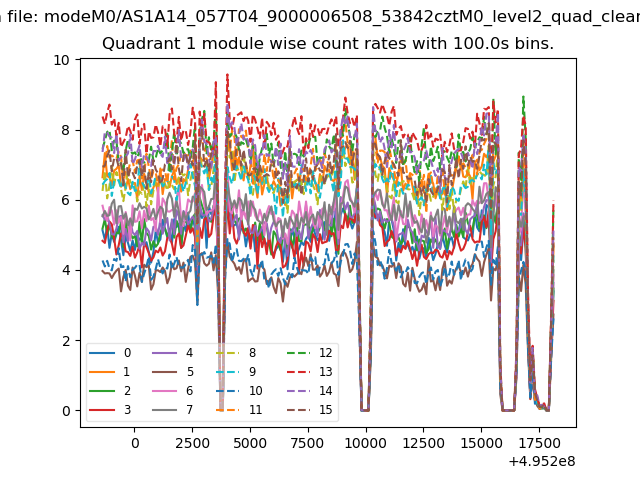
| Module-wise count rates for Quadrant A Data is divided into 100 sec bins |
 |
 |
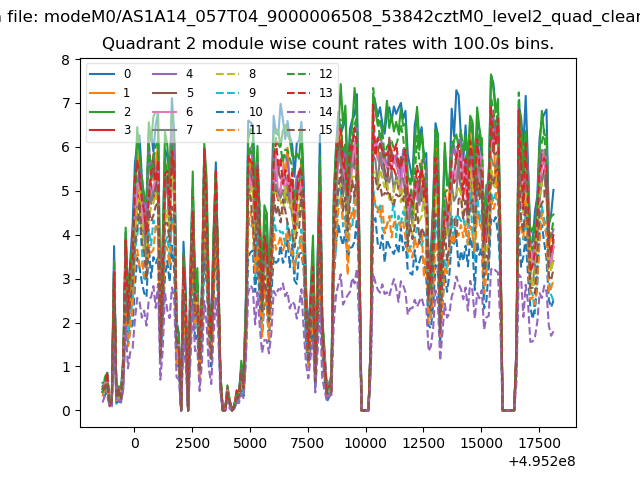
| Module-wise count rates for Quadrant B Data is divided into 100 sec bins |
 |
 |
| Module-wise count rates for Quadrant C Data is divided into 100 sec bins |
 |
 |
| Module-wise count rates for Quadrant D Data is divided into 100 sec bins |
 |
 |
| Parameter | Plot |
|---|---|
| CZT HV Monitor | 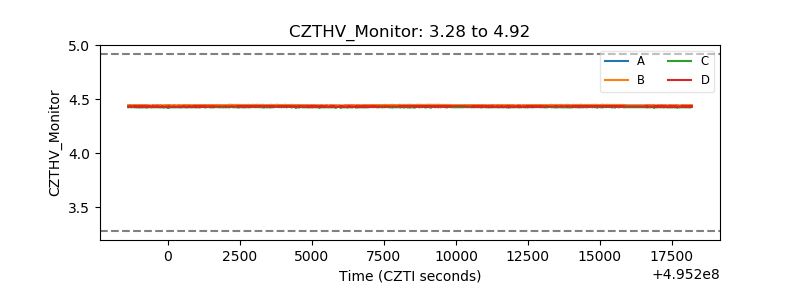 |
| D_VDD | 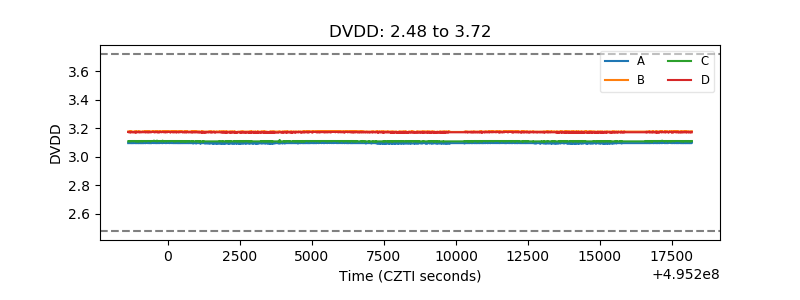 |
| Temperature 1 | 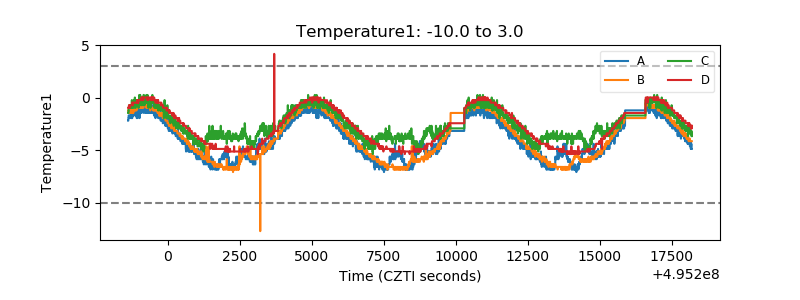 |
| Veto HV Monitor | 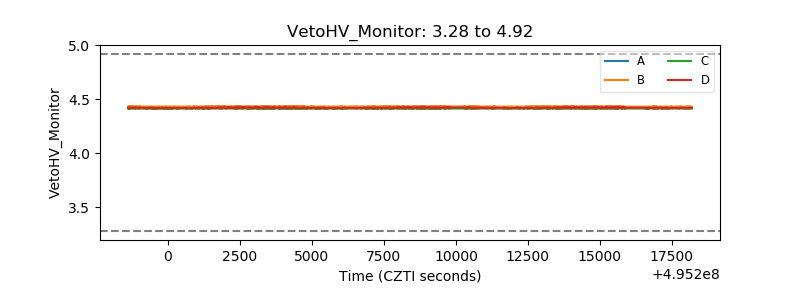 |
| Veto LLD | 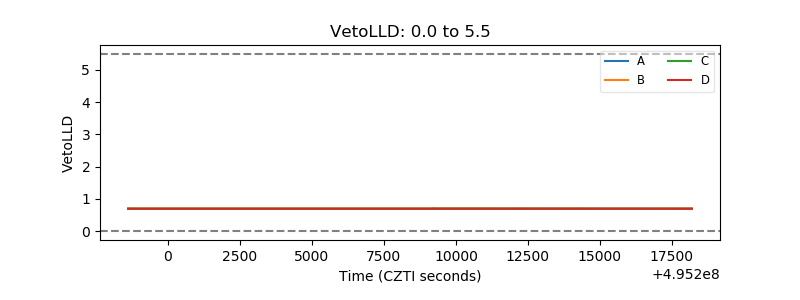 |
| Alpha Counter | 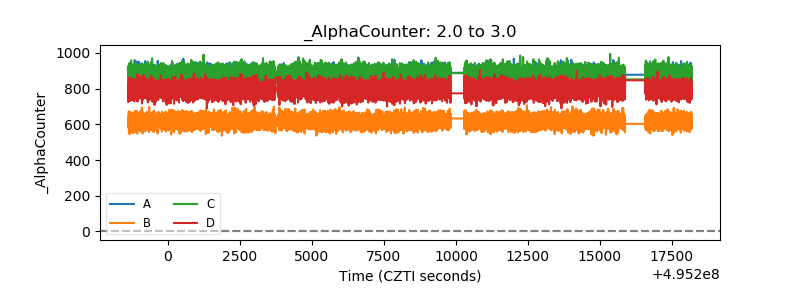 |
| _CPM_Rate | 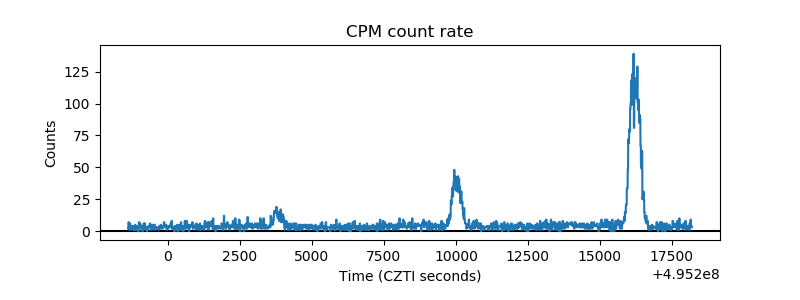 |
| CZT Counter | 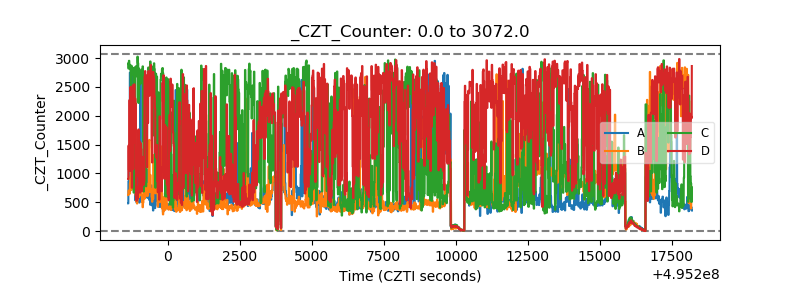 |
| +2.5 Volts monitor | 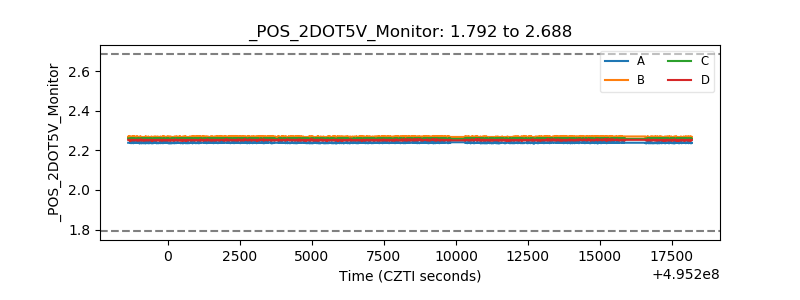 |
| +5 Volts monitor | 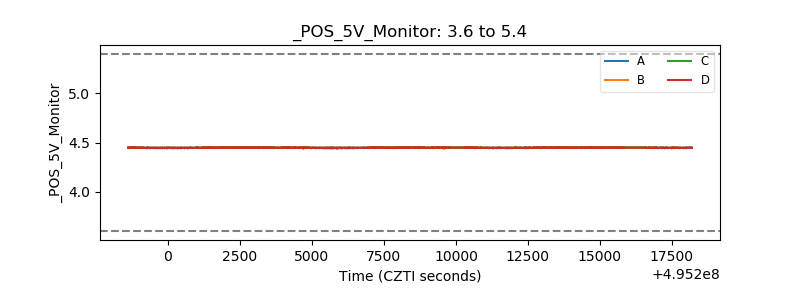 |
| _ROLL_ROT | 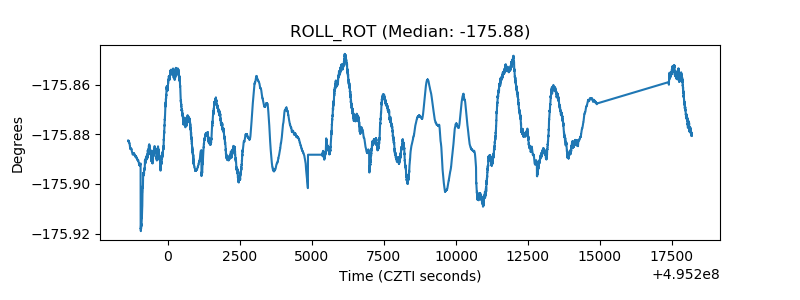 |
| _Roll_DEC | 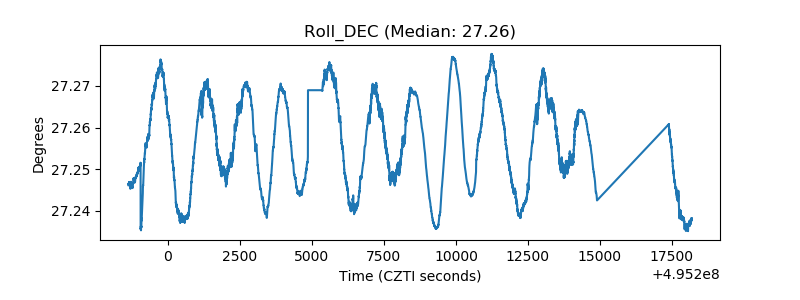 |
| _Roll_RA | 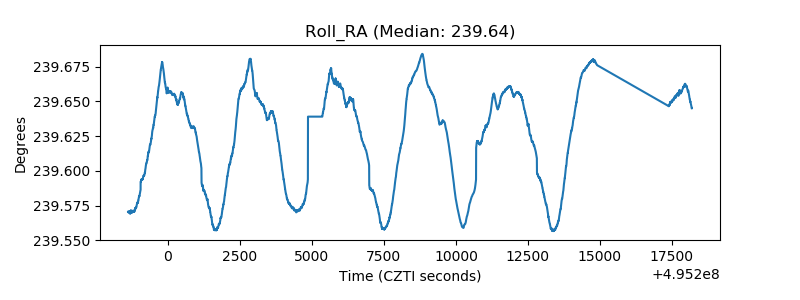 |
| Veto Counter | 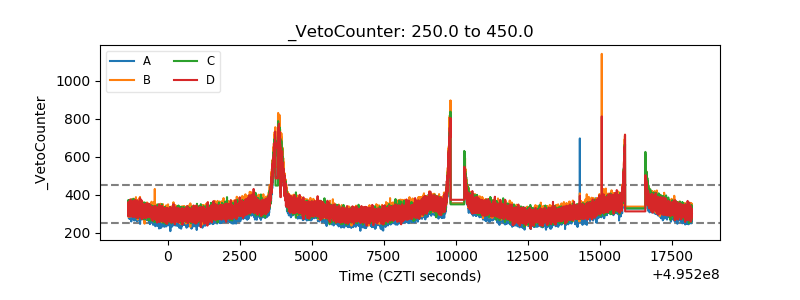 |