| Param | Original file | Final file |
|---|---|---|
| Filename | modeM0/AS1A14_057T04_9000006508_53843cztM0_level2.fits | modeM0/AS1A14_057T04_9000006508_53843cztM0_level2_quad_clean.evt |
| Size (bytes) | 2,686,248,000 | 259,312,320 |
| Size | 2.5 GB | 247.3 MB |
| Events in quadrant A | 16,503,987 | 1,901,043 |
| Events in quadrant B | 13,540,778 | 2,139,362 |
| Events in quadrant C | 33,772,469 | 1,125,249 |
| Events in quadrant D | 33,945,265 | 1,185,760 |
| Mode M0 | |||
|---|---|---|---|
| Quadrant | BADHDUFLAG | Total packets | Discarded packets |
| A | 0 | 63921 | 10 |
| B | 0 | 55217 | 3 |
| C | 0 | 115334 | 4 |
| D | 0 | 115940 | 29 |
| Mode SS | |||
|---|---|---|---|
| Quadrant | BADHDUFLAG | Total packets | Discarded packets |
| A | 0 | 442 | 0 |
| B | 0 | 442 | 0 |
| C | 0 | 442 | 0 |
| D | 0 | 442 | 0 |
| Mode M9 | |||
|---|---|---|---|
| Quadrant | BADHDUFLAG | Total packets | Discarded packets |
| A | 0 | 5 | 0 |
| B | 0 | 5 | 0 |
| C | 0 | 5 | 0 |
| D | 0 | 5 | 0 |
| Quadrant | Total seconds | Saturated seconds | Saturation percentage |
|---|---|---|---|
| A | 21753 | 1734 | 7.971314% |
| B | 21755 | 586 | 2.693634% |
| C | 21754 | 8798 | 40.443137% |
| D | 21751 | 7375 | 33.906487% |
Noise dominated data is calculated using 1-second bins in cleaned event files. If a bin has >2000 counts, and if more than 50% of those come from <1% of pixels, then it is considered to be noise-dominated and hence unusable.
| Quadrant | # 1 sec bins | Bins with >0 counts | Bins with >2000 counts | High rate bins dominated by noise | Noise dominated (total time) | Noise dominated (detector-on time) | Marked lightcurve |
|---|---|---|---|---|---|---|---|
| A | 22339 | 21754 | 1208 | 1208 | 5.41% | 5.55% | 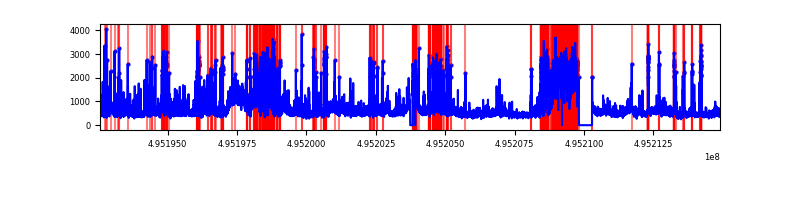 |
| B | 22340 | 21756 | 213 | 213 | 0.95% | 0.98% | 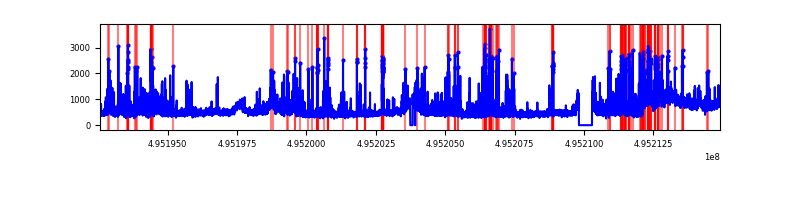 |
| C | 22340 | 21756 | 8430 | 8430 | 37.74% | 38.75% | 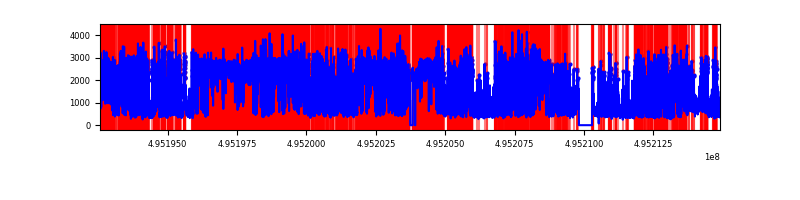 |
| D | 22339 | 21753 | 7566 | 7566 | 33.87% | 34.78% | 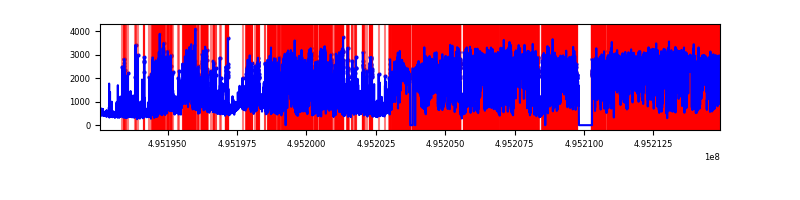 |
Top three noisy pixels from each quadrant. If the there are fewer than three noisy pixels in the level2.evt file, extra rows are filled as -1
| Pixel properties | Quadrant properties | ||||||
|---|---|---|---|---|---|---|---|
| Quadrant | DetID | PixID | Counts | Sigma | Mean | Median | Sigma |
| A | 4 | 249 | 3274365 | 5804.93 | 2267 | 2211 | 563.7 |
| A | 8 | 249 | 2782311 | 4932.0 | 2267 | 2211 | 563.7 |
| A | 0 | 8 | 661807 | 1170.15 | 2267 | 2211 | 563.7 |
| B | 5 | 172 | 1487780 | 3017.53 | 2304 | 2222 | 492.3 |
| B | 7 | 0 | 635863 | 1287.08 | 2304 | 2222 | 492.3 |
| B | 5 | 185 | 592292 | 1198.58 | 2304 | 2222 | 492.3 |
| C | 1 | 241 | 15398551 | 31546.4 | 1783 | 1770 | 488.1 |
| C | 15 | 224 | 4445812 | 9105.38 | 1783 | 1770 | 488.1 |
| C | 15 | 158 | 1525224 | 3121.4 | 1783 | 1770 | 488.1 |
| D | 15 | 93 | 16527992 | 29559.24 | 1953 | 1865 | 559.1 |
| D | 10 | 172 | 4942138 | 8836.35 | 1953 | 1865 | 559.1 |
| D | 2 | 172 | 1656277 | 2959.14 | 1953 | 1865 | 559.1 |
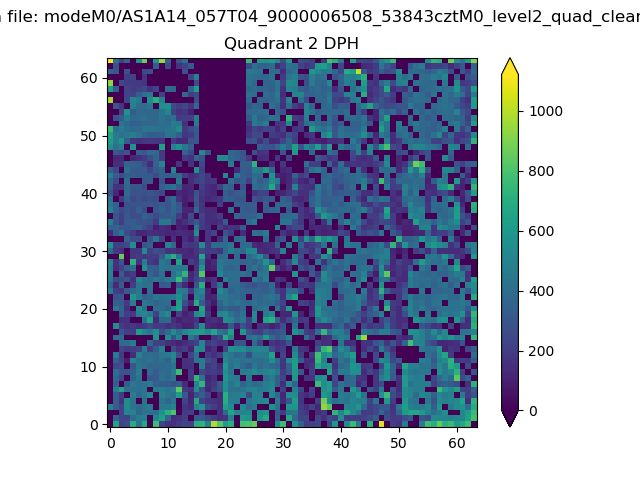
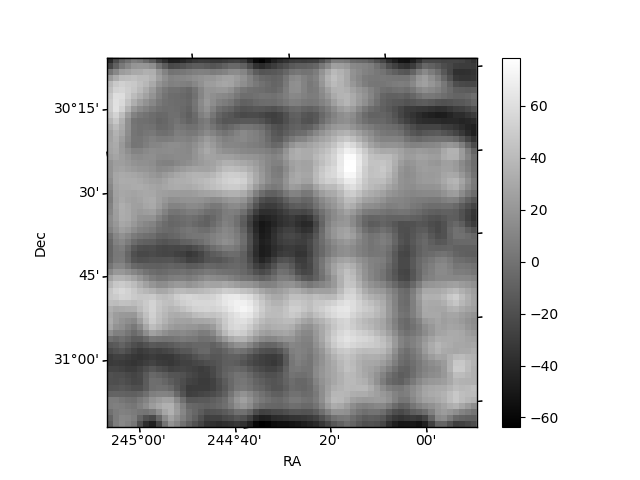
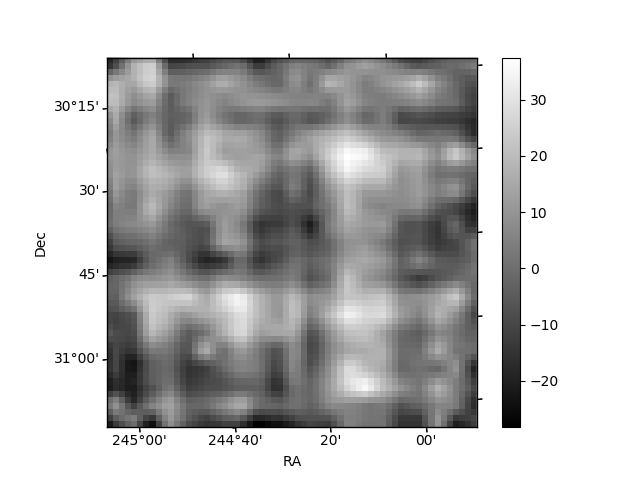
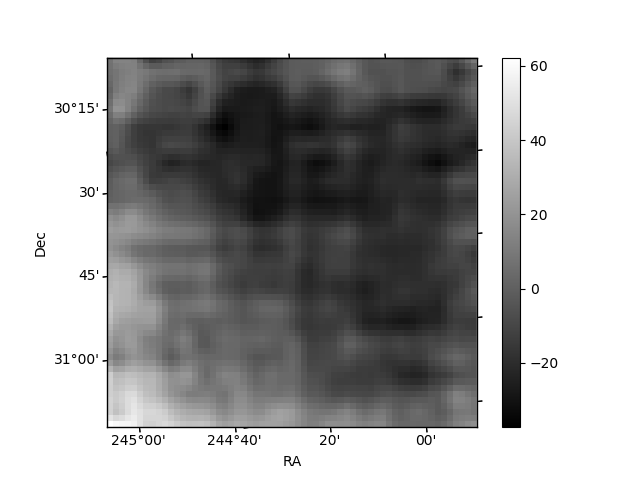
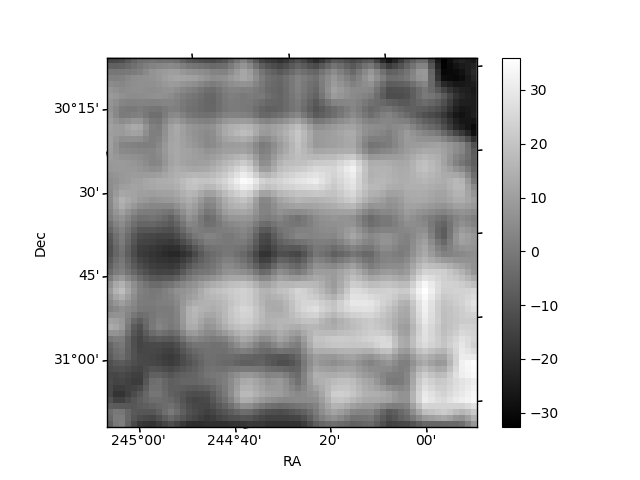
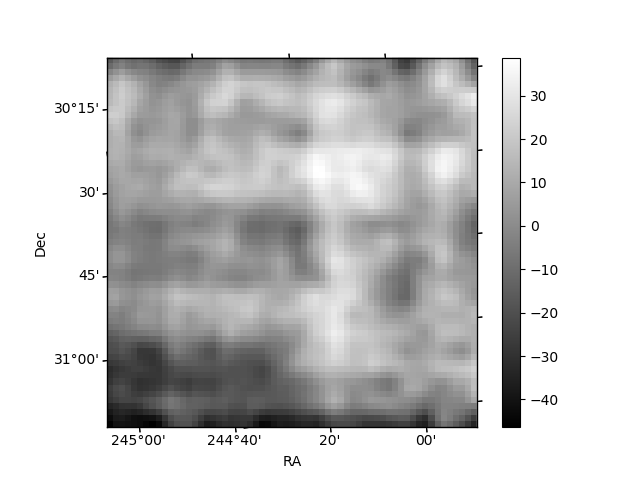
Histogram calculated using DETX and DETY for each event in the final _common_clean file
| Quadrant A | 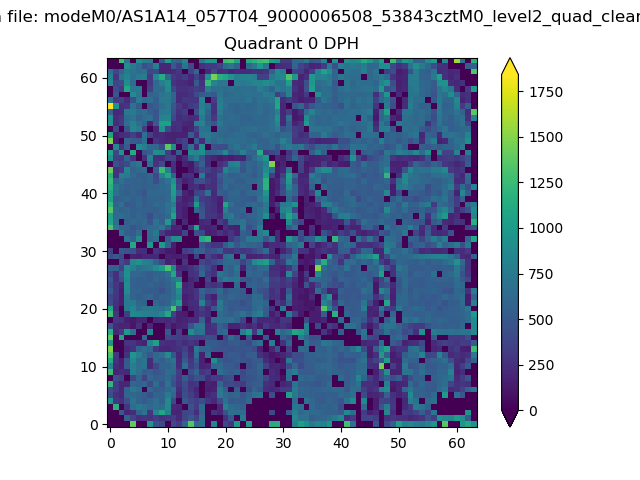 |
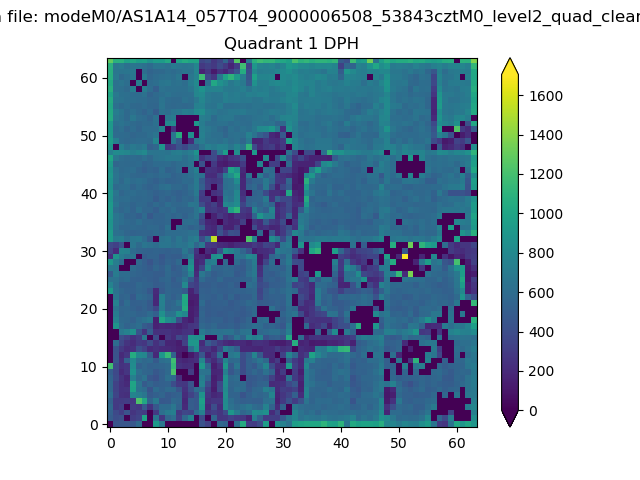 |
Quadrant B |
|---|---|---|---|
| Quadrant D | 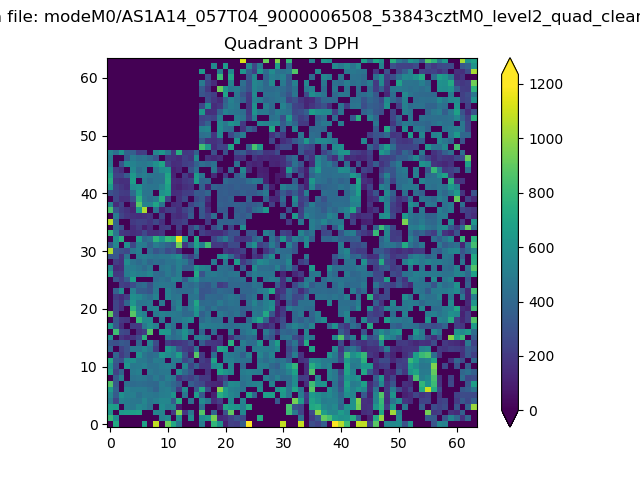 |
 |
Quadrant C |
| Plot type | Count rate plots | Images |
|---|---|---|
| Comparison with Poisson distribution Blue bars denote a histogram of data divided into 1 sec bins. Red curve is a Poisson curve with rate = median count rate of data. |
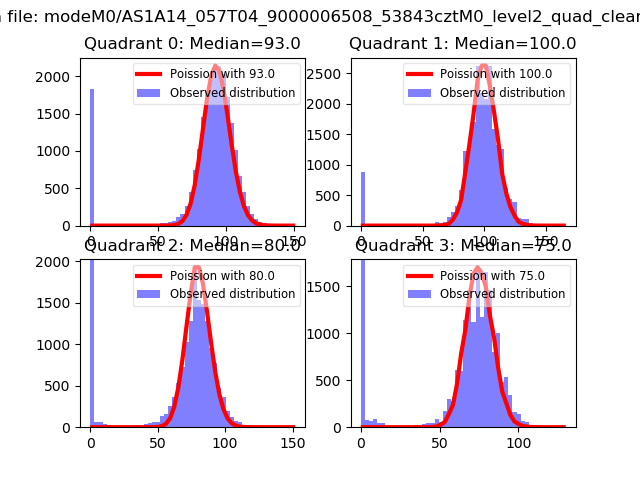 |
 |
| Quadrant-wise count rates Data is divided into 100 sec bins |
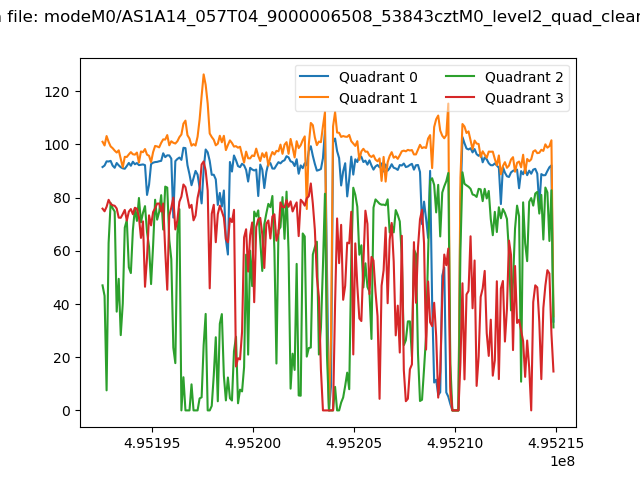 |
|
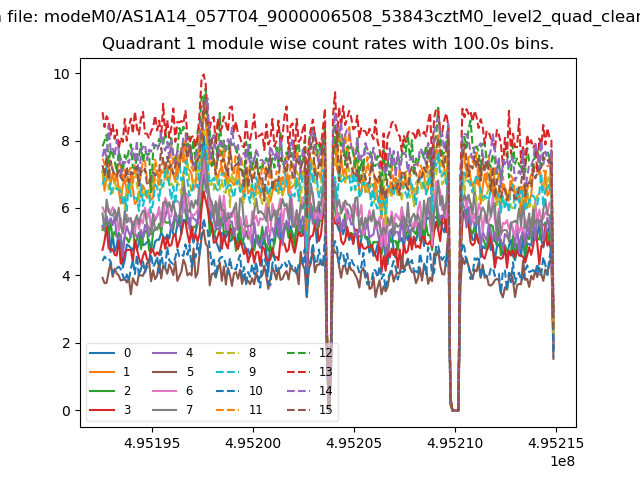
| Module-wise count rates for Quadrant A Data is divided into 100 sec bins |
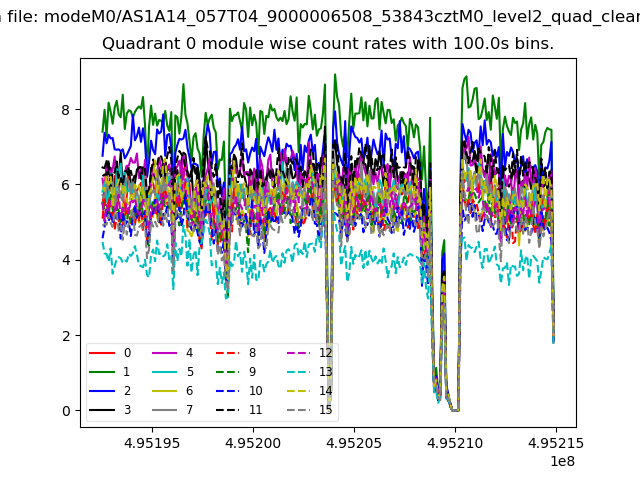 |
 |
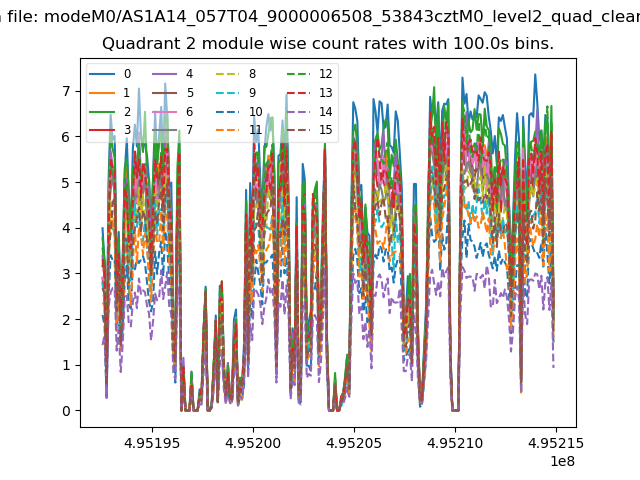
| Module-wise count rates for Quadrant B Data is divided into 100 sec bins |
 |
 |
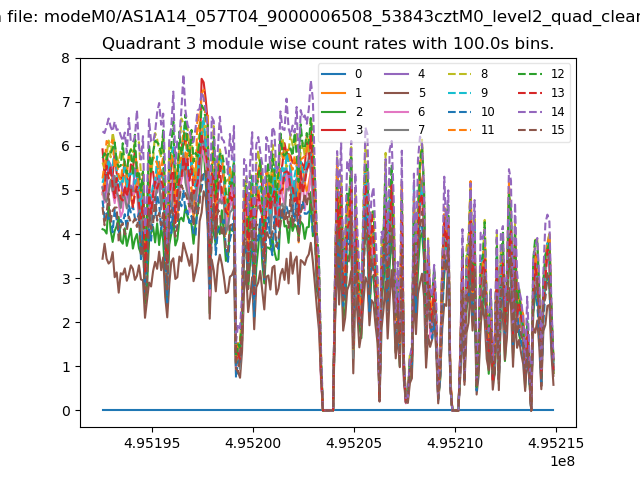
| Module-wise count rates for Quadrant C Data is divided into 100 sec bins |
 |
 |
| Module-wise count rates for Quadrant D Data is divided into 100 sec bins |
 |
 |
| Parameter | Plot |
|---|---|
| CZT HV Monitor | 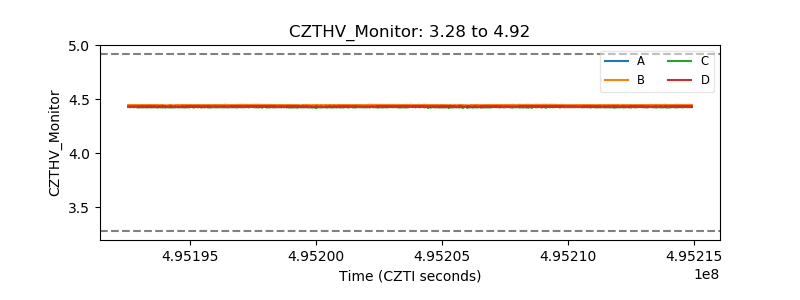 |
| D_VDD | 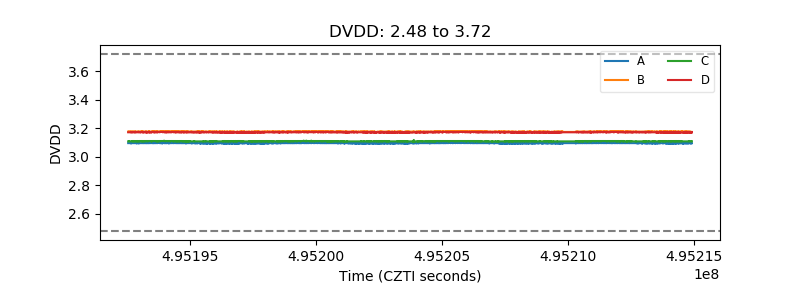 |
| Temperature 1 | 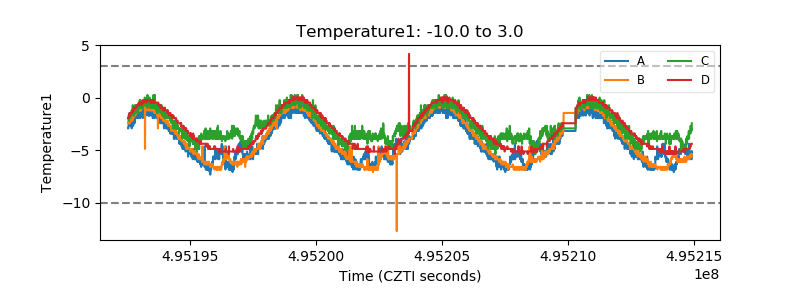 |
| Veto HV Monitor | 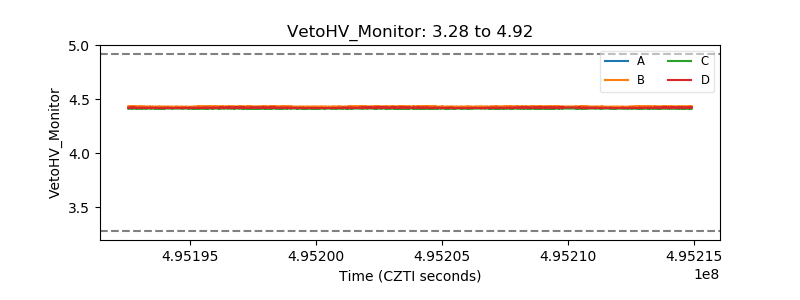 |
| Veto LLD | 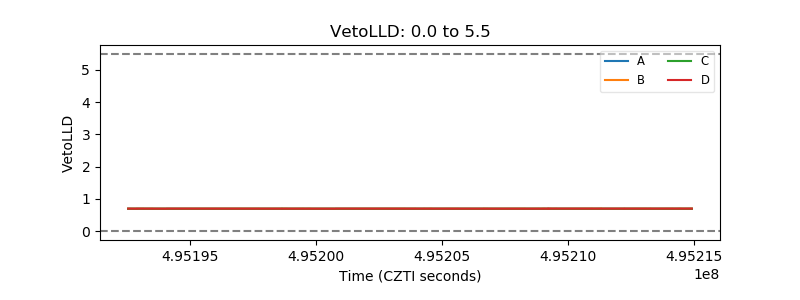 |
| Alpha Counter | 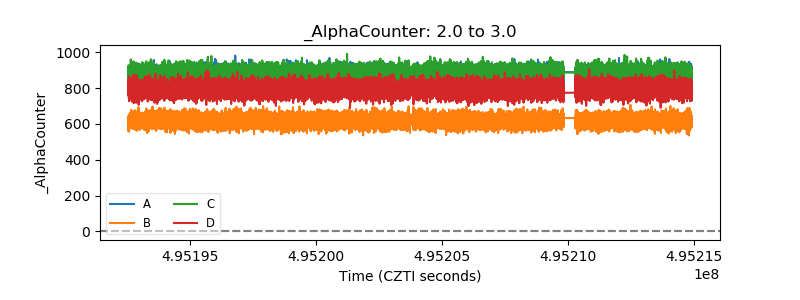 |
| _CPM_Rate | 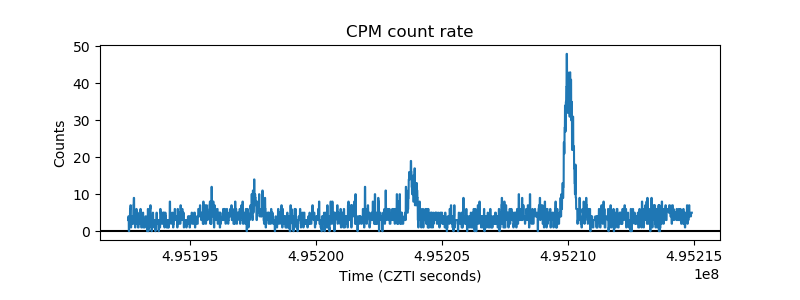 |
| CZT Counter | 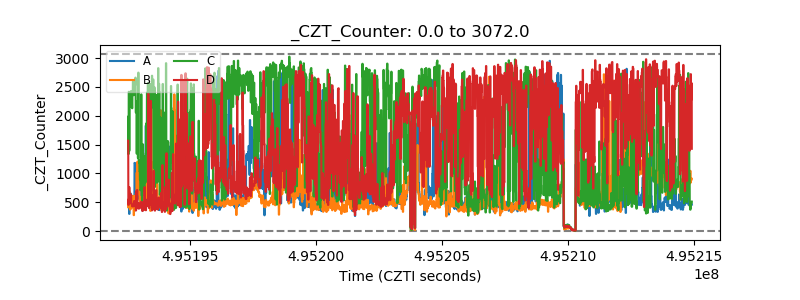 |
| +2.5 Volts monitor |  |
| +5 Volts monitor | 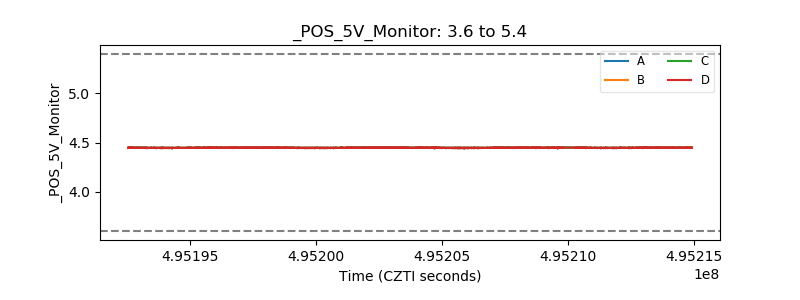 |
| _ROLL_ROT | 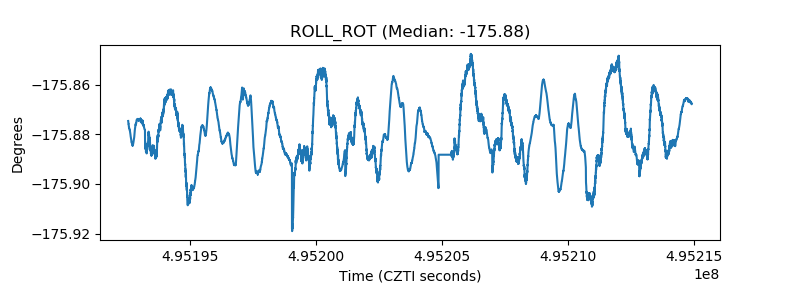 |
| _Roll_DEC | 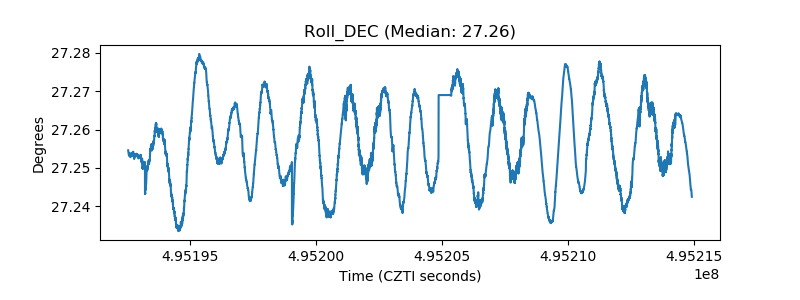 |
| _Roll_RA | 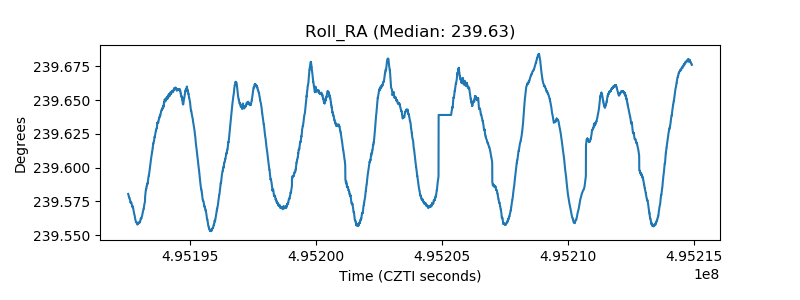 |
| Veto Counter | 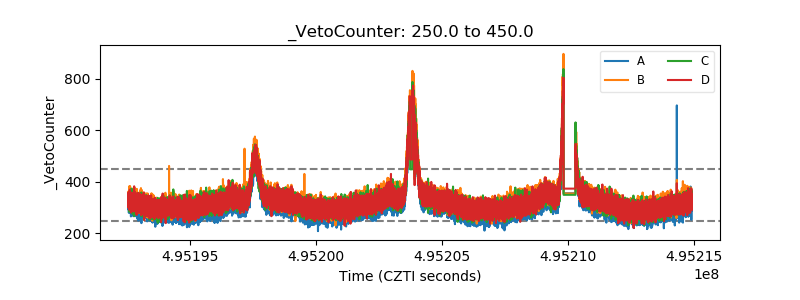 |