| Param | Original file | Final file |
|---|---|---|
| Filename | modeM0/AS1A14_057T04_9000006508_53847cztM0_level2.fits | modeM0/AS1A14_057T04_9000006508_53847cztM0_level2_quad_clean.evt |
| Size (bytes) | 748,005,120 | 90,619,200 |
| Size | 713.4 MB | 86.4 MB |
| Events in quadrant A | 3,537,508 | 676,705 |
| Events in quadrant B | 3,599,140 | 721,631 |
| Events in quadrant C | 9,049,645 | 485,830 |
| Events in quadrant D | 10,983,227 | 392,113 |
| Mode M0 | |||
|---|---|---|---|
| Quadrant | BADHDUFLAG | Total packets | Discarded packets |
| A | 0 | 14984 | 2 |
| B | 0 | 15347 | 2 |
| C | 0 | 31516 | 2 |
| D | 0 | 37166 | 2 |
| Mode SS | |||
|---|---|---|---|
| Quadrant | BADHDUFLAG | Total packets | Discarded packets |
| A | 0 | 136 | 0 |
| B | 0 | 136 | 0 |
| C | 0 | 136 | 0 |
| D | 0 | 136 | 0 |
| Mode M9 | |||
|---|---|---|---|
| Quadrant | BADHDUFLAG | Total packets | Discarded packets |
| A | 0 | 19 | 0 |
| B | 0 | 20 | 0 |
| C | 0 | 20 | 0 |
| D | 0 | 20 | 0 |
| Quadrant | Total seconds | Saturated seconds | Saturation percentage |
|---|---|---|---|
| A | 6707 | 89 | 1.326972% |
| B | 6707 | 128 | 1.908454% |
| C | 6707 | 1931 | 28.790816% |
| D | 6707 | 2653 | 39.555688% |
Noise dominated data is calculated using 1-second bins in cleaned event files. If a bin has >2000 counts, and if more than 50% of those come from <1% of pixels, then it is considered to be noise-dominated and hence unusable.
| Quadrant | # 1 sec bins | Bins with >0 counts | Bins with >2000 counts | High rate bins dominated by noise | Noise dominated (total time) | Noise dominated (detector-on time) | Marked lightcurve |
|---|---|---|---|---|---|---|---|
| A | 7892 | 6708 | 62 | 62 | 0.79% | 0.92% | 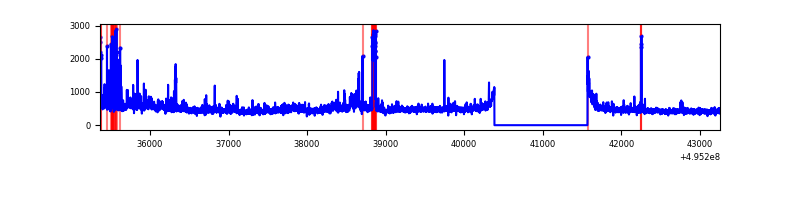 |
| B | 7892 | 6707 | 47 | 47 | 0.60% | 0.70% | 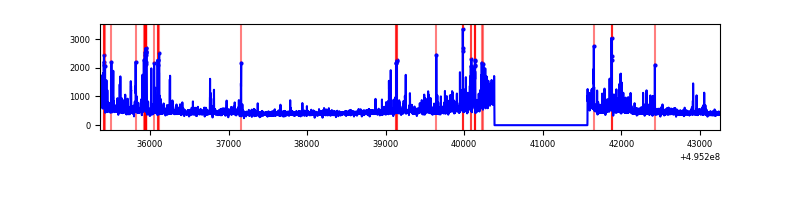 |
| C | 7892 | 6707 | 1929 | 1929 | 24.44% | 28.76% | 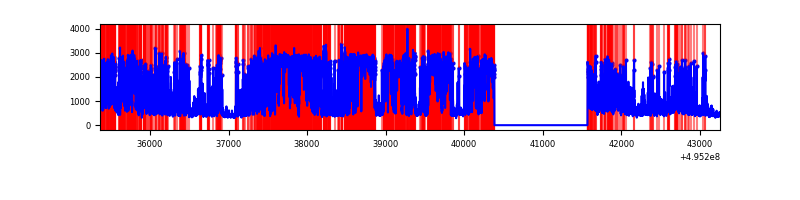 |
| D | 7892 | 6707 | 2754 | 2754 | 34.90% | 41.06% | 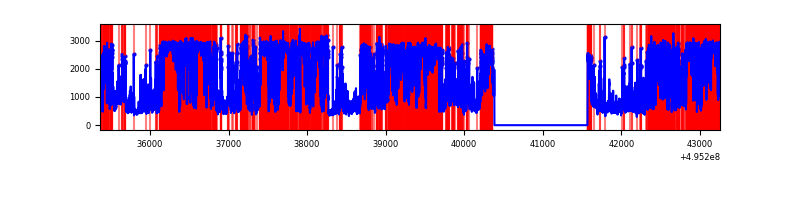 |
Top three noisy pixels from each quadrant. If the there are fewer than three noisy pixels in the level2.evt file, extra rows are filled as -1
| Pixel properties | Quadrant properties | ||||||
|---|---|---|---|---|---|---|---|
| Quadrant | DetID | PixID | Counts | Sigma | Mean | Median | Sigma |
| A | 8 | 249 | 233747 | 1259.3 | 738 | 719 | 185.0 |
| A | 12 | 115 | 108435 | 582.1 | 738 | 719 | 185.0 |
| A | 15 | 174 | 88995 | 477.05 | 738 | 719 | 185.0 |
| B | 0 | 213 | 198286 | 1262.07 | 734 | 710 | 156.5 |
| B | 0 | 171 | 142762 | 907.4 | 734 | 710 | 156.5 |
| B | 5 | 185 | 102943 | 653.04 | 734 | 710 | 156.5 |
| C | 1 | 241 | 3269147 | 18993.4 | 623 | 619 | 172.1 |
| C | 15 | 224 | 3003376 | 17449.0 | 623 | 619 | 172.1 |
| C | 13 | 3 | 91550 | 528.4 | 623 | 619 | 172.1 |
| D | 15 | 93 | 6817277 | 41122.51 | 572 | 548 | 165.8 |
| D | 10 | 172 | 879893 | 5304.73 | 572 | 548 | 165.8 |
| D | 13 | 153 | 235757 | 1418.92 | 572 | 548 | 165.8 |
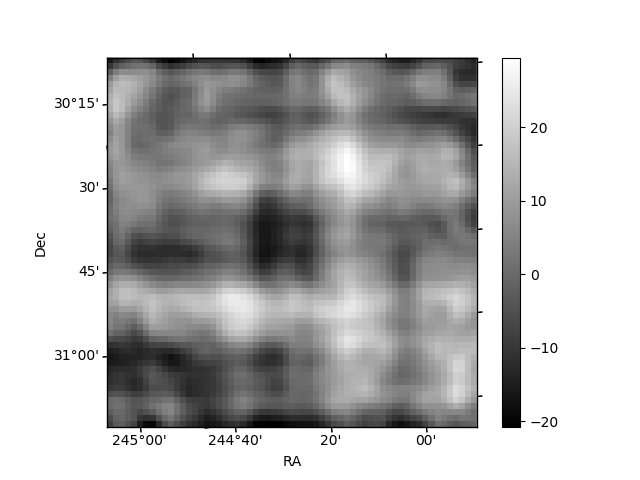
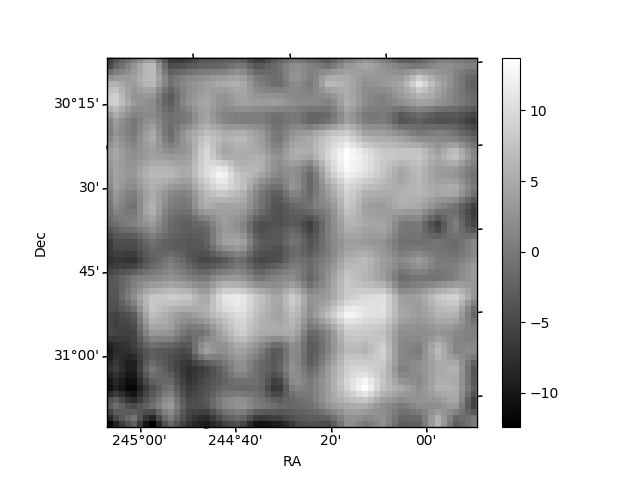
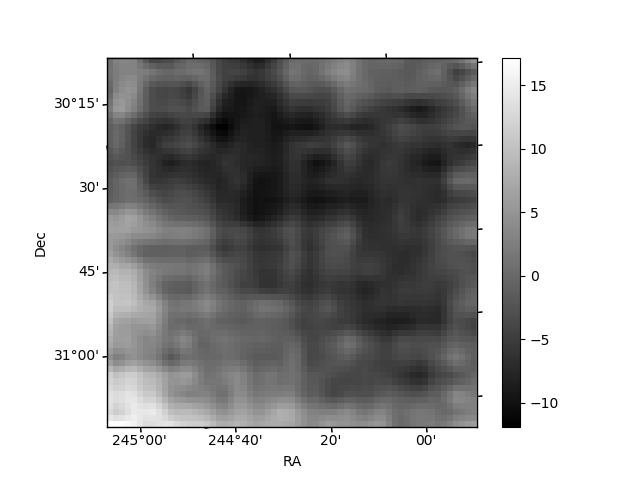
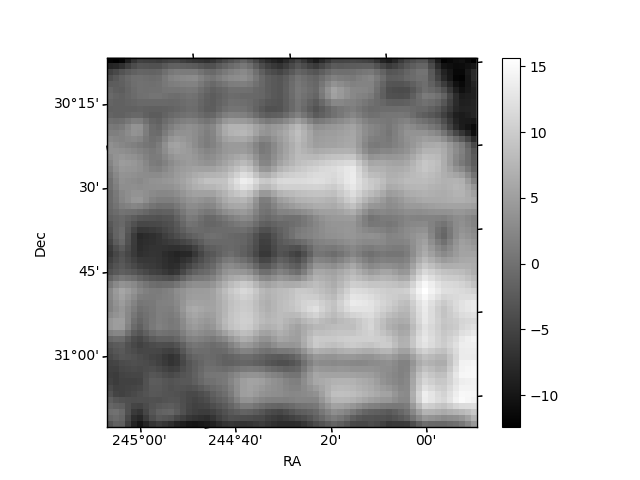
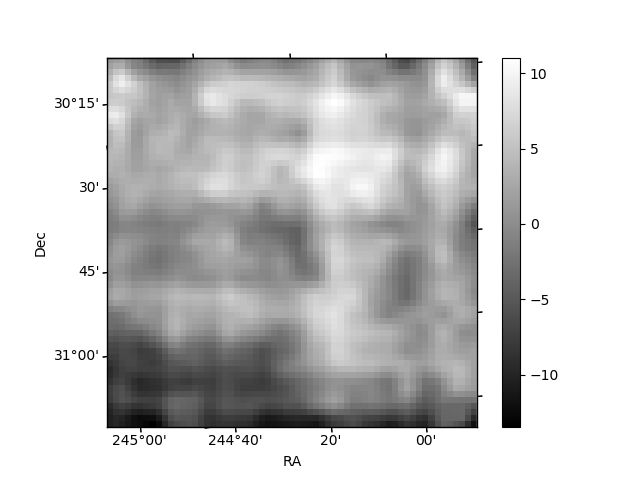
Histogram calculated using DETX and DETY for each event in the final _common_clean file
| Quadrant A | 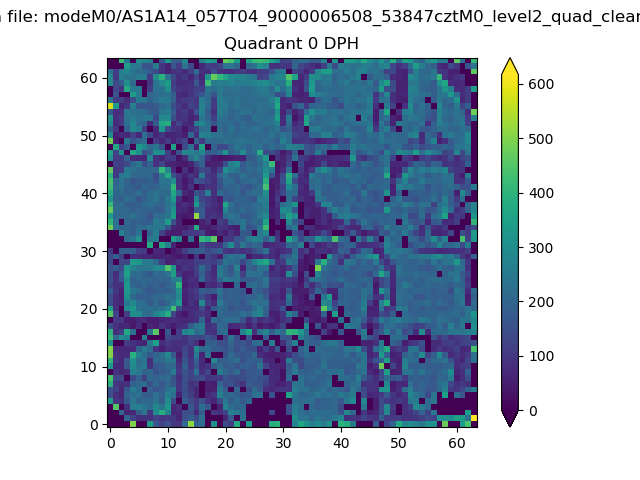 |
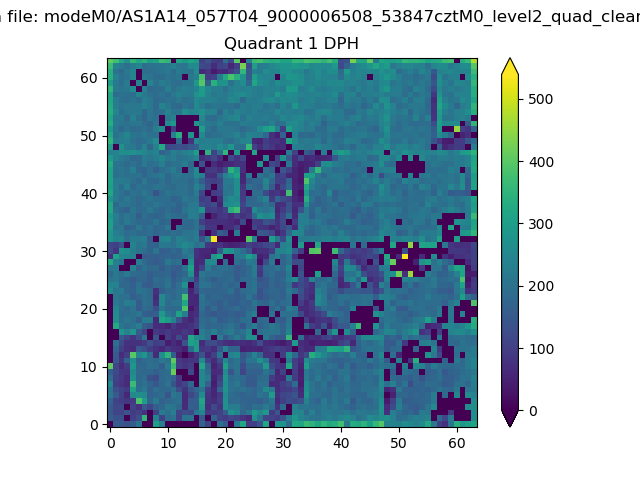 |
Quadrant B |
|---|---|---|---|
| Quadrant D |  |
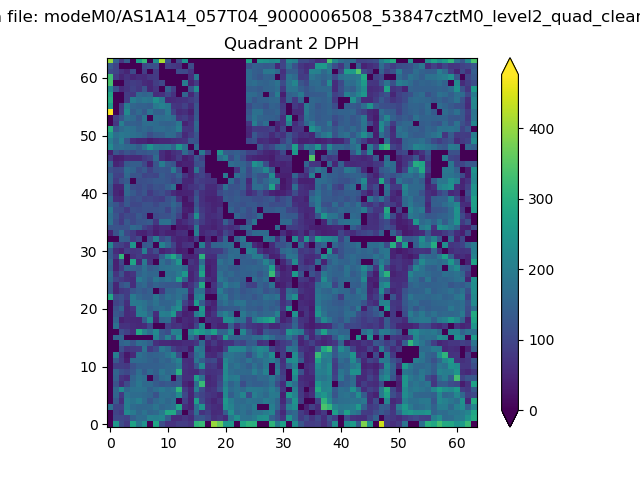 |
Quadrant C |
| Plot type | Count rate plots | Images |
|---|---|---|
| Comparison with Poisson distribution Blue bars denote a histogram of data divided into 1 sec bins. Red curve is a Poisson curve with rate = median count rate of data. |
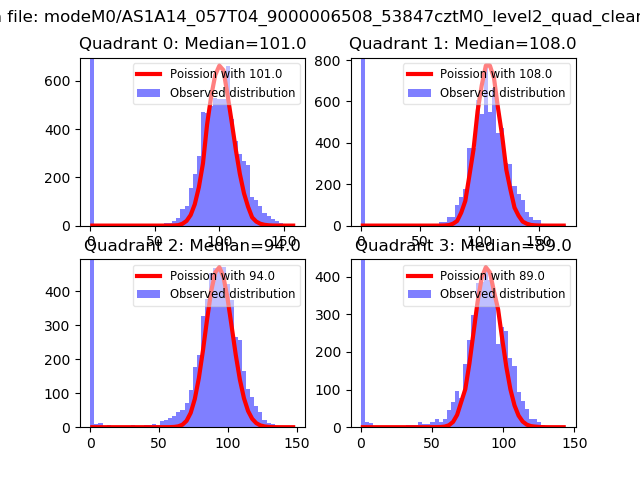 |
 |
| Quadrant-wise count rates Data is divided into 100 sec bins |
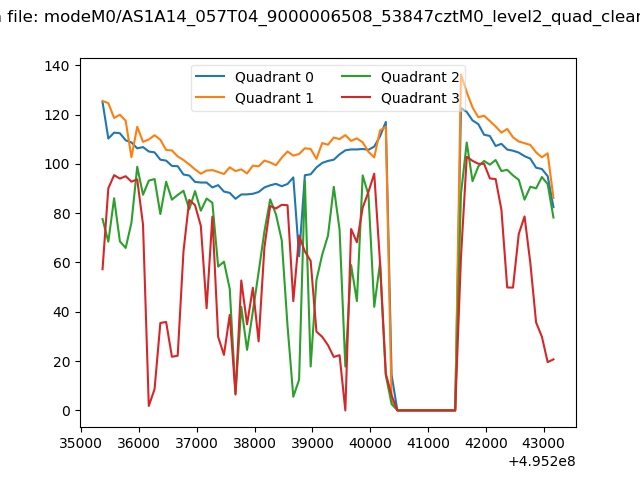 |
|
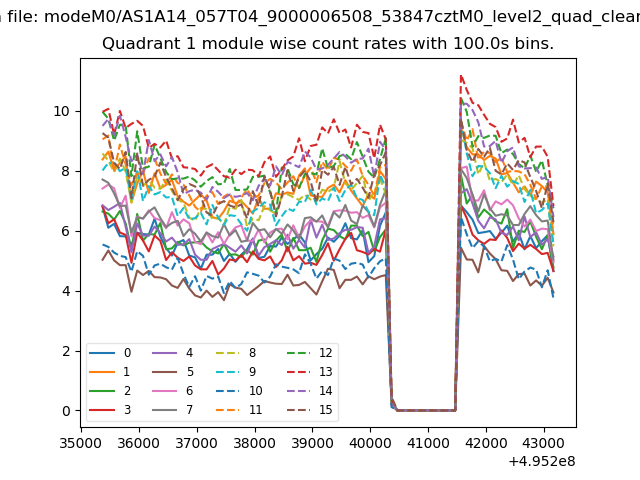
| Module-wise count rates for Quadrant A Data is divided into 100 sec bins |
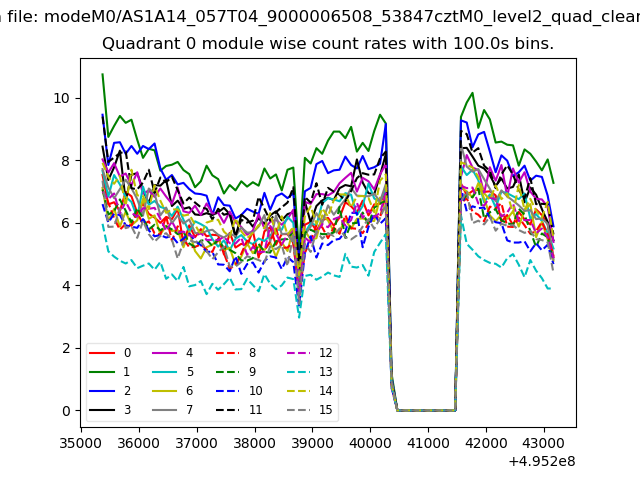 |
 |
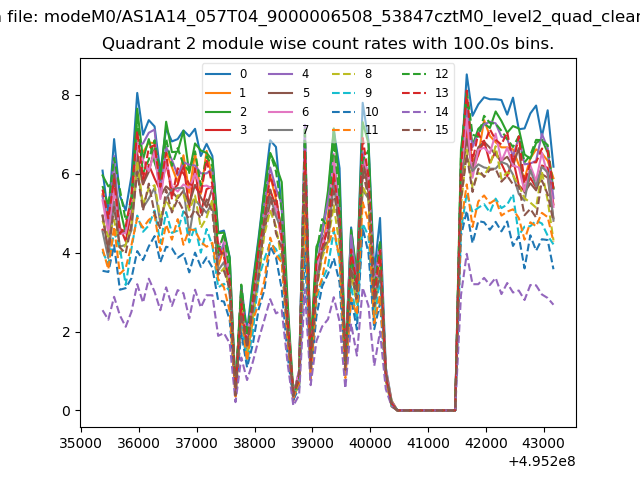
| Module-wise count rates for Quadrant B Data is divided into 100 sec bins |
 |
 |
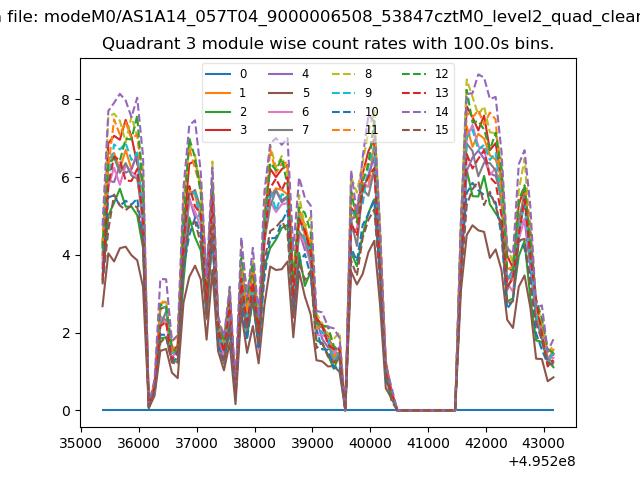
| Module-wise count rates for Quadrant C Data is divided into 100 sec bins |
 |
 |
| Module-wise count rates for Quadrant D Data is divided into 100 sec bins |
 |
 |
| Parameter | Plot |
|---|---|
| CZT HV Monitor | 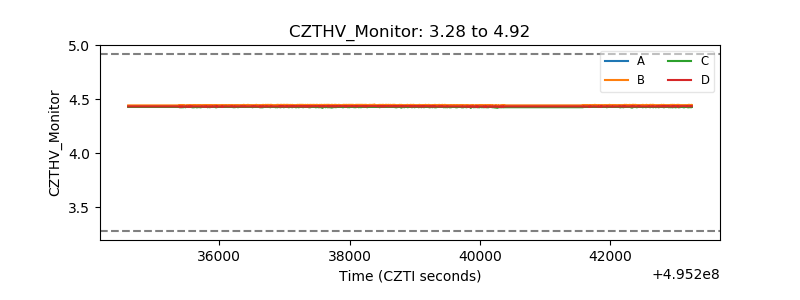 |
| D_VDD | 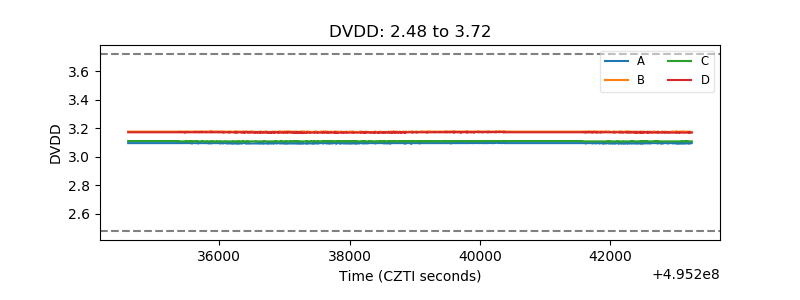 |
| Temperature 1 | 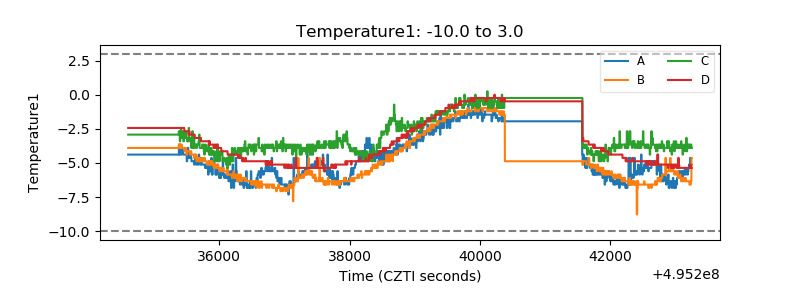 |
| Veto HV Monitor |  |
| Veto LLD | 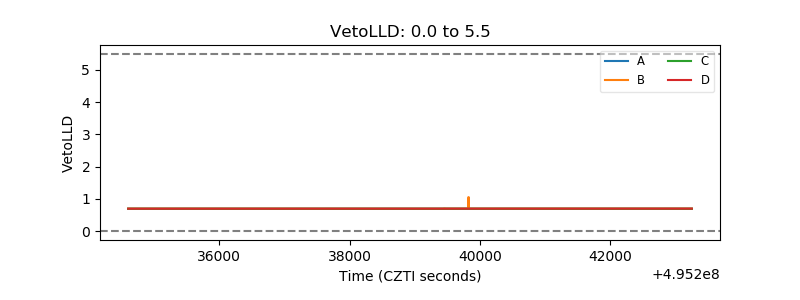 |
| Alpha Counter | 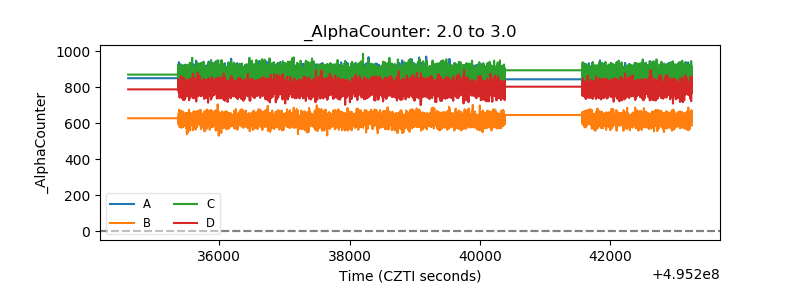 |
| _CPM_Rate | 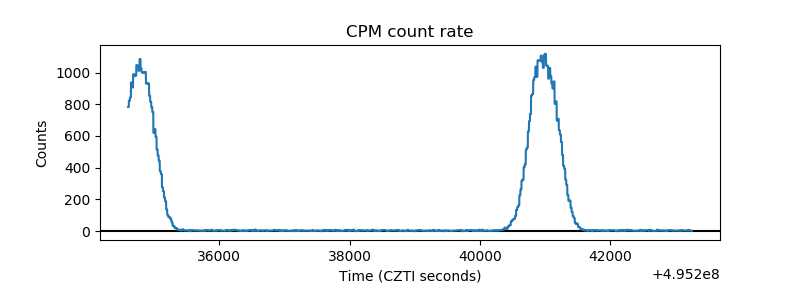 |
| CZT Counter | 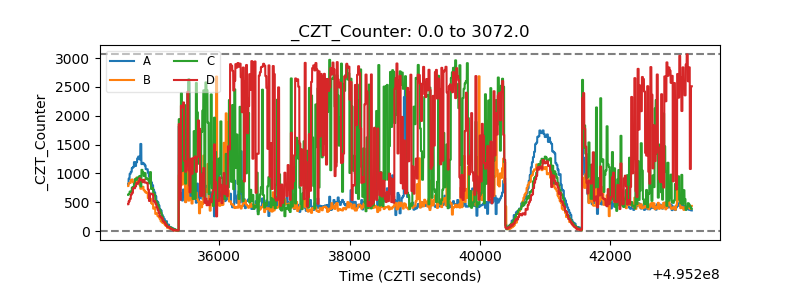 |
| +2.5 Volts monitor | 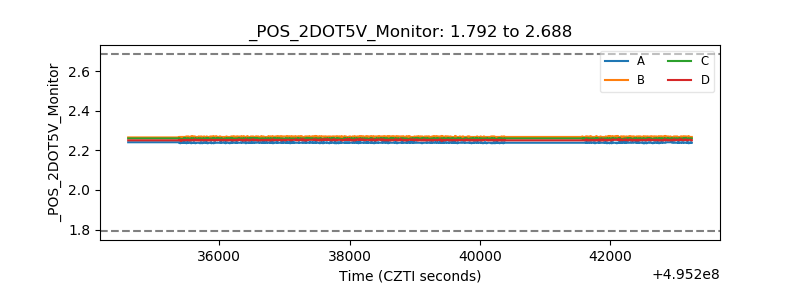 |
| +5 Volts monitor | 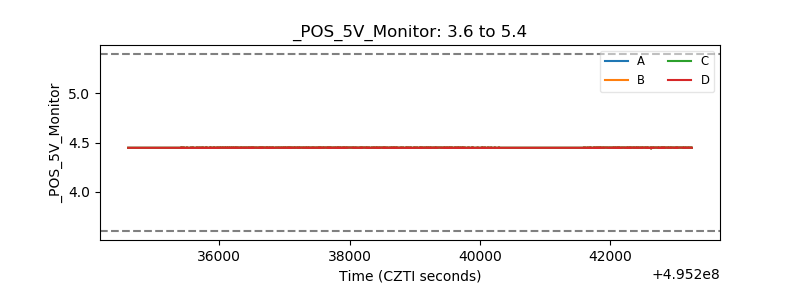 |
| _ROLL_ROT | 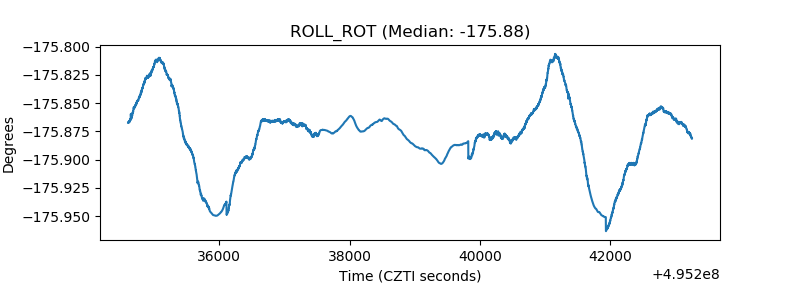 |
| _Roll_DEC | 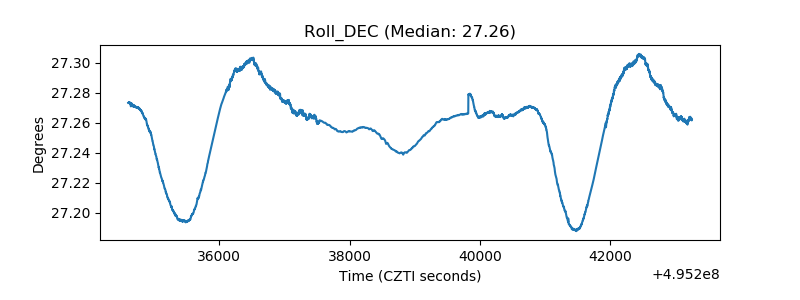 |
| _Roll_RA | 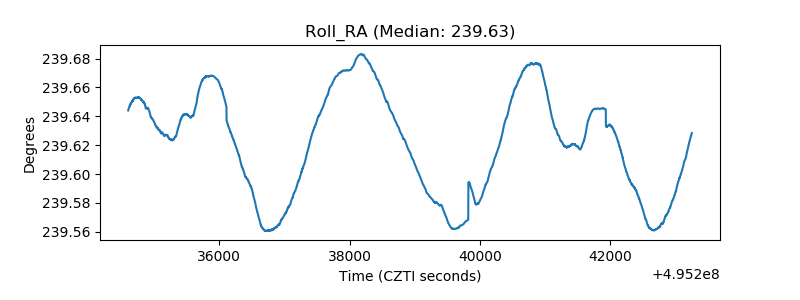 |
| Veto Counter | 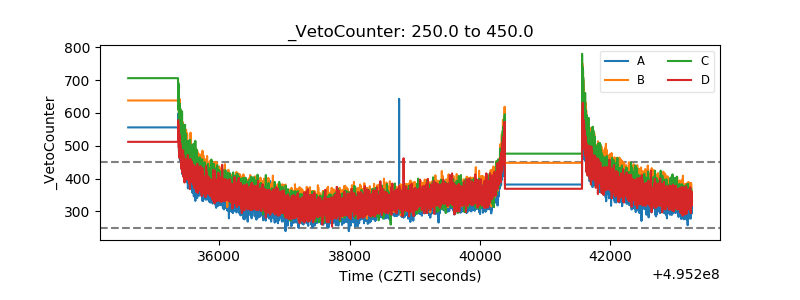 |