| Param | Original file | Final file |
|---|---|---|
| Filename | modeM0/AS1A14_057T04_9000006508_53848cztM0_level2.fits | modeM0/AS1A14_057T04_9000006508_53848cztM0_level2_quad_clean.evt |
| Size (bytes) | 704,482,560 | 90,717,120 |
| Size | 671.8 MB | 86.5 MB |
| Events in quadrant A | 3,253,951 | 670,450 |
| Events in quadrant B | 3,524,752 | 703,930 |
| Events in quadrant C | 8,511,504 | 504,122 |
| Events in quadrant D | 10,279,182 | 410,490 |
| Mode M0 | |||
|---|---|---|---|
| Quadrant | BADHDUFLAG | Total packets | Discarded packets |
| A | 0 | 14165 | 2 |
| B | 0 | 14965 | 2 |
| C | 0 | 29835 | 2 |
| D | 0 | 34952 | 2 |
| Mode SS | |||
|---|---|---|---|
| Quadrant | BADHDUFLAG | Total packets | Discarded packets |
| A | 0 | 134 | 0 |
| B | 0 | 134 | 0 |
| C | 0 | 134 | 0 |
| D | 0 | 134 | 0 |
| Mode M9 | |||
|---|---|---|---|
| Quadrant | BADHDUFLAG | Total packets | Discarded packets |
| A | 0 | 12 | 0 |
| B | 0 | 12 | 0 |
| C | 0 | 12 | 0 |
| D | 0 | 12 | 0 |
| Quadrant | Total seconds | Saturated seconds | Saturation percentage |
|---|---|---|---|
| A | 6559 | 54 | 0.823296% |
| B | 6559 | 147 | 2.241195% |
| C | 6560 | 1628 | 24.817073% |
| D | 6560 | 2351 | 35.838415% |
Noise dominated data is calculated using 1-second bins in cleaned event files. If a bin has >2000 counts, and if more than 50% of those come from <1% of pixels, then it is considered to be noise-dominated and hence unusable.
| Quadrant | # 1 sec bins | Bins with >0 counts | Bins with >2000 counts | High rate bins dominated by noise | Noise dominated (total time) | Noise dominated (detector-on time) | Marked lightcurve |
|---|---|---|---|---|---|---|---|
| A | 7764 | 6559 | 33 | 33 | 0.43% | 0.50% | 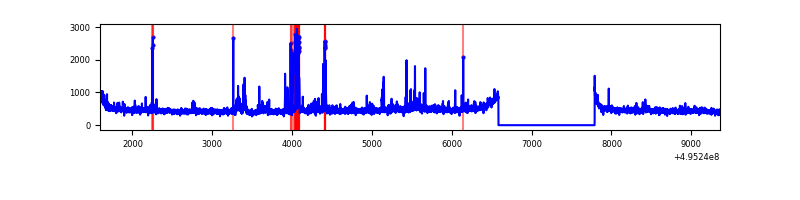 |
| B | 7764 | 6559 | 60 | 60 | 0.77% | 0.91% | 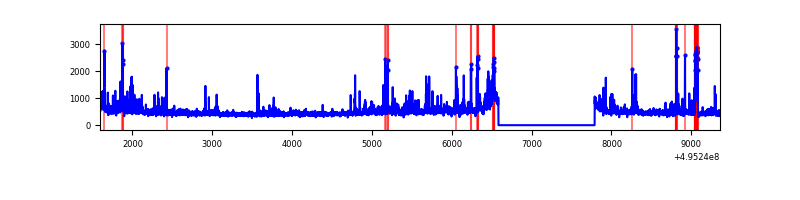 |
| C | 7765 | 6560 | 1626 | 1626 | 20.94% | 24.79% | 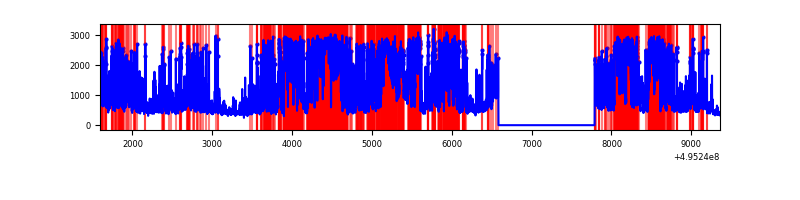 |
| D | 7764 | 6559 | 2472 | 2472 | 31.84% | 37.69% | 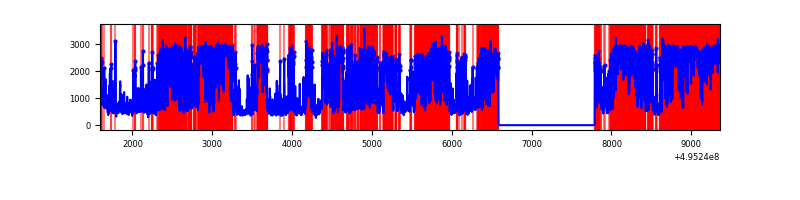 |
Top three noisy pixels from each quadrant. If the there are fewer than three noisy pixels in the level2.evt file, extra rows are filled as -1
| Pixel properties | Quadrant properties | ||||||
|---|---|---|---|---|---|---|---|
| Quadrant | DetID | PixID | Counts | Sigma | Mean | Median | Sigma |
| A | 8 | 6 | 118716 | 650.31 | 733 | 713 | 181.5 |
| A | 0 | 8 | 105141 | 575.5 | 733 | 713 | 181.5 |
| A | 4 | 249 | 42926 | 232.63 | 733 | 713 | 181.5 |
| B | 0 | 171 | 156666 | 1009.89 | 725 | 702 | 154.4 |
| B | 10 | 247 | 137814 | 887.82 | 725 | 702 | 154.4 |
| B | 0 | 213 | 126228 | 812.8 | 725 | 702 | 154.4 |
| C | 1 | 241 | 3675982 | 20654.53 | 646 | 640 | 177.9 |
| C | 15 | 224 | 1930589 | 10845.85 | 646 | 640 | 177.9 |
| C | 9 | 38 | 83648 | 466.48 | 646 | 640 | 177.9 |
| D | 15 | 93 | 6454117 | 38662.3 | 584 | 559 | 166.9 |
| D | 10 | 172 | 675833 | 4045.47 | 584 | 559 | 166.9 |
| D | 8 | 176 | 171055 | 1021.42 | 584 | 559 | 166.9 |
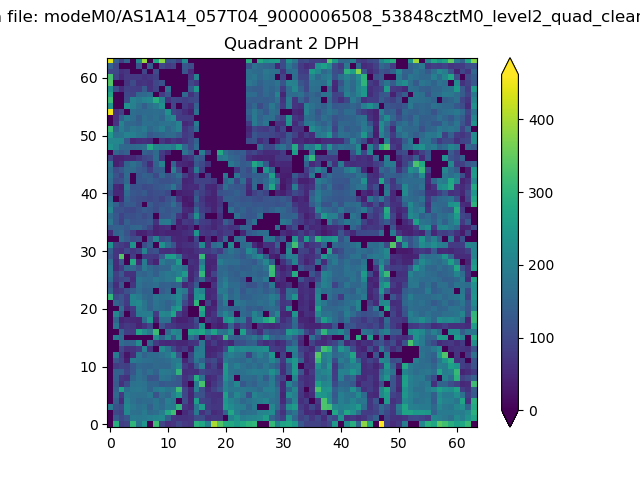
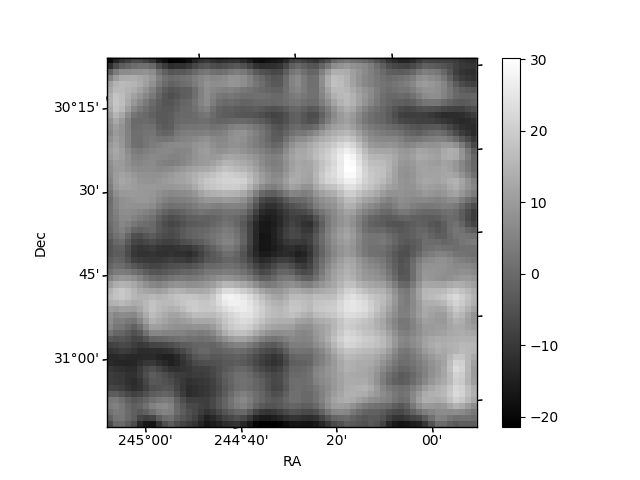
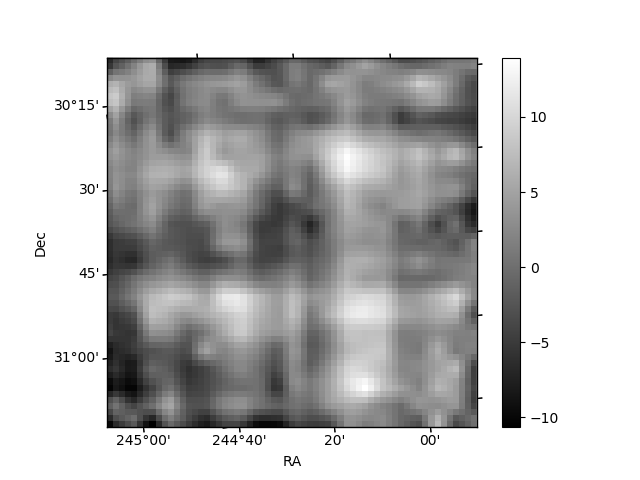
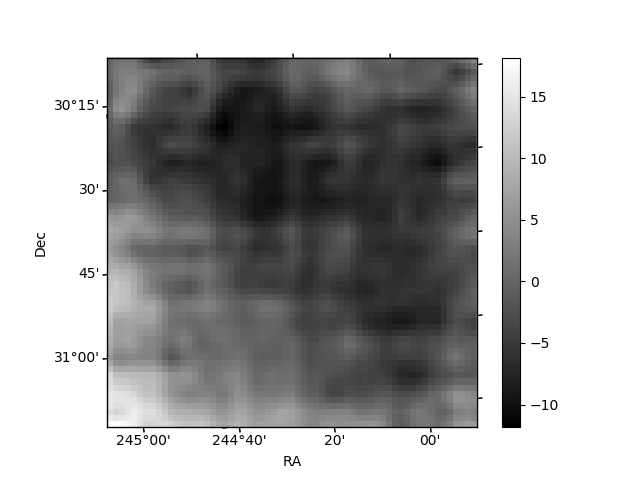
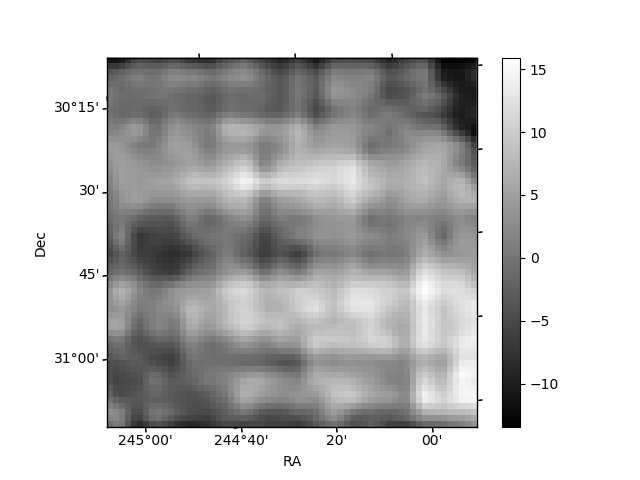
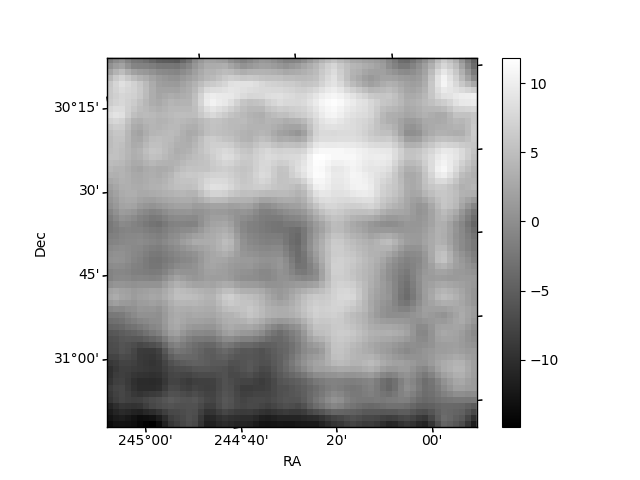
Histogram calculated using DETX and DETY for each event in the final _common_clean file
| Quadrant A | 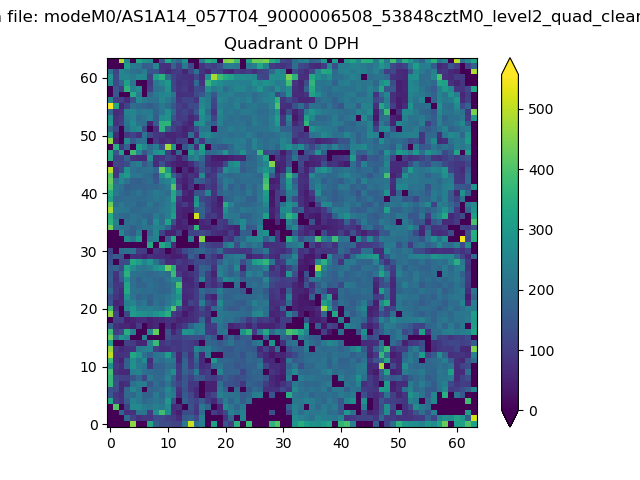 |
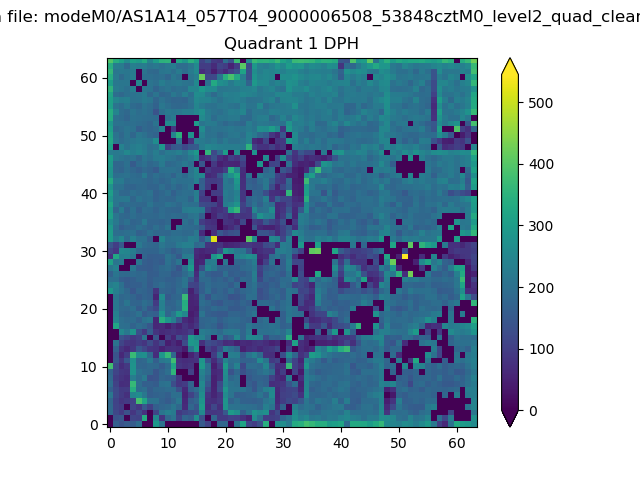 |
Quadrant B |
|---|---|---|---|
| Quadrant D | 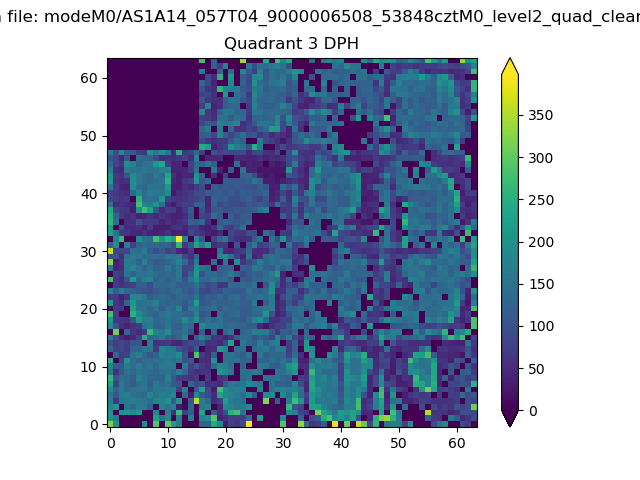 |
 |
Quadrant C |
| Plot type | Count rate plots | Images |
|---|---|---|
| Comparison with Poisson distribution Blue bars denote a histogram of data divided into 1 sec bins. Red curve is a Poisson curve with rate = median count rate of data. |
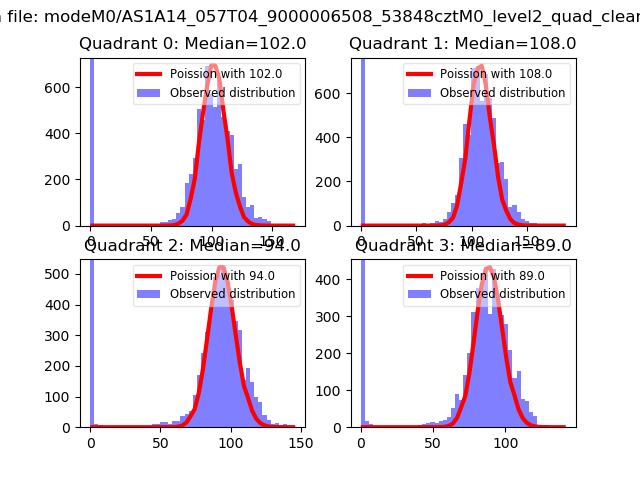 |
 |
| Quadrant-wise count rates Data is divided into 100 sec bins |
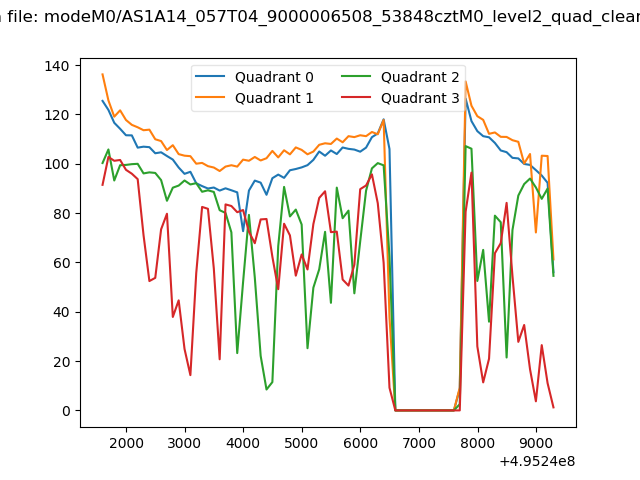 |
|
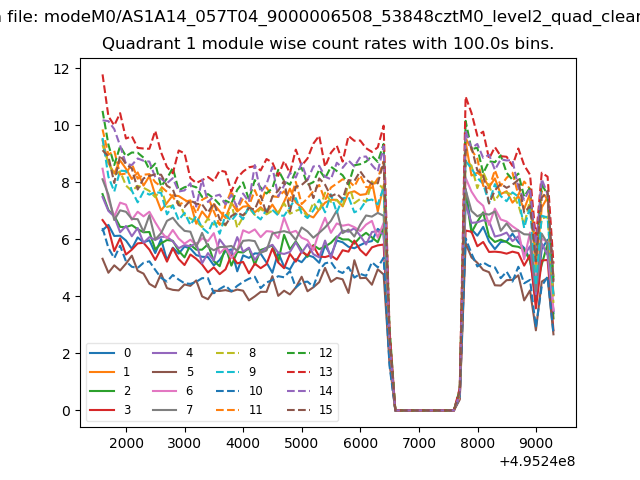
| Module-wise count rates for Quadrant A Data is divided into 100 sec bins |
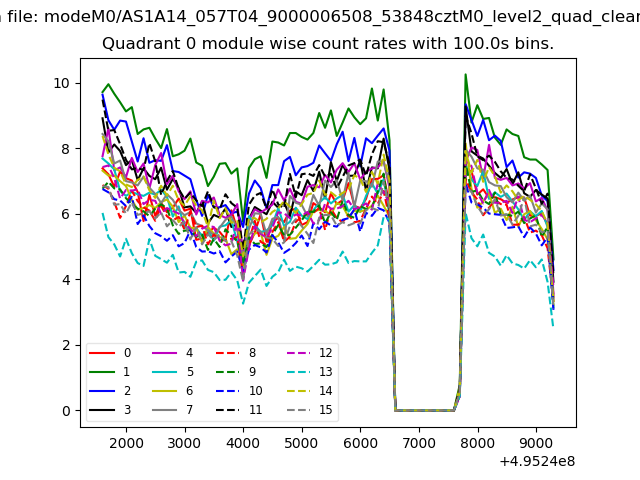 |
 |
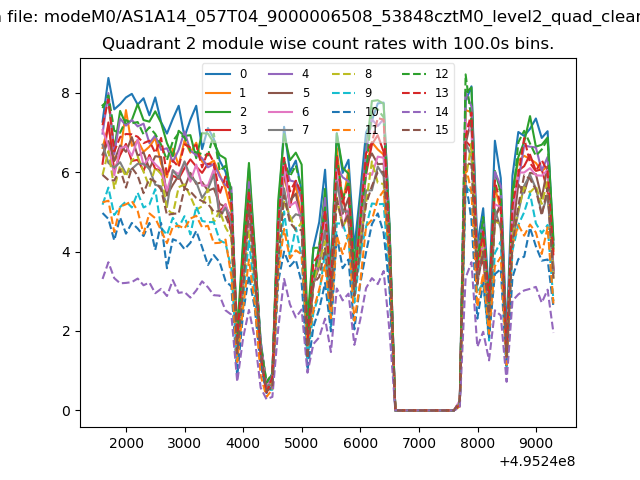
| Module-wise count rates for Quadrant B Data is divided into 100 sec bins |
 |
 |
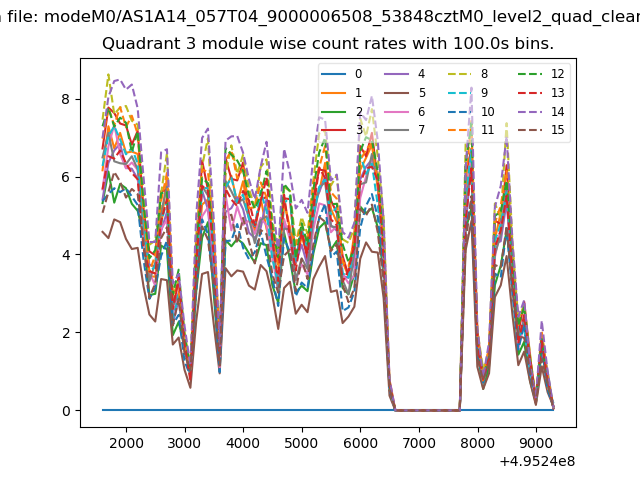
| Module-wise count rates for Quadrant C Data is divided into 100 sec bins |
 |
 |
| Module-wise count rates for Quadrant D Data is divided into 100 sec bins |
 |
 |
| Parameter | Plot |
|---|---|
| CZT HV Monitor | 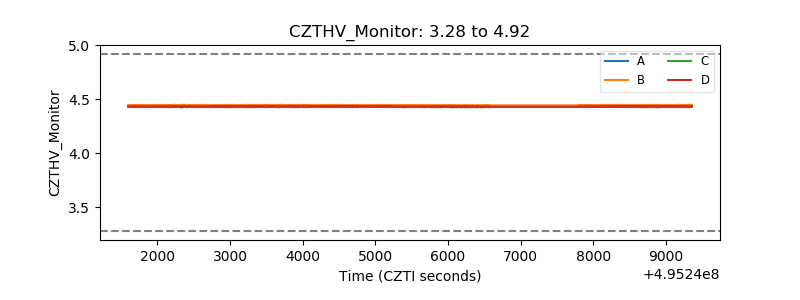 |
| D_VDD | 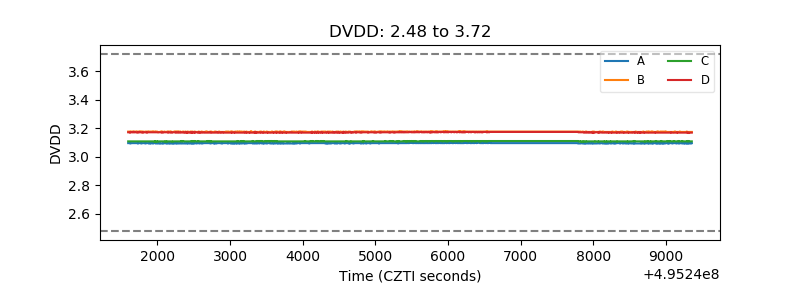 |
| Temperature 1 | 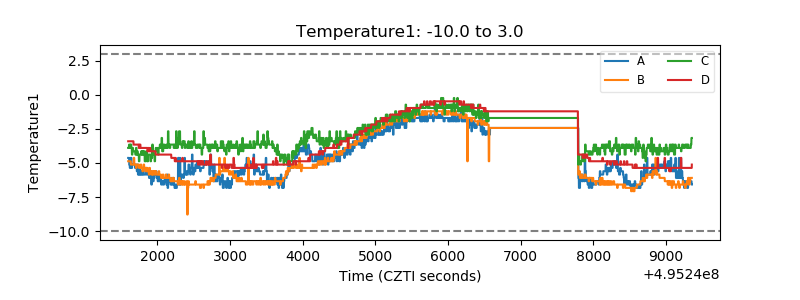 |
| Veto HV Monitor |  |
| Veto LLD | 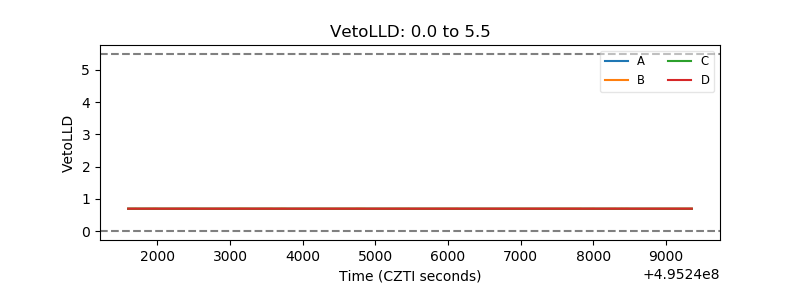 |
| Alpha Counter | 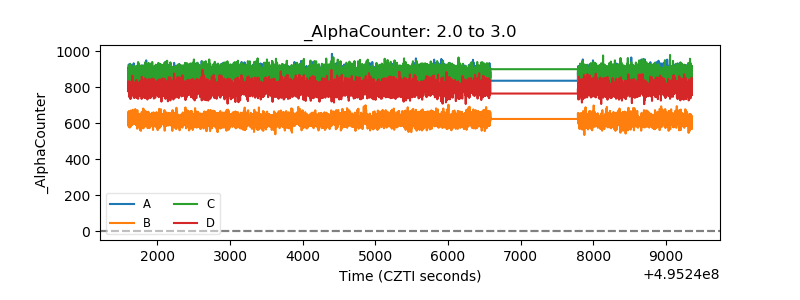 |
| _CPM_Rate | 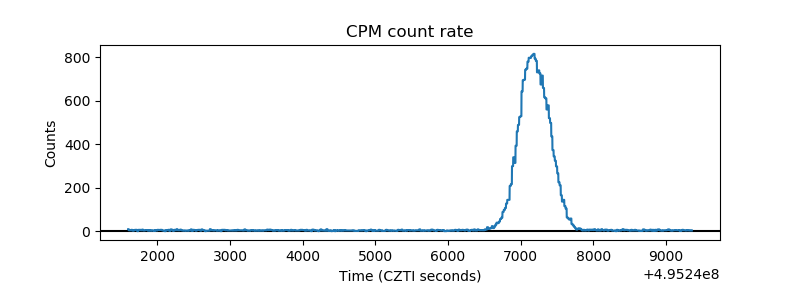 |
| CZT Counter | 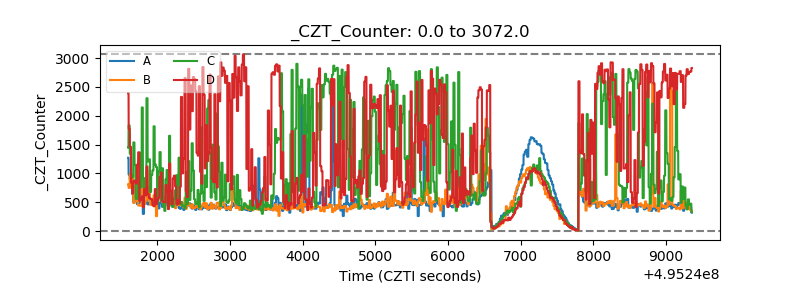 |
| +2.5 Volts monitor | 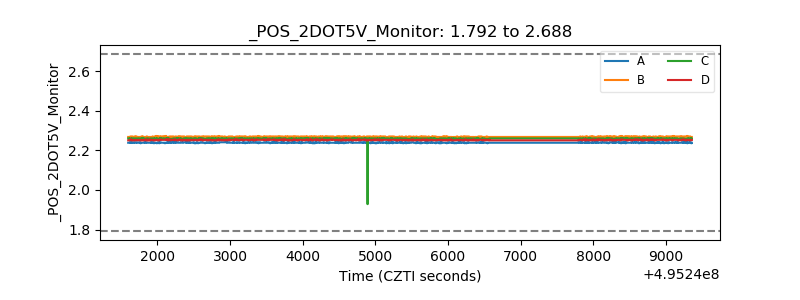 |
| +5 Volts monitor |  |
| _ROLL_ROT | 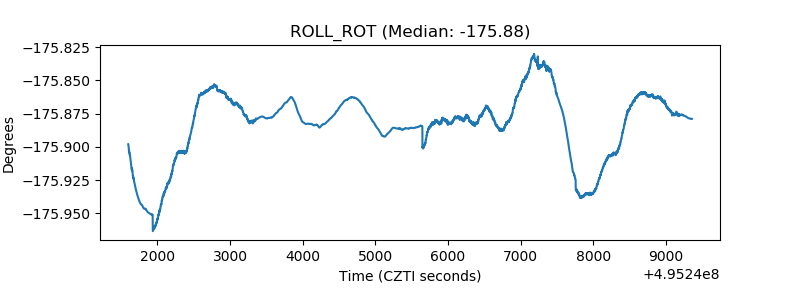 |
| _Roll_DEC | 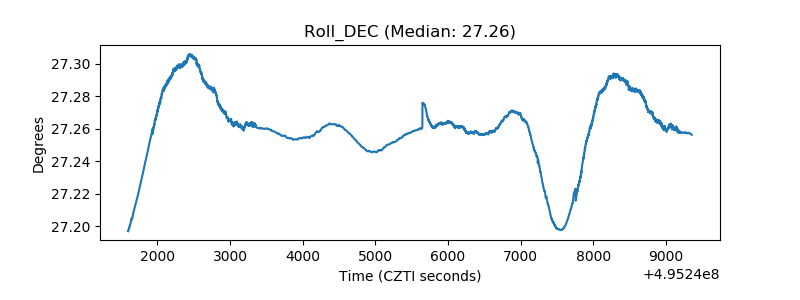 |
| _Roll_RA | 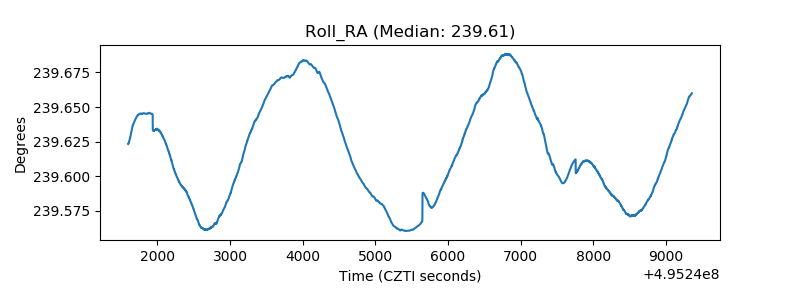 |
| Veto Counter | 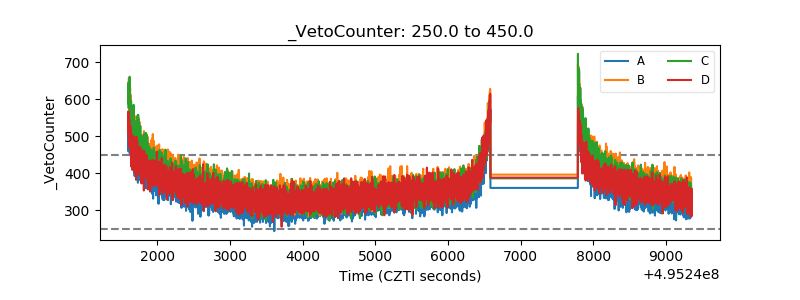 |