| Param | Original file | Final file |
|---|---|---|
| Filename | modeM0/AS1A14_057T04_9000006508_53850cztM0_level2.fits | modeM0/AS1A14_057T04_9000006508_53850cztM0_level2_quad_clean.evt |
| Size (bytes) | 74,162,880 | 10,523,520 |
| Size | 70.7 MB | 10.0 MB |
| Events in quadrant A | 411,143 | 74,923 |
| Events in quadrant B | 440,976 | 84,015 |
| Events in quadrant C | 719,882 | 59,970 |
| Events in quadrant D | 1,106,855 | 35,532 |
| Mode M0 | |||
|---|---|---|---|
| Quadrant | BADHDUFLAG | Total packets | Discarded packets |
| A | 0 | 2938 | 1123 |
| B | 0 | 3073 | 1138 |
| C | 0 | 5156 | 2468 |
| D | 0 | 8393 | 4633 |
| Mode SS | |||
|---|---|---|---|
| Quadrant | BADHDUFLAG | Total packets | Discarded packets |
| A | 0 | 27 | 9 |
| B | 0 | 26 | 8 |
| C | 0 | 25 | 7 |
| D | 0 | 28 | 12 |
| Quadrant | Total seconds | Saturated seconds | Saturation percentage |
|---|---|---|---|
| A | 873 | 2 | 0.229095% |
| B | 893 | 11 | 1.231803% |
| C | 797 | 76 | 9.535759% |
| D | 684 | 246 | 35.964912% |
Noise dominated data is calculated using 1-second bins in cleaned event files. If a bin has >2000 counts, and if more than 50% of those come from <1% of pixels, then it is considered to be noise-dominated and hence unusable.
| Quadrant | # 1 sec bins | Bins with >0 counts | Bins with >2000 counts | High rate bins dominated by noise | Noise dominated (total time) | Noise dominated (detector-on time) | Marked lightcurve |
|---|---|---|---|---|---|---|---|
| A | 5410 | 1035 | 3 | 3 | 0.06% | 0.29% |  |
| B | 5465 | 1055 | 5 | 5 | 0.09% | 0.47% |  |
| C | 5198 | 952 | 82 | 82 | 1.58% | 8.61% | 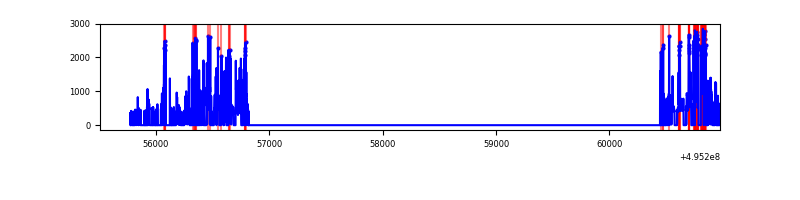 |
| D | 5146 | 784 | 271 | 271 | 5.27% | 34.57% | 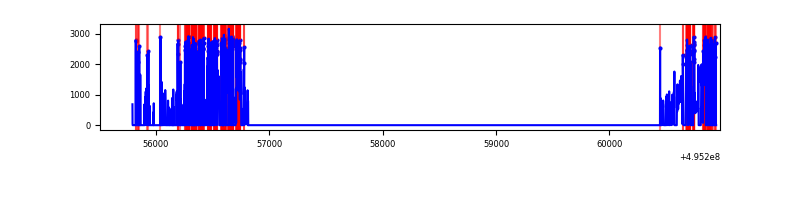 |
Top three noisy pixels from each quadrant. If the there are fewer than three noisy pixels in the level2.evt file, extra rows are filled as -1
| Pixel properties | Quadrant properties | ||||||
|---|---|---|---|---|---|---|---|
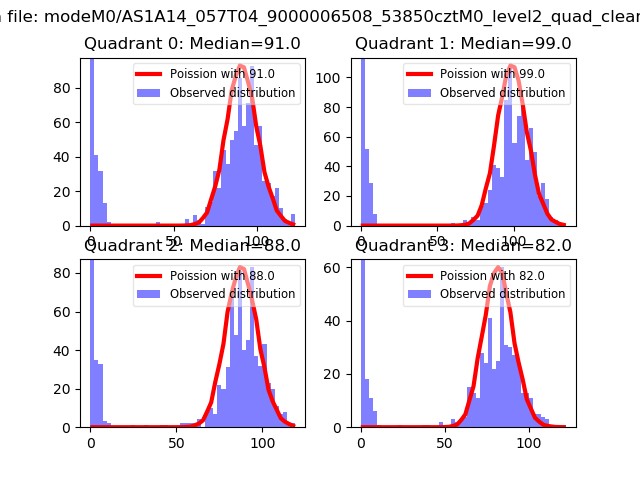
| Quadrant | DetID | PixID | Counts | Sigma | Mean | Median | Sigma |
| A | 8 | 249 | 25054 | 1022.3 | 91 | 88 | 24.4 |
| A | 3 | 62 | 16365 | 666.51 | 91 | 88 | 24.4 |
| A | 4 | 249 | 4854 | 195.16 | 91 | 88 | 24.4 |
| B | 0 | 213 | 42055 | 1922.7 | 93 | 90 | 21.8 |
| B | 0 | 171 | 10457 | 474.98 | 93 | 90 | 21.8 |
| B | 5 | 185 | 6495 | 293.46 | 93 | 90 | 21.8 |
| C | 15 | 224 | 267583 | 11628.05 | 77 | 76 | 23.0 |
| C | 1 | 241 | 144271 | 6267.9 | 77 | 76 | 23.0 |
| C | 1 | 16 | 4400 | 187.96 | 77 | 76 | 23.0 |
| D | 15 | 93 | 723549 | 40666.78 | 57 | 55 | 17.8 |
| D | 8 | 240 | 50642 | 2843.44 | 57 | 55 | 17.8 |
| D | 3 | 224 | 26557 | 1489.65 | 57 | 55 | 17.8 |
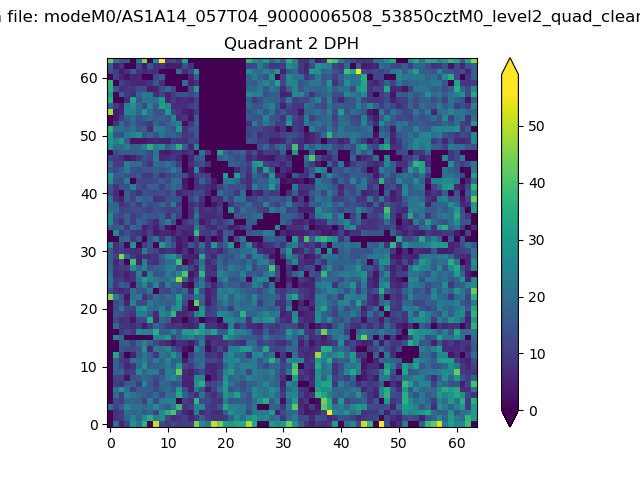
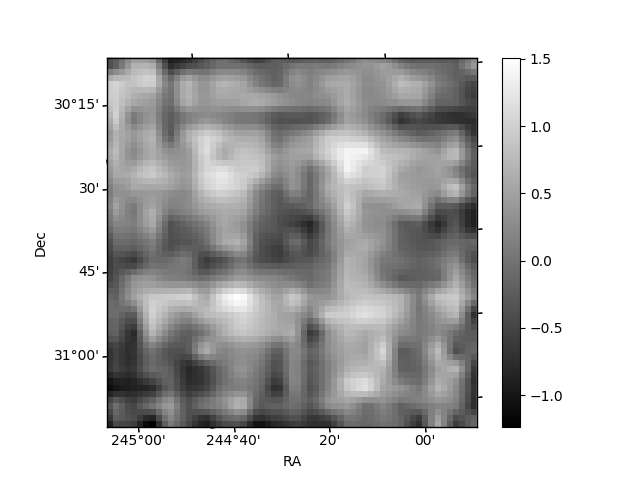
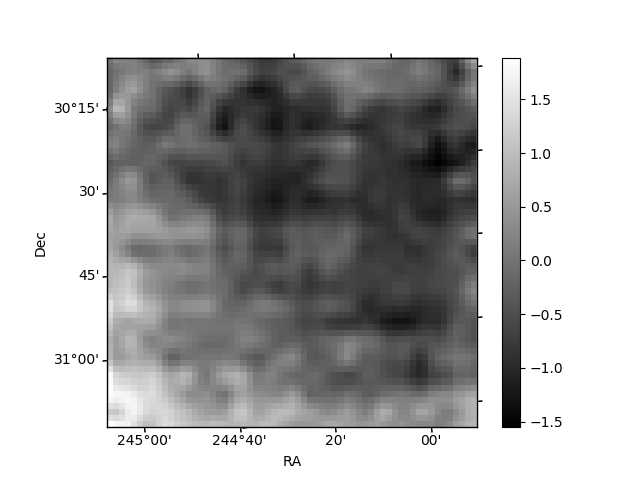
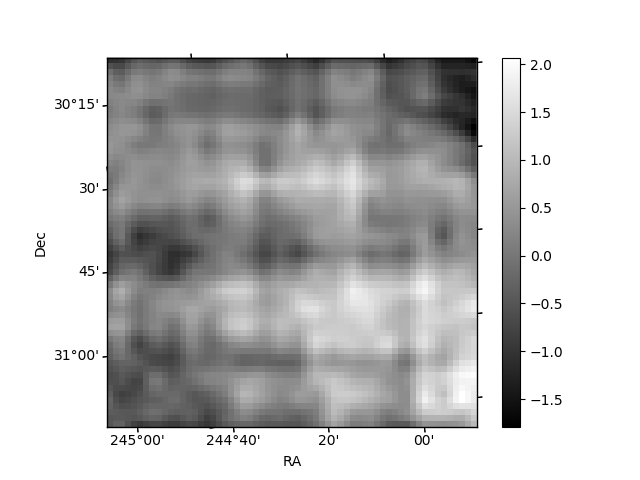
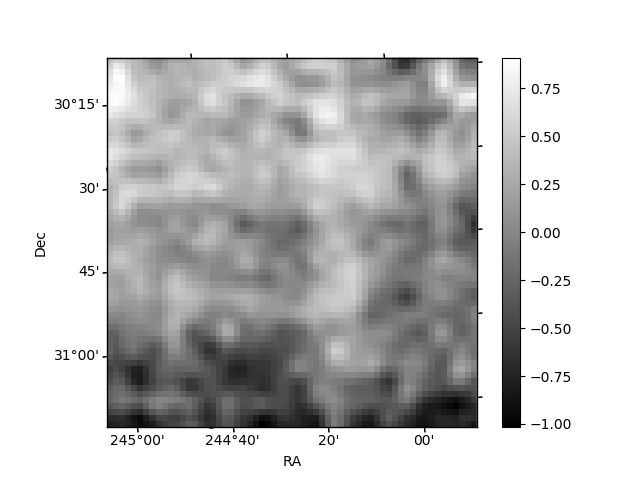
Histogram calculated using DETX and DETY for each event in the final _common_clean file
| Quadrant A | 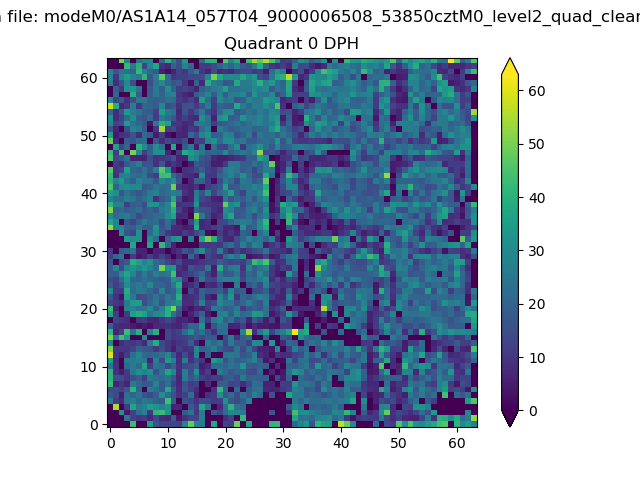 |
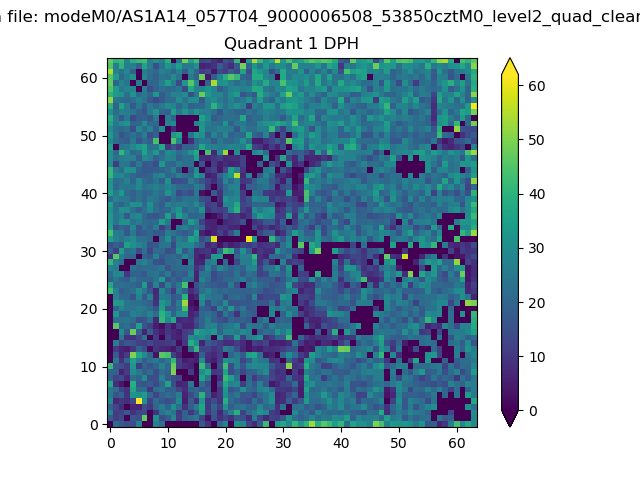 |
Quadrant B |
|---|---|---|---|
| Quadrant D | 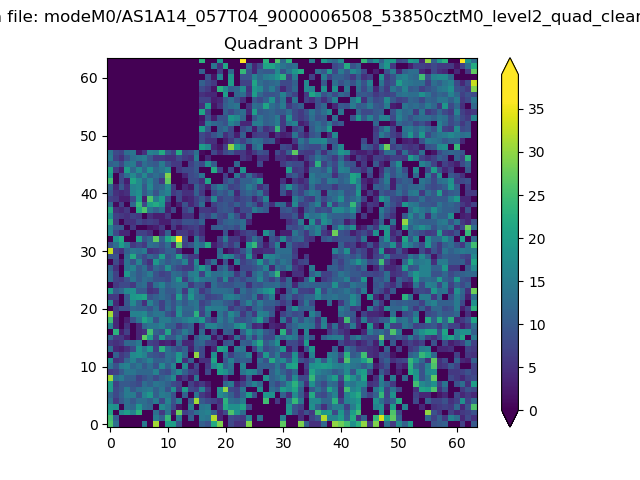 |
 |
Quadrant C |
| Plot type | Count rate plots | Images |
|---|---|---|
| Comparison with Poisson distribution Blue bars denote a histogram of data divided into 1 sec bins. Red curve is a Poisson curve with rate = median count rate of data. |
 |
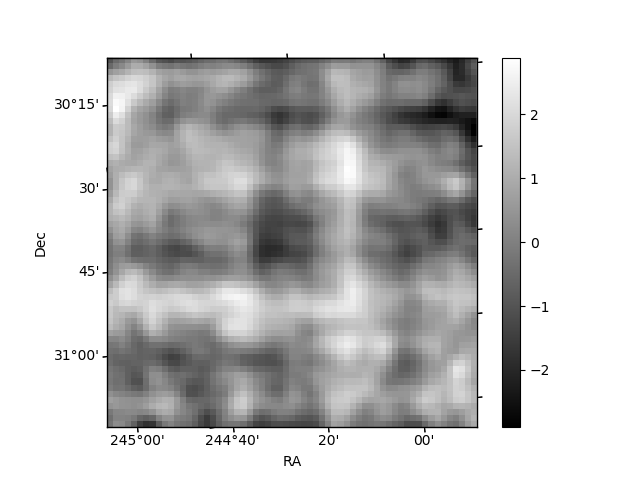 |
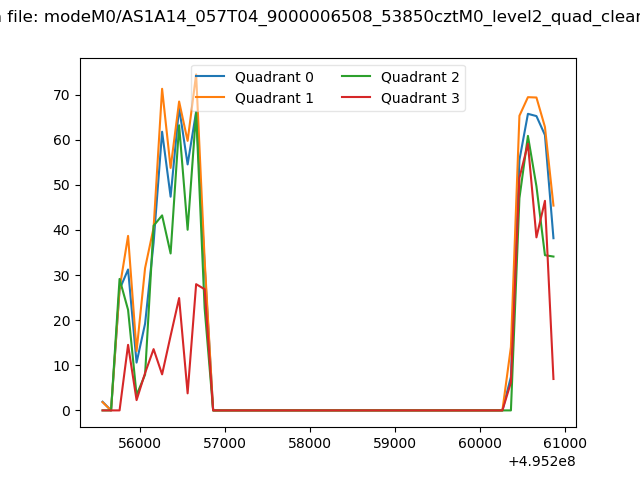
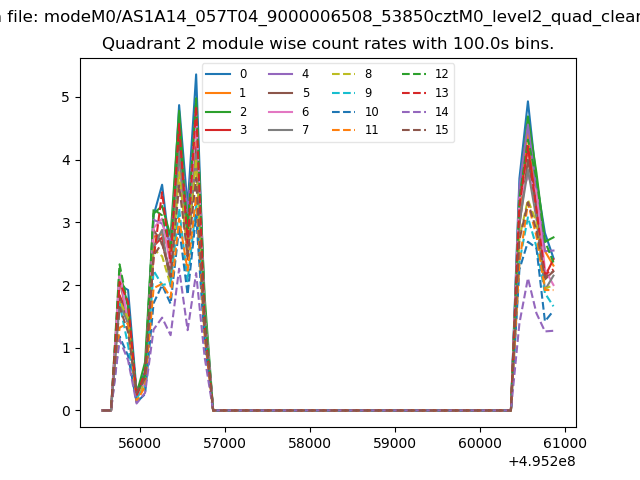
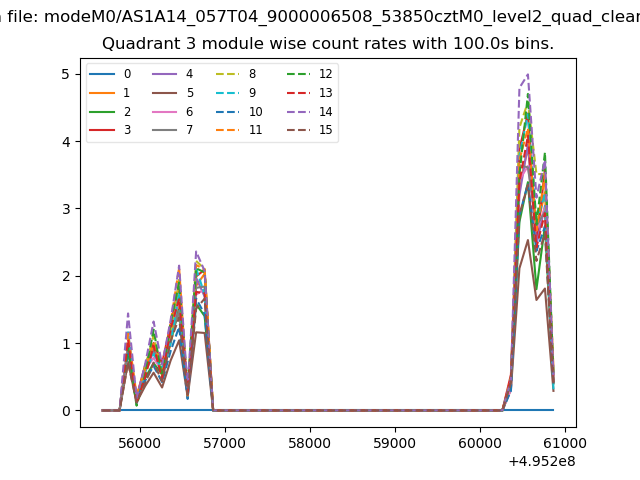
| Quadrant-wise count rates Data is divided into 100 sec bins |
 |
|
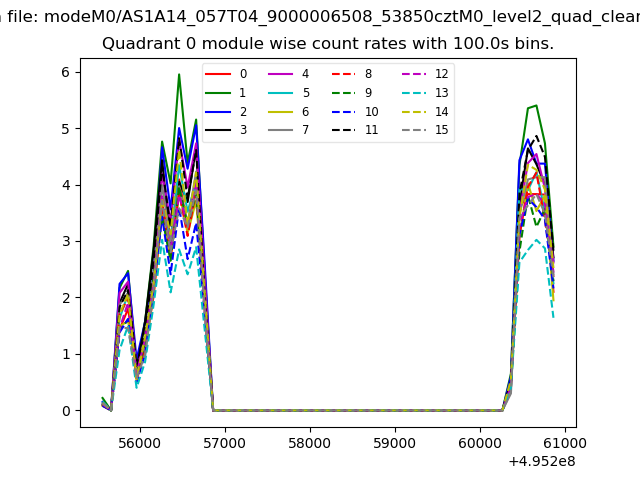
| Module-wise count rates for Quadrant A Data is divided into 100 sec bins |
 |
 |
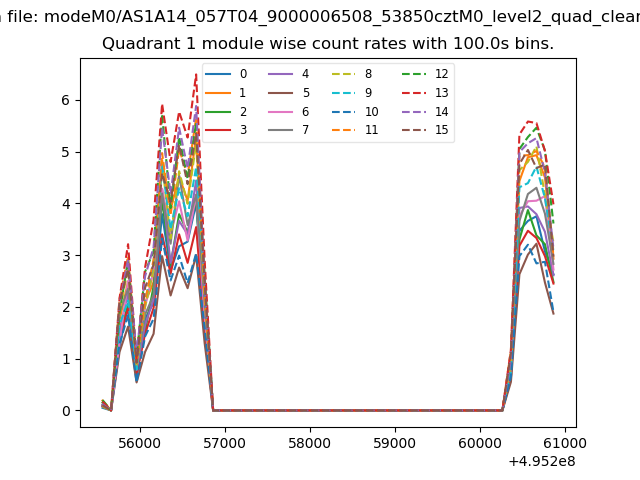
| Module-wise count rates for Quadrant B Data is divided into 100 sec bins |
 |
 |
| Module-wise count rates for Quadrant C Data is divided into 100 sec bins |
 |
 |
| Module-wise count rates for Quadrant D Data is divided into 100 sec bins |
 |
 |
| Parameter | Plot |
|---|---|
| CZT HV Monitor | 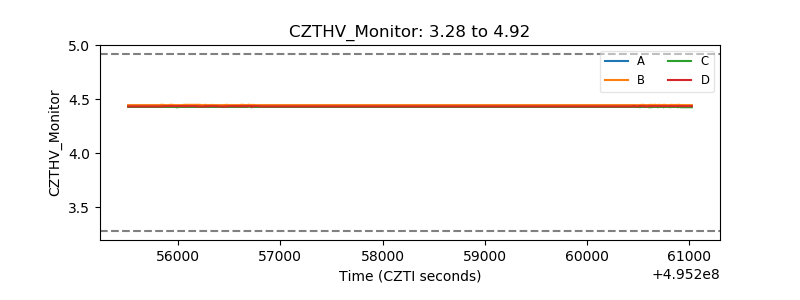 |
| D_VDD |  |
| Temperature 1 | 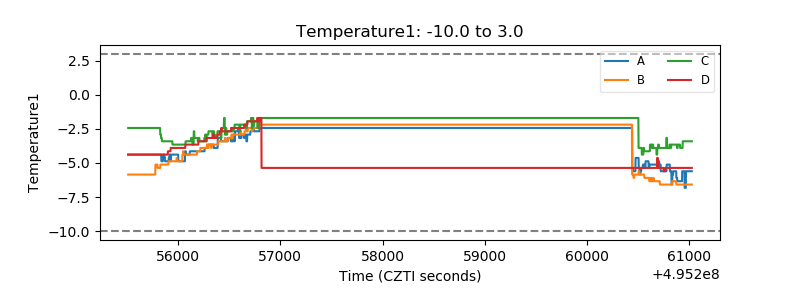 |
| Veto HV Monitor | 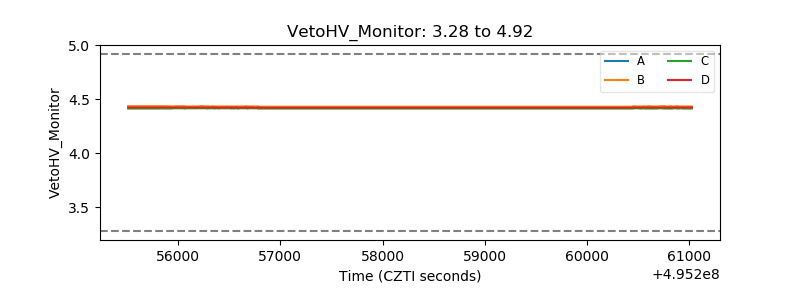 |
| Veto LLD | 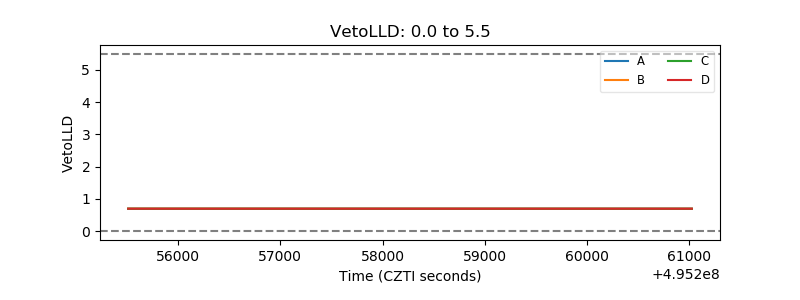 |
| Alpha Counter | 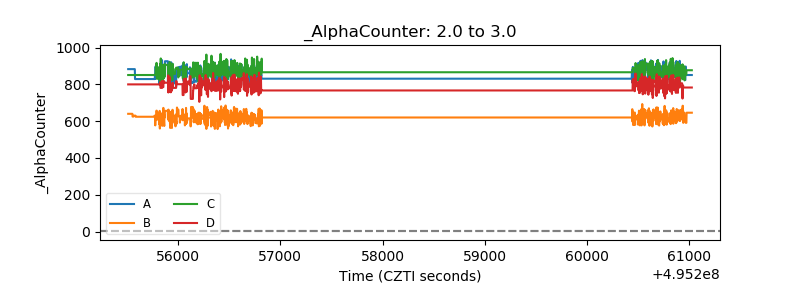 |
| _CPM_Rate | 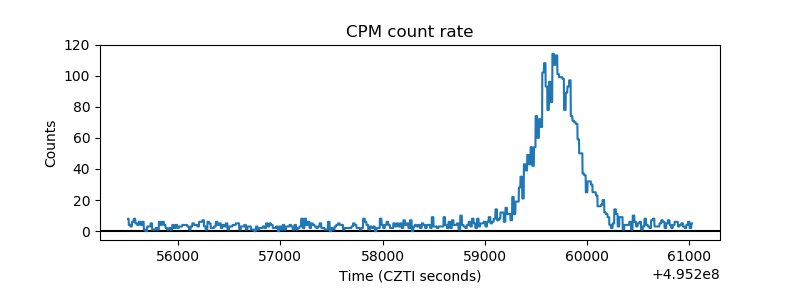 |
| CZT Counter | 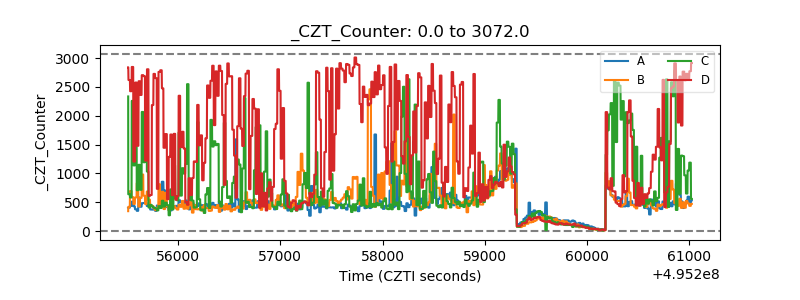 |
| +2.5 Volts monitor | 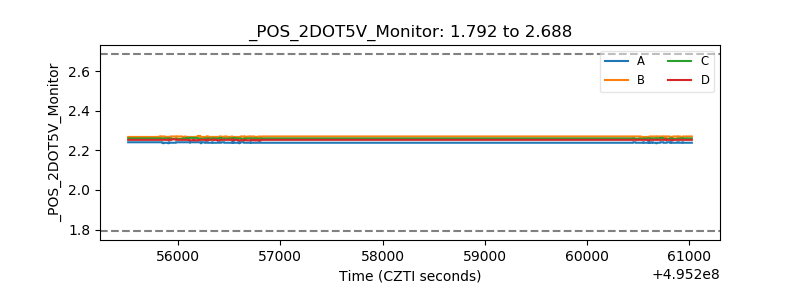 |
| +5 Volts monitor | 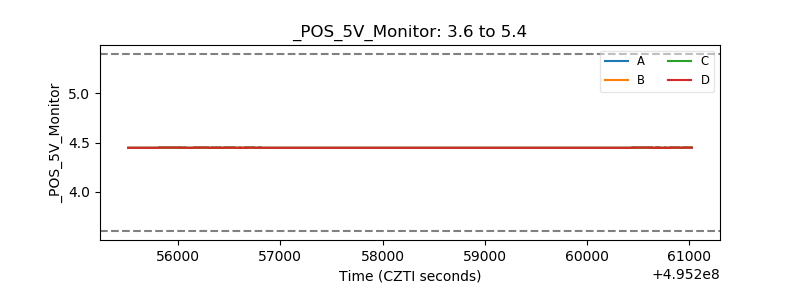 |
| _ROLL_ROT | 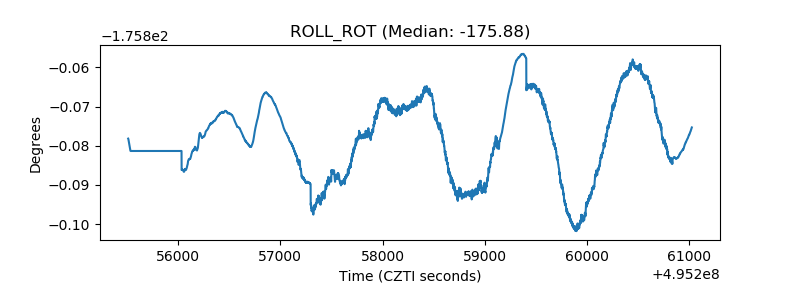 |
| _Roll_DEC | 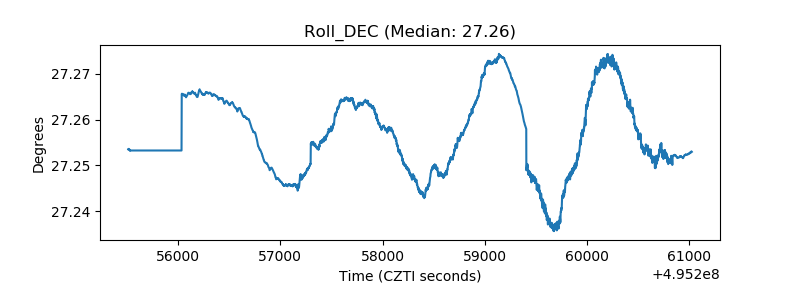 |
| _Roll_RA |  |
| Veto Counter | 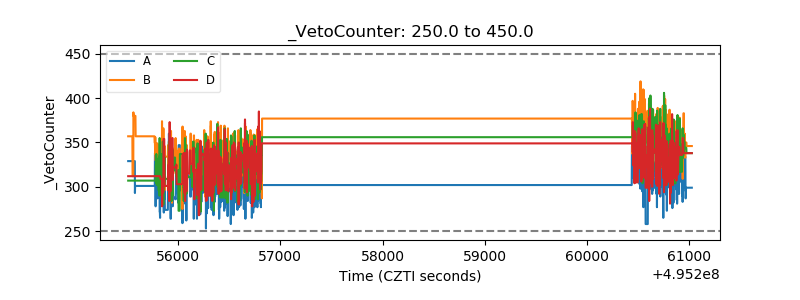 |