| Param | Original file | Final file |
|---|---|---|
| Filename | modeM0/AS1A14_057T04_9000006508_53851cztM0_level2.fits | modeM0/AS1A14_057T04_9000006508_53851cztM0_level2_quad_clean.evt |
| Size (bytes) | 571,400,640 | 64,330,560 |
| Size | 544.9 MB | 61.4 MB |
| Events in quadrant A | 2,901,665 | 497,304 |
| Events in quadrant B | 3,267,503 | 509,830 |
| Events in quadrant C | 7,489,454 | 295,636 |
| Events in quadrant D | 7,088,193 | 282,309 |
| Mode M0 | |||
|---|---|---|---|
| Quadrant | BADHDUFLAG | Total packets | Discarded packets |
| A | 0 | 12754 | 583 |
| B | 0 | 14341 | 954 |
| C | 0 | 29651 | 3938 |
| D | 0 | 28799 | 4298 |
| Mode SS | |||
|---|---|---|---|
| Quadrant | BADHDUFLAG | Total packets | Discarded packets |
| A | 0 | 102 | 8 |
| B | 0 | 102 | 6 |
| C | 0 | 102 | 6 |
| D | 0 | 102 | 4 |
| Mode M9 | |||
|---|---|---|---|
| Quadrant | BADHDUFLAG | Total packets | Discarded packets |
| A | 0 | 2 | 0 |
| B | 0 | 2 | 0 |
| C | 0 | 2 | 0 |
| D | 0 | 2 | 0 |
| Quadrant | Total seconds | Saturated seconds | Saturation percentage |
|---|---|---|---|
| A | 5378 | 201 | 3.737449% |
| B | 5325 | 374 | 7.023474% |
| C | 5072 | 1979 | 39.018139% |
| D | 5027 | 1882 | 37.437836% |
Noise dominated data is calculated using 1-second bins in cleaned event files. If a bin has >2000 counts, and if more than 50% of those come from <1% of pixels, then it is considered to be noise-dominated and hence unusable.
| Quadrant | # 1 sec bins | Bins with >0 counts | Bins with >2000 counts | High rate bins dominated by noise | Noise dominated (total time) | Noise dominated (detector-on time) | Marked lightcurve |
|---|---|---|---|---|---|---|---|
| A | 7504 | 5671 | 14 | 14 | 0.19% | 0.25% | 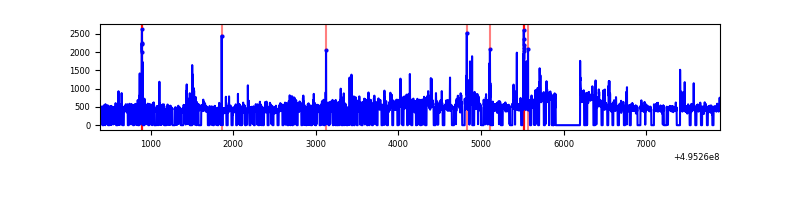 |
| B | 7504 | 5631 | 124 | 124 | 1.65% | 2.20% | 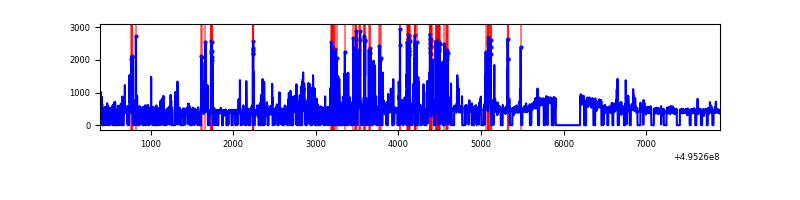 |
| C | 7504 | 5273 | 1840 | 1840 | 24.52% | 34.89% | 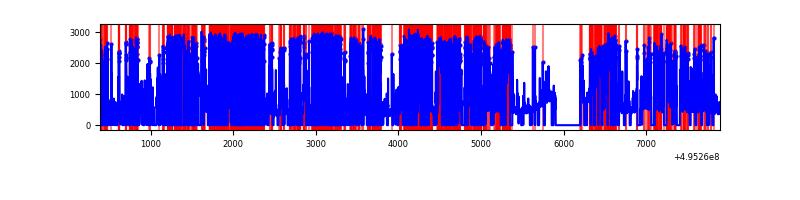 |
| D | 7505 | 5214 | 1763 | 1763 | 23.49% | 33.81% | 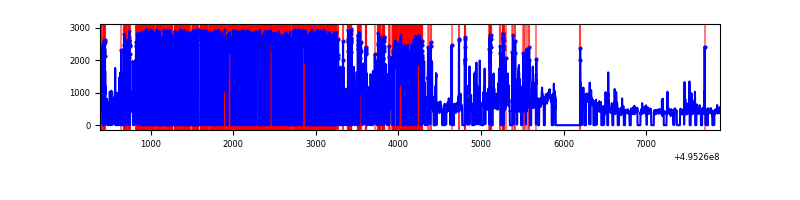 |
Top three noisy pixels from each quadrant. If the there are fewer than three noisy pixels in the level2.evt file, extra rows are filled as -1
| Pixel properties | Quadrant properties | ||||||
|---|---|---|---|---|---|---|---|
| Quadrant | DetID | PixID | Counts | Sigma | Mean | Median | Sigma |
| A | 8 | 249 | 268955 | 1811.57 | 603 | 587 | 148.1 |
| A | 0 | 8 | 64417 | 430.87 | 603 | 587 | 148.1 |
| A | 3 | 62 | 60732 | 406.0 | 603 | 587 | 148.1 |
| B | 0 | 213 | 559549 | 4424.09 | 584 | 563 | 126.4 |
| B | 5 | 185 | 132573 | 1044.79 | 584 | 563 | 126.4 |
| B | 0 | 171 | 91170 | 717.11 | 584 | 563 | 126.4 |
| C | 1 | 241 | 3671631 | 29546.6 | 452 | 447 | 124.3 |
| C | 15 | 224 | 1874228 | 15080.65 | 452 | 447 | 124.3 |
| C | 12 | 2 | 39545 | 314.67 | 452 | 447 | 124.3 |
| D | 15 | 93 | 3499487 | 27888.97 | 443 | 423 | 125.5 |
| D | 13 | 153 | 746997 | 5950.5 | 443 | 423 | 125.5 |
| D | 10 | 172 | 665195 | 5298.5 | 443 | 423 | 125.5 |
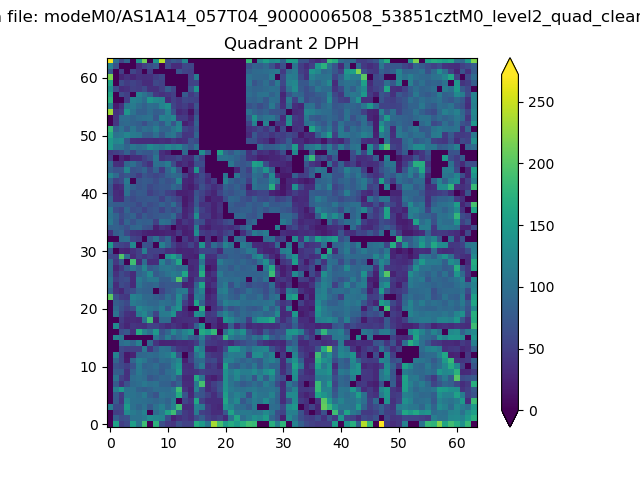
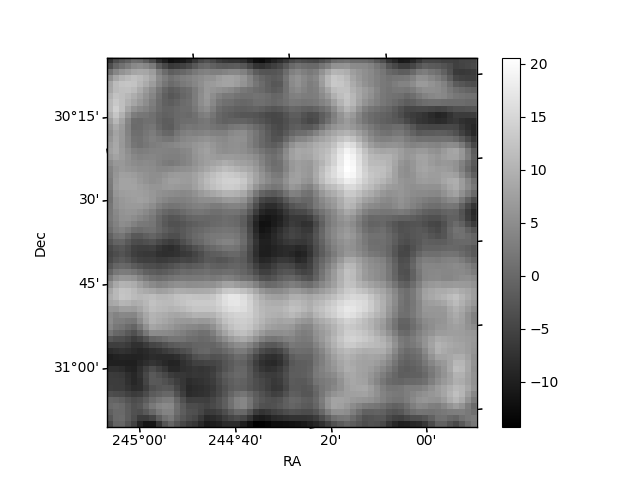
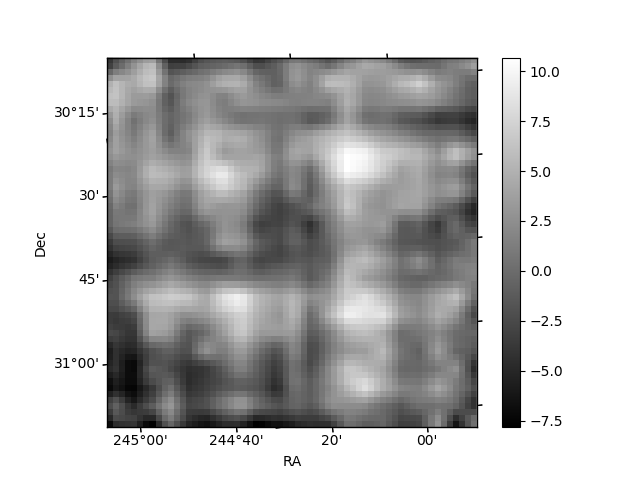
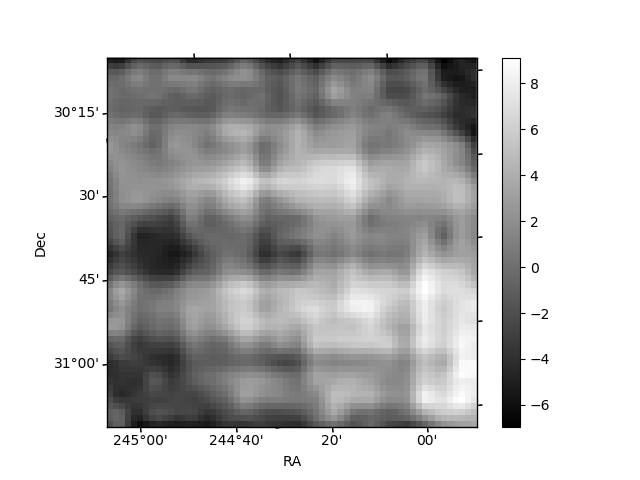
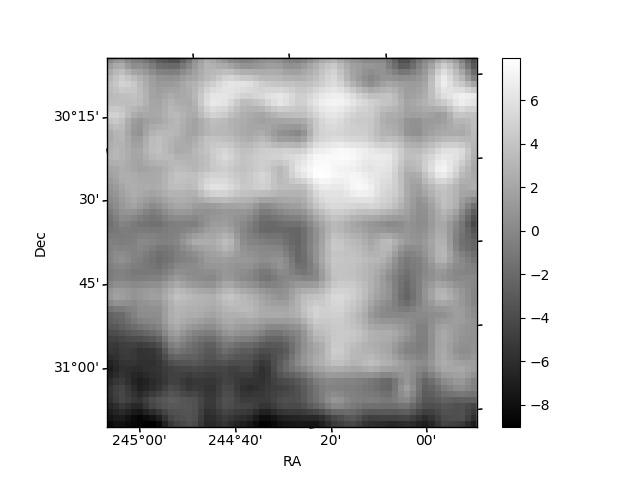
Histogram calculated using DETX and DETY for each event in the final _common_clean file
| Quadrant A | 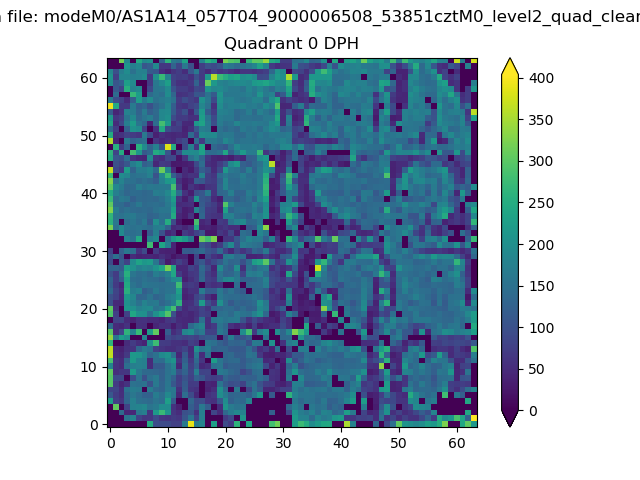 |
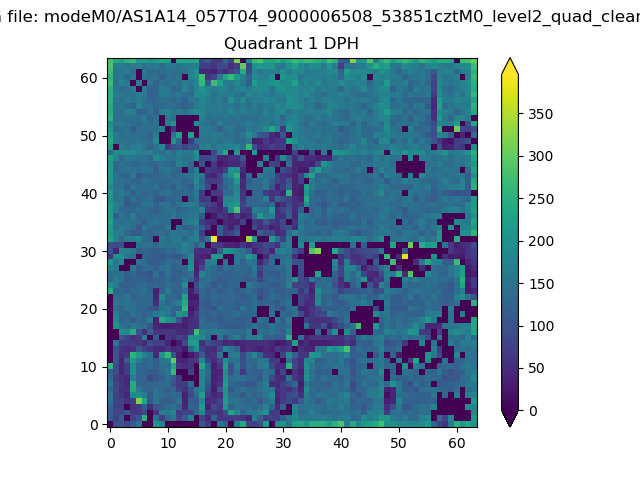 |
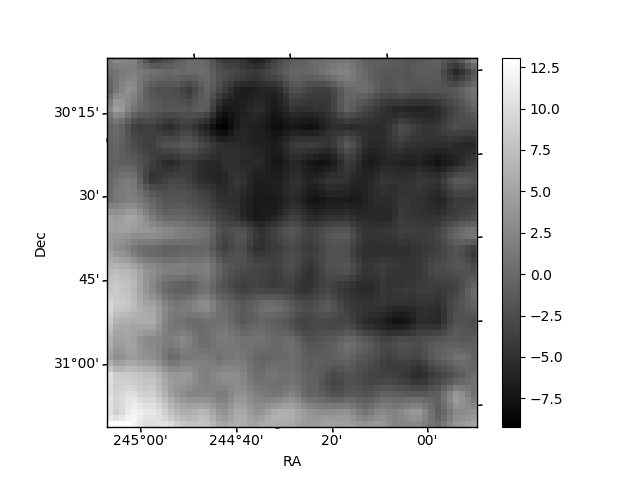
Quadrant B |
|---|---|---|---|
| Quadrant D | 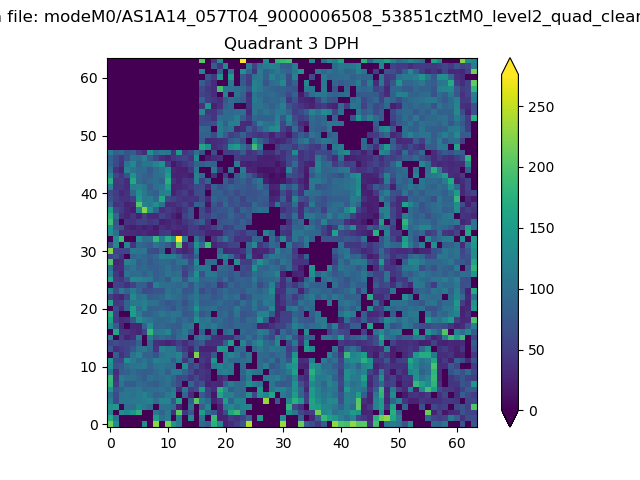 |
 |
Quadrant C |
| Plot type | Count rate plots | Images |
|---|---|---|
| Comparison with Poisson distribution Blue bars denote a histogram of data divided into 1 sec bins. Red curve is a Poisson curve with rate = median count rate of data. |
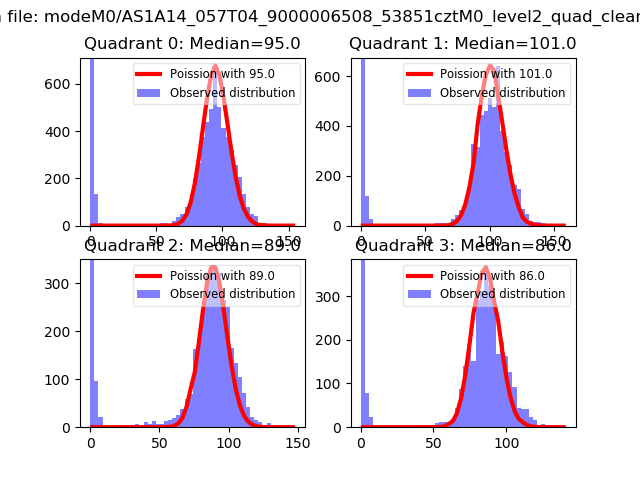 |
 |
| Quadrant-wise count rates Data is divided into 100 sec bins |
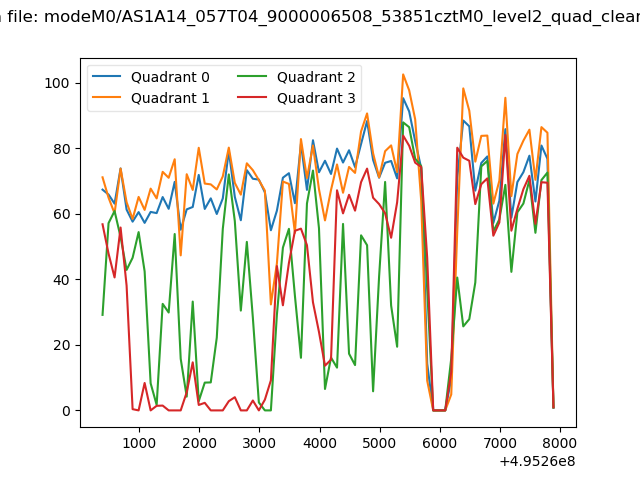 |
|
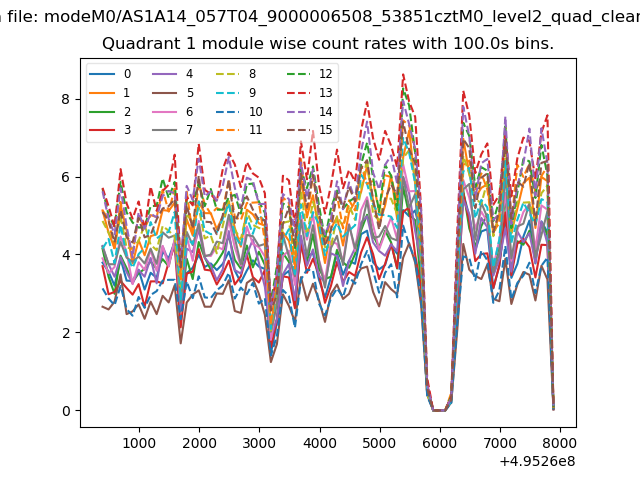
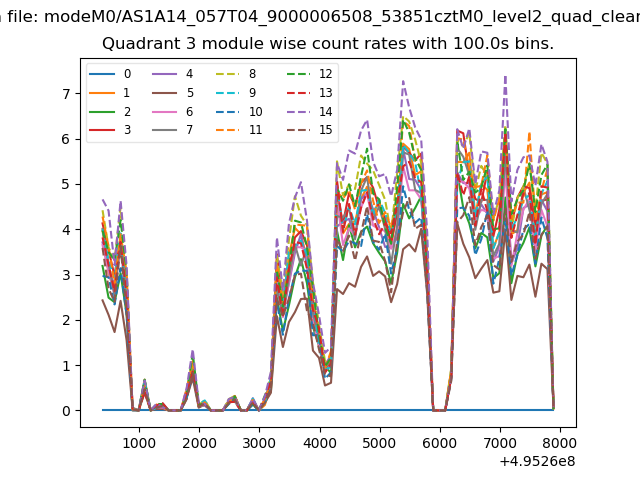
| Module-wise count rates for Quadrant A Data is divided into 100 sec bins |
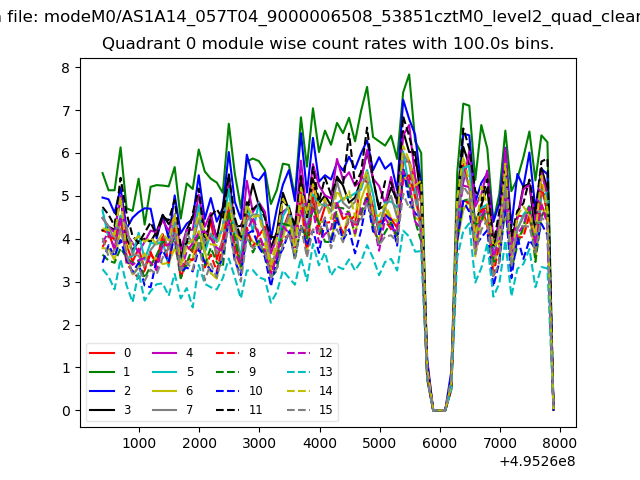 |
 |
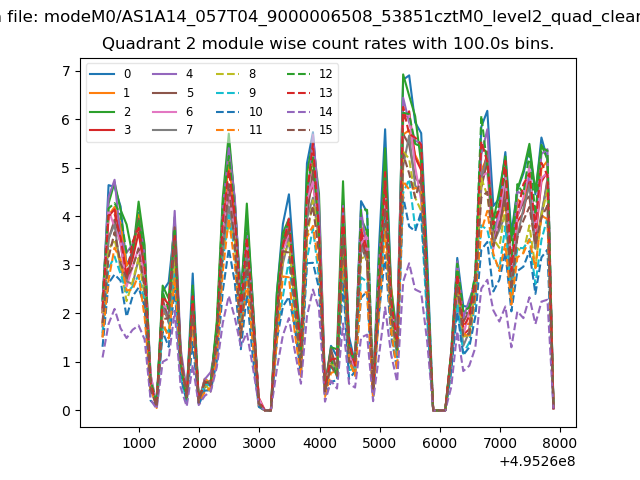
| Module-wise count rates for Quadrant B Data is divided into 100 sec bins |
 |
 |
| Module-wise count rates for Quadrant C Data is divided into 100 sec bins |
 |
 |
| Module-wise count rates for Quadrant D Data is divided into 100 sec bins |
 |
 |
| Parameter | Plot |
|---|---|
| CZT HV Monitor |  |
| D_VDD | 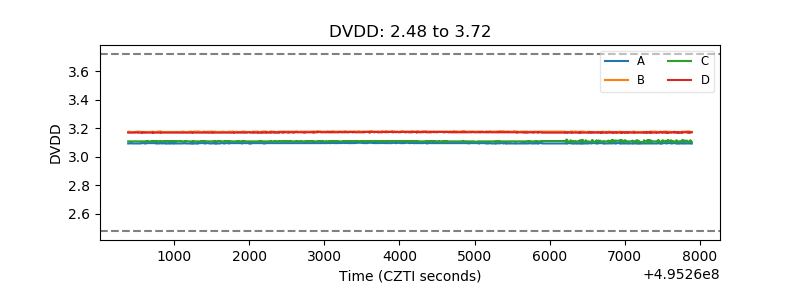 |
| Temperature 1 | 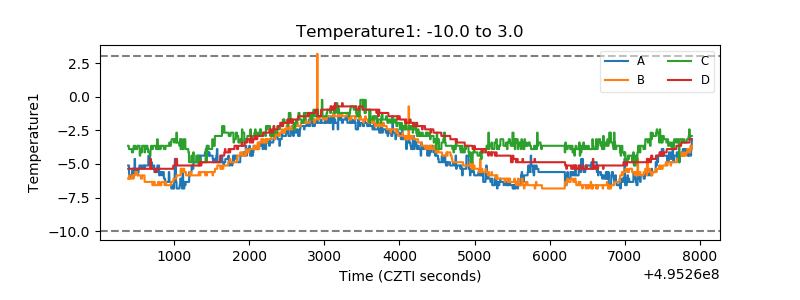 |
| Veto HV Monitor | 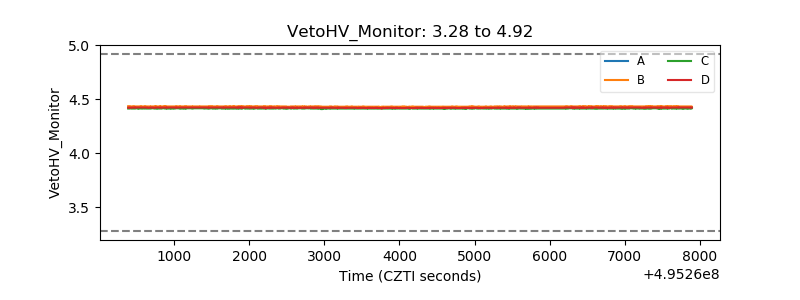 |
| Veto LLD | 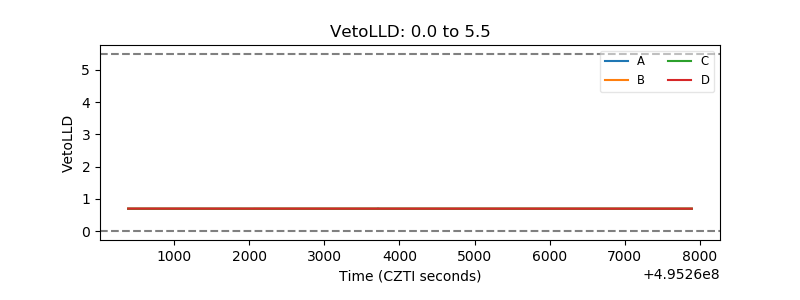 |
| Alpha Counter | 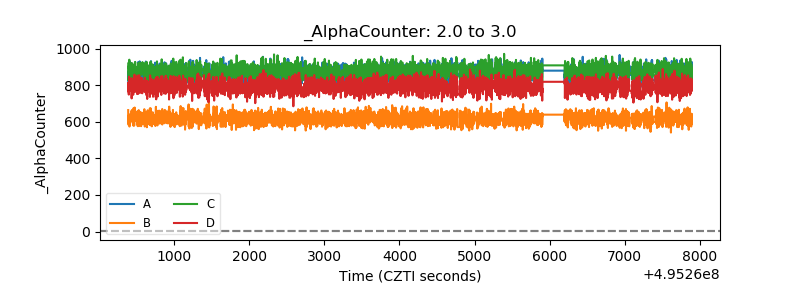 |
| _CPM_Rate | 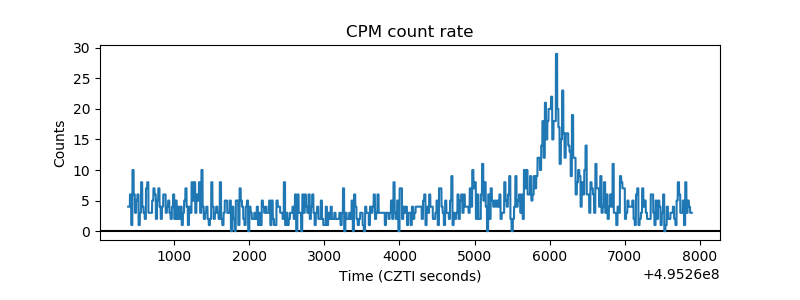 |
| CZT Counter | 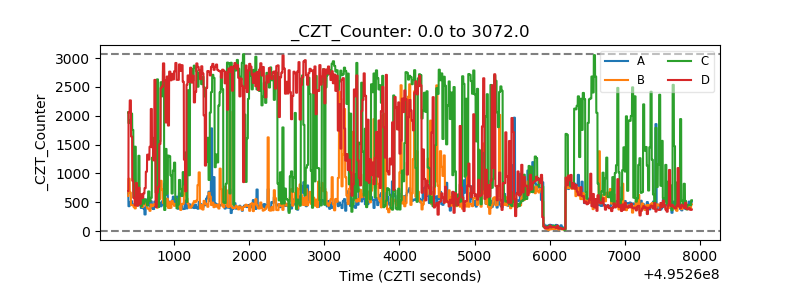 |
| +2.5 Volts monitor |  |
| +5 Volts monitor |  |
| _ROLL_ROT | 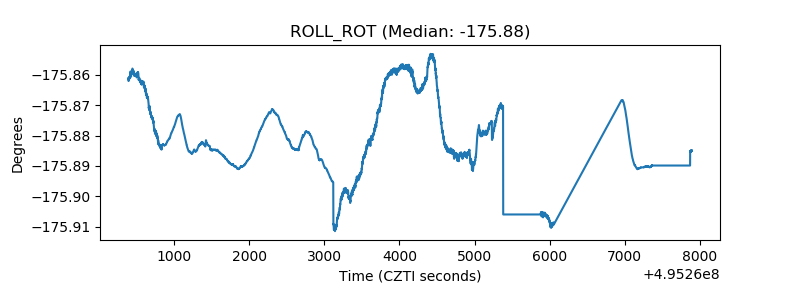 |
| _Roll_DEC | 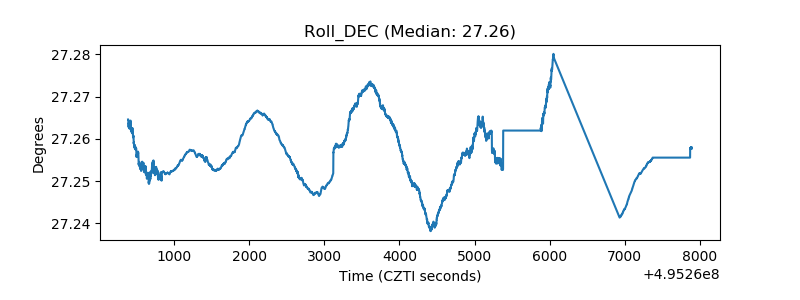 |
| _Roll_RA | 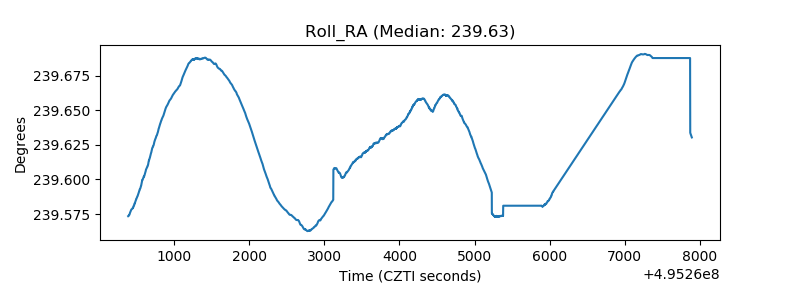 |
| Veto Counter | 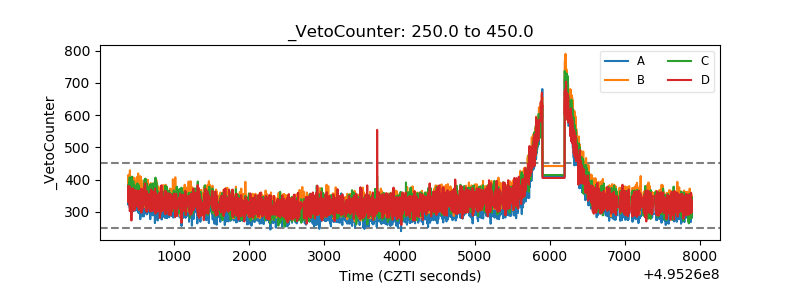 |