| Param | Original file | Final file |
|---|---|---|
| Filename | modeM0/AS1A14_057T04_9000006508_53852cztM0_level2.fits | modeM0/AS1A14_057T04_9000006508_53852cztM0_level2_quad_clean.evt |
| Size (bytes) | 1,863,452,160 | 236,004,480 |
| Size | 1.7 GB | 225.1 MB |
| Events in quadrant A | 9,817,860 | 1,722,141 |
| Events in quadrant B | 11,493,882 | 1,790,580 |
| Events in quadrant C | 22,322,805 | 1,257,356 |
| Events in quadrant D | 23,918,063 | 1,101,341 |
| Mode M0 | |||
|---|---|---|---|
| Quadrant | BADHDUFLAG | Total packets | Discarded packets |
| A | 0 | 41710 | 10 |
| B | 0 | 46831 | 35 |
| C | 0 | 79202 | 78 |
| D | 0 | 83738 | 33 |
| Mode SS | |||
|---|---|---|---|
| Quadrant | BADHDUFLAG | Total packets | Discarded packets |
| A | 0 | 376 | 0 |
| B | 0 | 376 | 0 |
| C | 0 | 376 | 0 |
| D | 0 | 376 | 0 |
| Mode M9 | |||
|---|---|---|---|
| Quadrant | BADHDUFLAG | Total packets | Discarded packets |
| A | 0 | 11 | 0 |
| B | 0 | 11 | 0 |
| C | 0 | 11 | 0 |
| D | 0 | 11 | 0 |
| Quadrant | Total seconds | Saturated seconds | Saturation percentage |
|---|---|---|---|
| A | 18475 | 453 | 2.451962% |
| B | 18470 | 977 | 5.289659% |
| C | 18463 | 4733 | 25.635054% |
| D | 18471 | 5631 | 30.485626% |
Noise dominated data is calculated using 1-second bins in cleaned event files. If a bin has >2000 counts, and if more than 50% of those come from <1% of pixels, then it is considered to be noise-dominated and hence unusable.
| Quadrant | # 1 sec bins | Bins with >0 counts | Bins with >2000 counts | High rate bins dominated by noise | Noise dominated (total time) | Noise dominated (detector-on time) | Marked lightcurve |
|---|---|---|---|---|---|---|---|
| A | 19643 | 18477 | 61 | 61 | 0.31% | 0.33% | 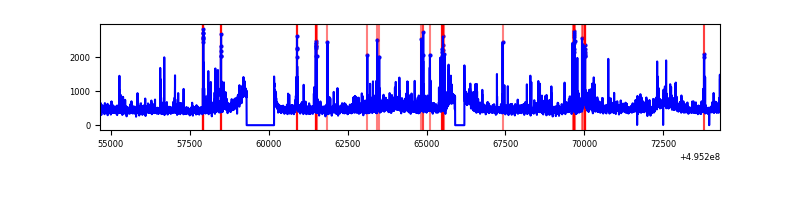 |
| B | 19644 | 18479 | 429 | 429 | 2.18% | 2.32% | 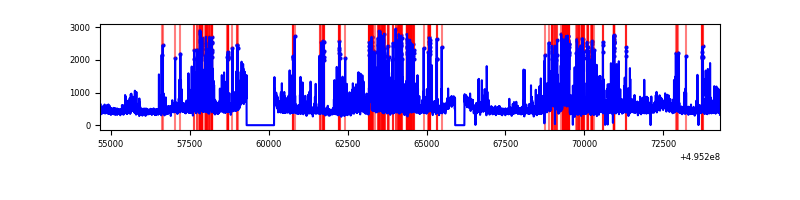 |
| C | 19644 | 18477 | 4368 | 4368 | 22.24% | 23.64% | 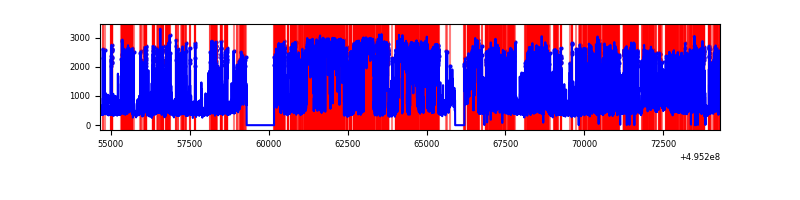 |
| D | 19644 | 18479 | 5569 | 5569 | 28.35% | 30.14% | 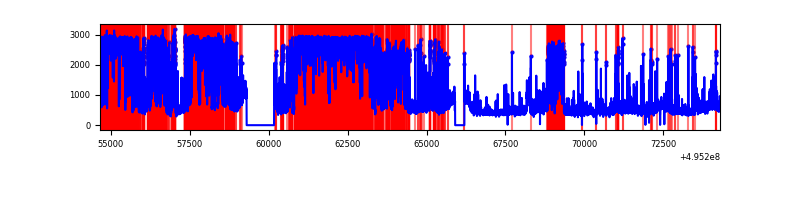 |
Top three noisy pixels from each quadrant. If the there are fewer than three noisy pixels in the level2.evt file, extra rows are filled as -1
| Pixel properties | Quadrant properties | ||||||
|---|---|---|---|---|---|---|---|
| Quadrant | DetID | PixID | Counts | Sigma | Mean | Median | Sigma |
| A | 8 | 249 | 975858 | 1939.84 | 2050 | 1993 | 502.0 |
| A | 0 | 8 | 202794 | 399.97 | 2050 | 1993 | 502.0 |
| A | 4 | 249 | 162674 | 320.06 | 2050 | 1993 | 502.0 |
| B | 0 | 213 | 1662281 | 3880.35 | 2002 | 1928 | 427.9 |
| B | 5 | 185 | 588703 | 1371.33 | 2002 | 1928 | 427.9 |
| B | 8 | 234 | 456648 | 1062.71 | 2002 | 1928 | 427.9 |
| C | 15 | 224 | 8725668 | 18159.46 | 1759 | 1741 | 480.4 |
| C | 1 | 241 | 6002856 | 12491.74 | 1759 | 1741 | 480.4 |
| C | 12 | 2 | 196567 | 405.54 | 1759 | 1741 | 480.4 |
| D | 15 | 93 | 11788199 | 24787.77 | 1677 | 1599 | 475.5 |
| D | 10 | 172 | 2686061 | 5645.55 | 1677 | 1599 | 475.5 |
| D | 13 | 153 | 1318006 | 2768.46 | 1677 | 1599 | 475.5 |
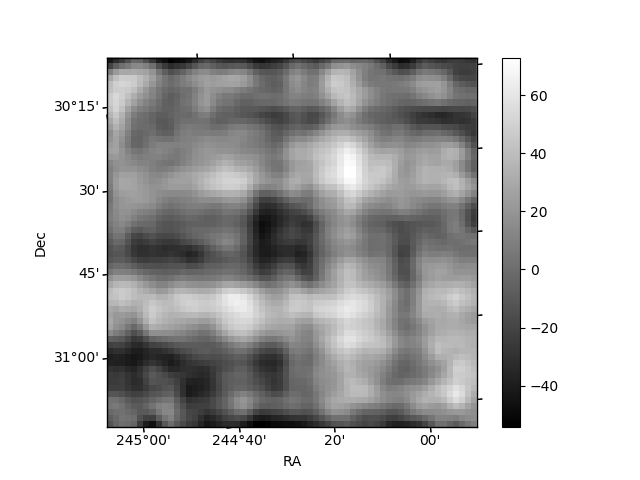
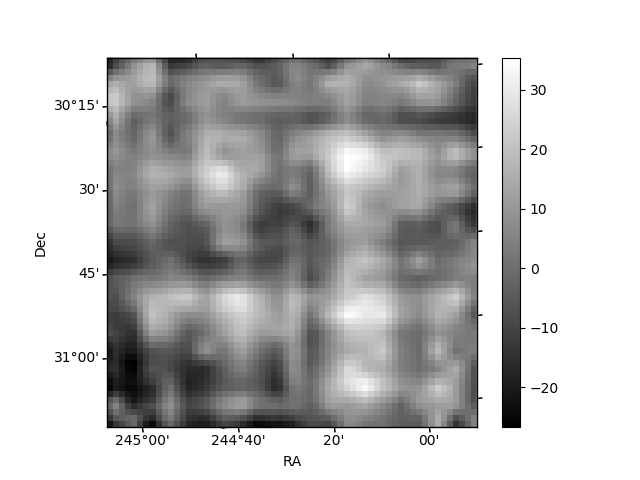
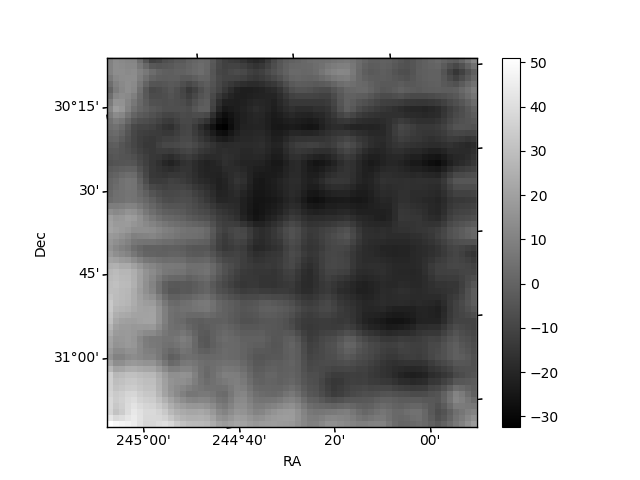
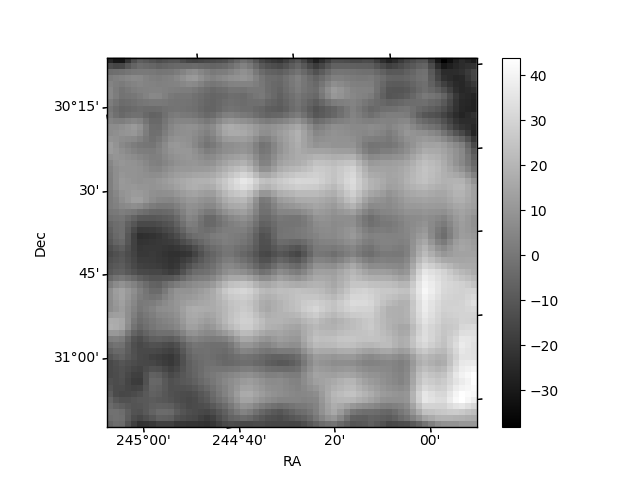
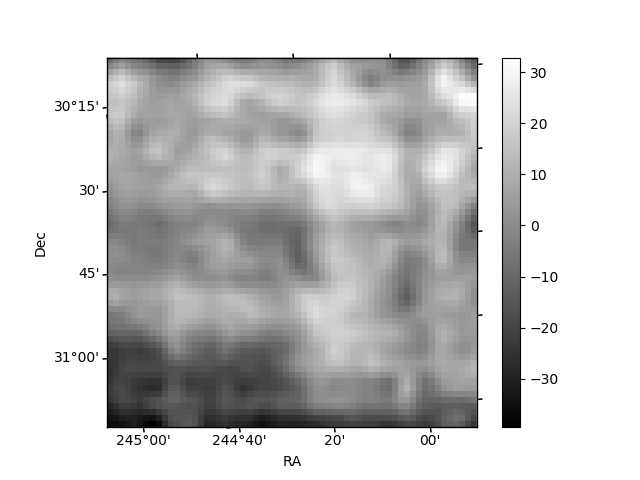
Histogram calculated using DETX and DETY for each event in the final _common_clean file
| Quadrant A | 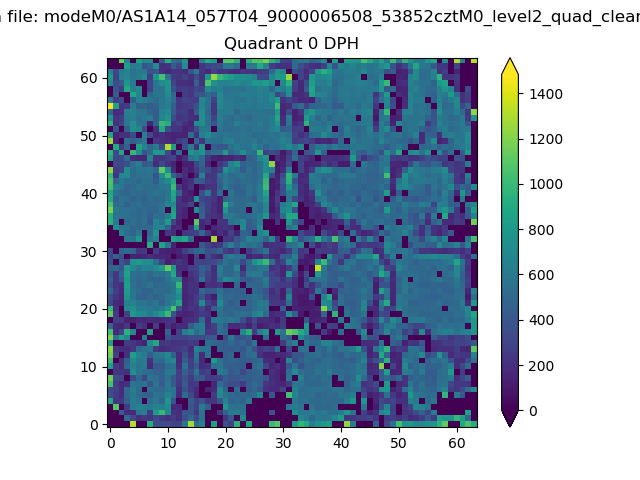 |
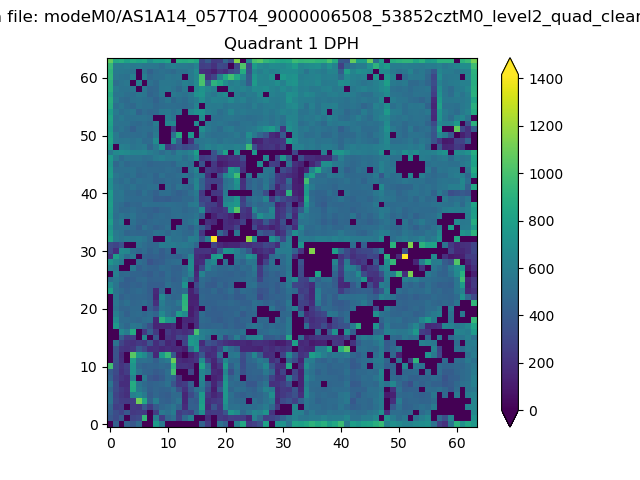 |
Quadrant B |
|---|---|---|---|
| Quadrant D | 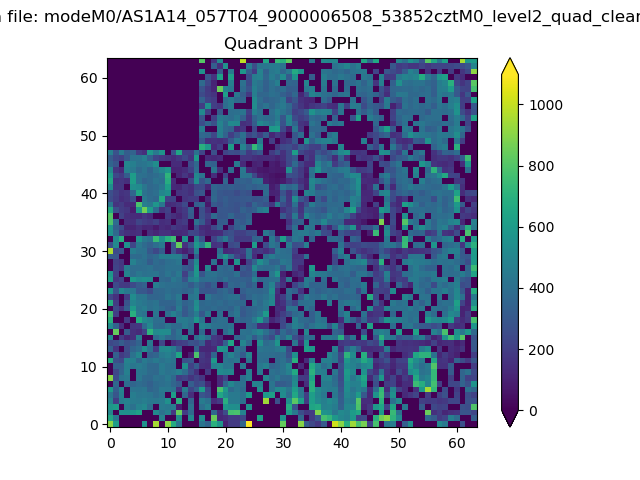 |
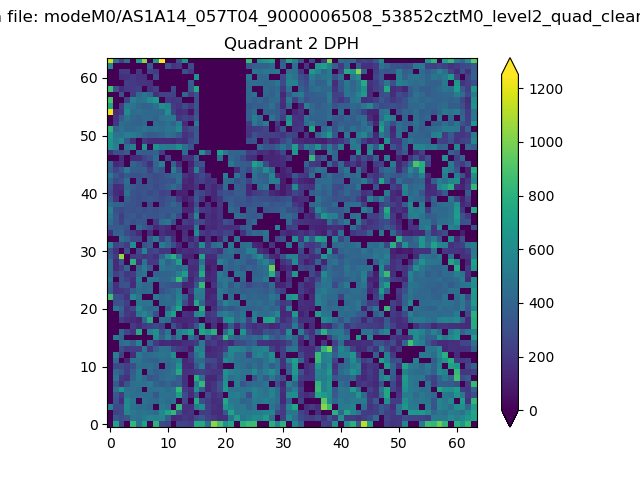 |
Quadrant C |
| Plot type | Count rate plots | Images |
|---|---|---|
| Comparison with Poisson distribution Blue bars denote a histogram of data divided into 1 sec bins. Red curve is a Poisson curve with rate = median count rate of data. |
 |
 |
| Quadrant-wise count rates Data is divided into 100 sec bins |
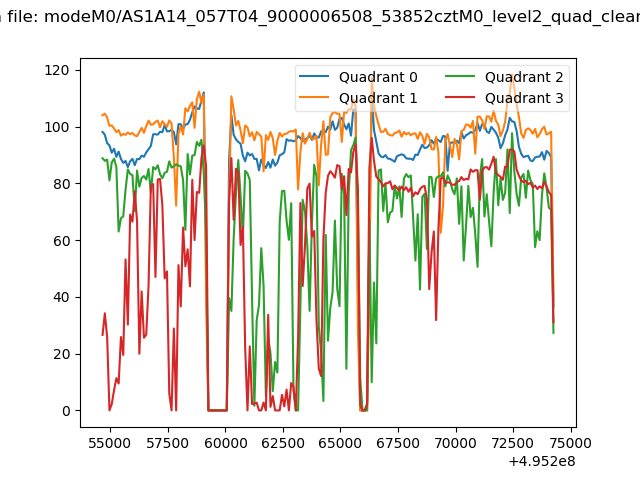 |
|
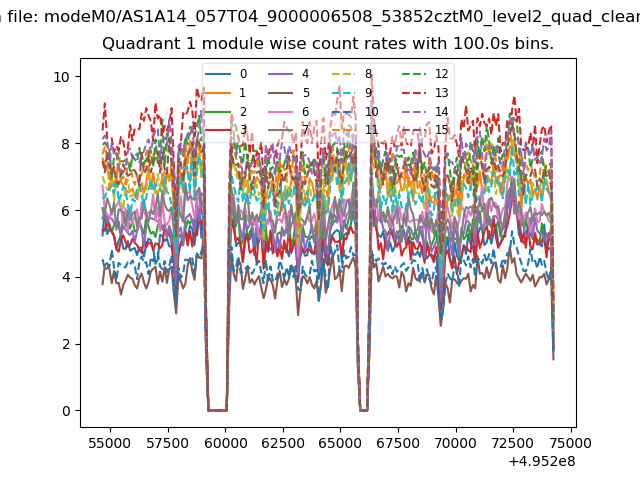
| Module-wise count rates for Quadrant A Data is divided into 100 sec bins |
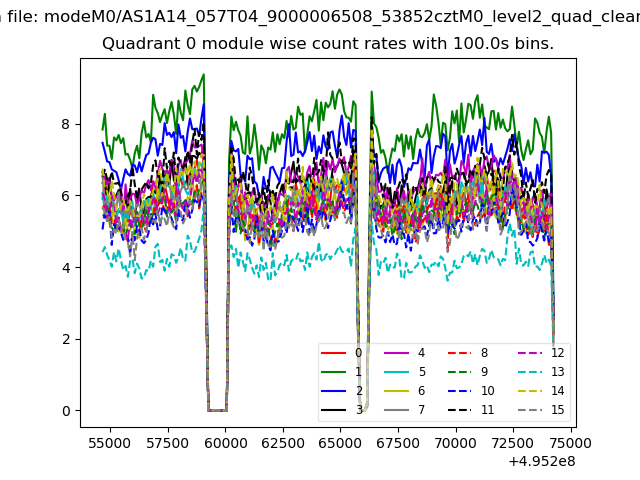 |
 |
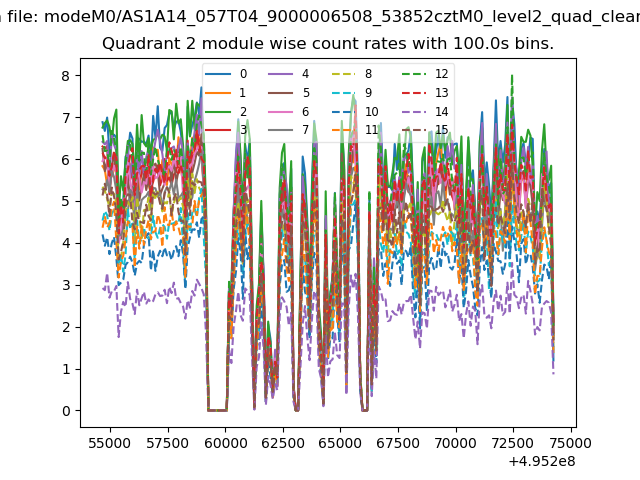
| Module-wise count rates for Quadrant B Data is divided into 100 sec bins |
 |
 |
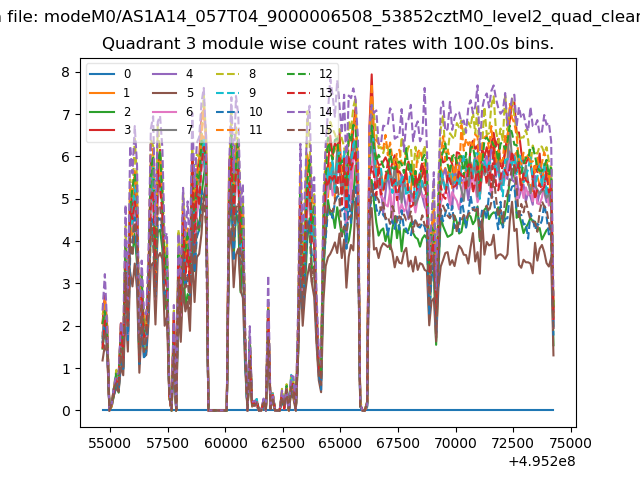
| Module-wise count rates for Quadrant C Data is divided into 100 sec bins |
 |
 |
| Module-wise count rates for Quadrant D Data is divided into 100 sec bins |
 |
 |
| Parameter | Plot |
|---|---|
| CZT HV Monitor | 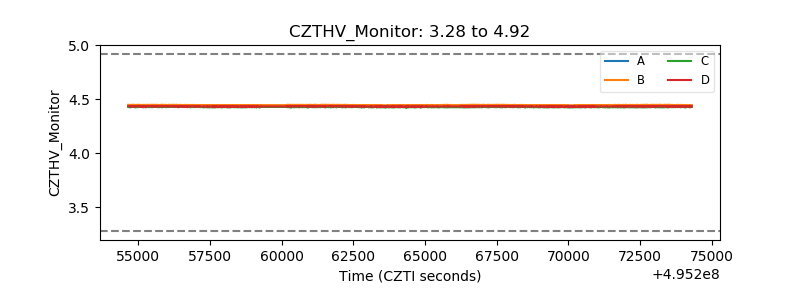 |
| D_VDD | 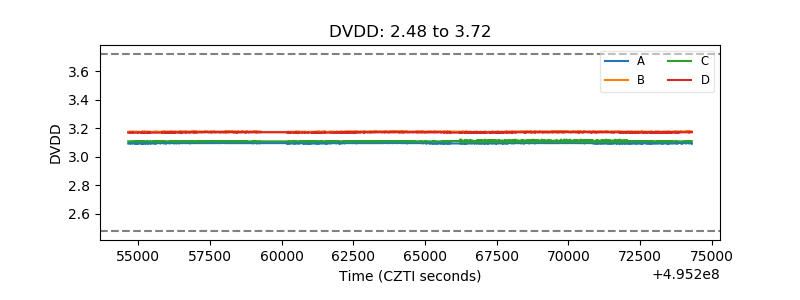 |
| Temperature 1 | 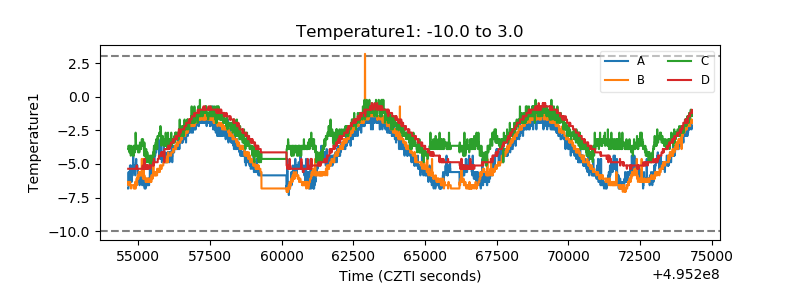 |
| Veto HV Monitor | 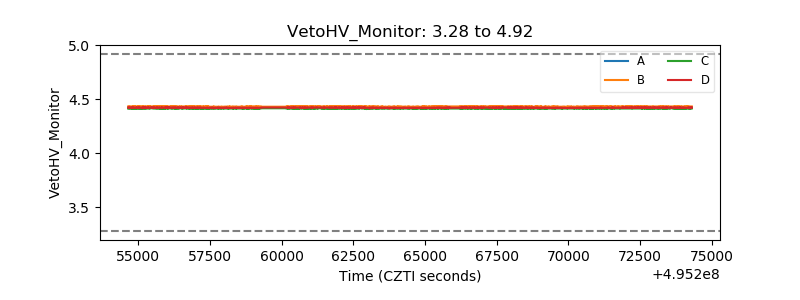 |
| Veto LLD | 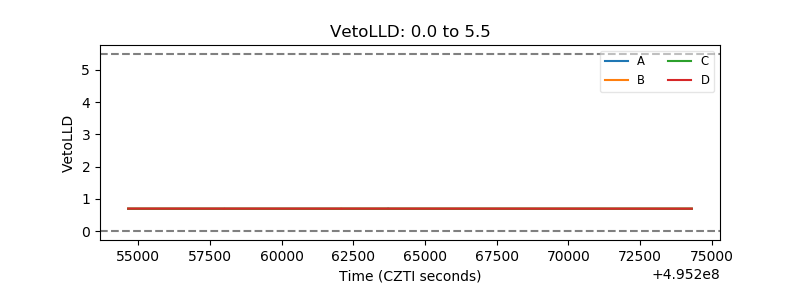 |
| Alpha Counter | 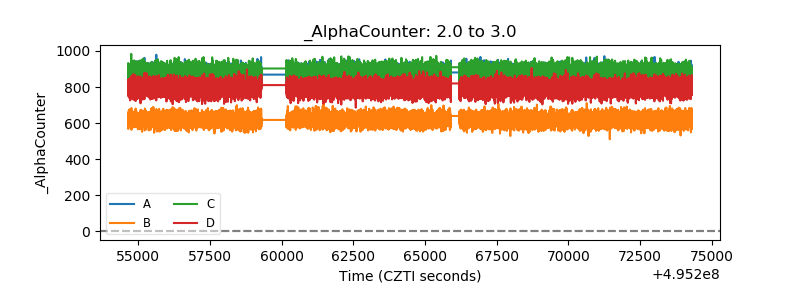 |
| _CPM_Rate | 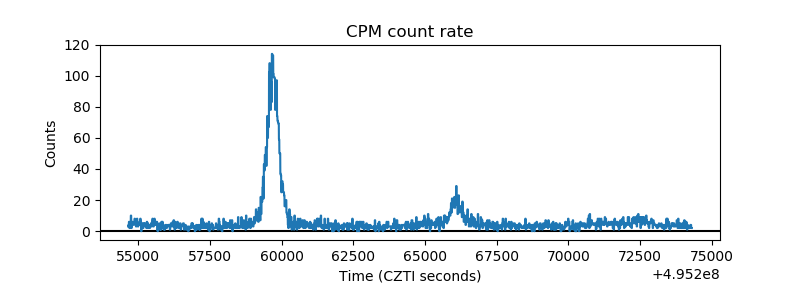 |
| CZT Counter | 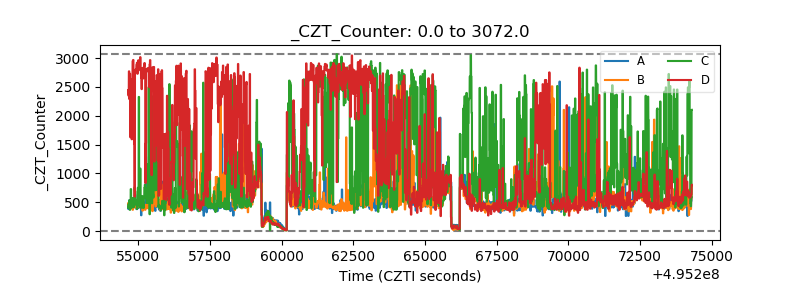 |
| +2.5 Volts monitor |  |
| +5 Volts monitor |  |
| _ROLL_ROT | 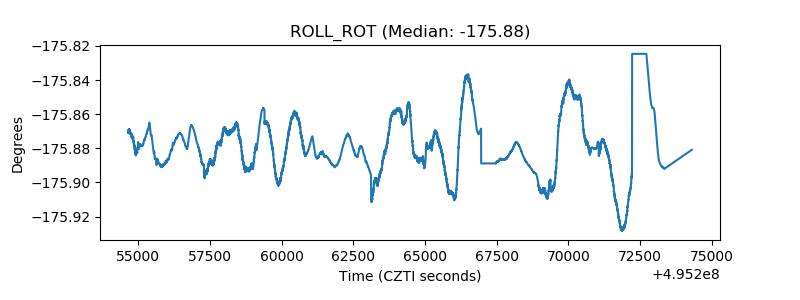 |
| _Roll_DEC | 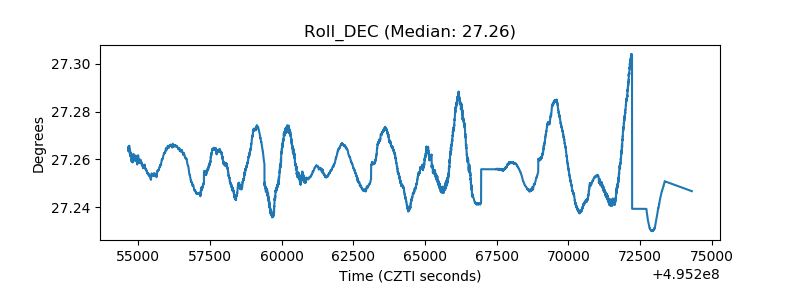 |
| _Roll_RA | 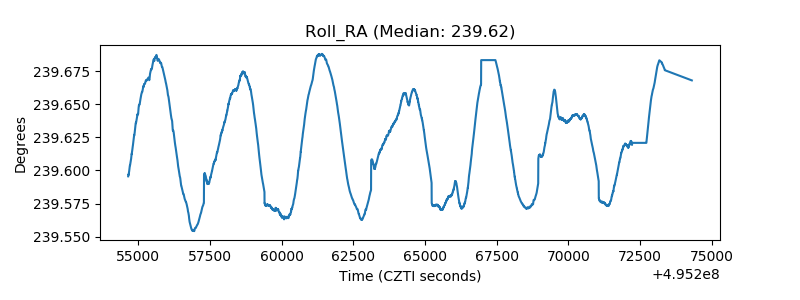 |
| Veto Counter | 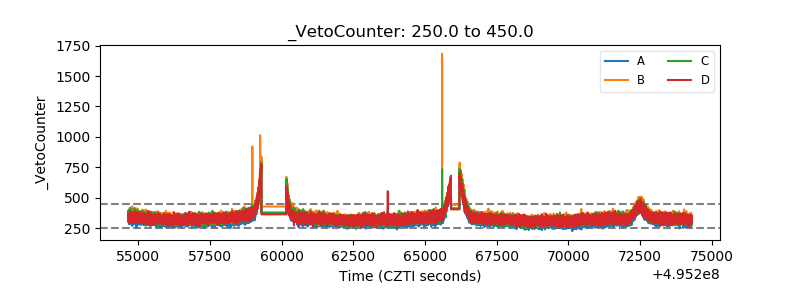 |