| Param | Original file | Final file |
|---|---|---|
| Filename | modeM0/AS1A14_057T04_9000006508_53853cztM0_level2.fits | modeM0/AS1A14_057T04_9000006508_53853cztM0_level2_quad_clean.evt |
| Size (bytes) | 389,980,800 | 70,297,920 |
| Size | 371.9 MB | 67.0 MB |
| Events in quadrant A | 2,872,778 | 468,738 |
| Events in quadrant B | 3,303,404 | 484,643 |
| Events in quadrant C | 4,136,252 | 398,555 |
| Events in quadrant D | 3,724,677 | 413,969 |
| Mode M0 | |||
|---|---|---|---|
| Quadrant | BADHDUFLAG | Total packets | Discarded packets |
| A | 0 | 14149 | 2247 |
| B | 0 | 15719 | 2424 |
| C | 0 | 20251 | 4580 |
| D | 0 | 17114 | 2578 |
| Mode SS | |||
|---|---|---|---|
| Quadrant | BADHDUFLAG | Total packets | Discarded packets |
| A | 0 | 131 | 8 |
| B | 0 | 137 | 13 |
| C | 0 | 136 | 14 |
| D | 0 | 136 | 24 |
| Quadrant | Total seconds | Saturated seconds | Saturation percentage |
|---|---|---|---|
| A | 5167 | 58 | 1.122508% |
| B | 5171 | 240 | 4.641269% |
| C | 4951 | 412 | 8.321551% |
| D | 5134 | 116 | 2.259447% |
Noise dominated data is calculated using 1-second bins in cleaned event files. If a bin has >2000 counts, and if more than 50% of those come from <1% of pixels, then it is considered to be noise-dominated and hence unusable.
| Quadrant | # 1 sec bins | Bins with >0 counts | Bins with >2000 counts | High rate bins dominated by noise | Noise dominated (total time) | Noise dominated (detector-on time) | Marked lightcurve |
|---|---|---|---|---|---|---|---|
| A | 8097 | 5691 | 57 | 57 | 0.70% | 1.00% | 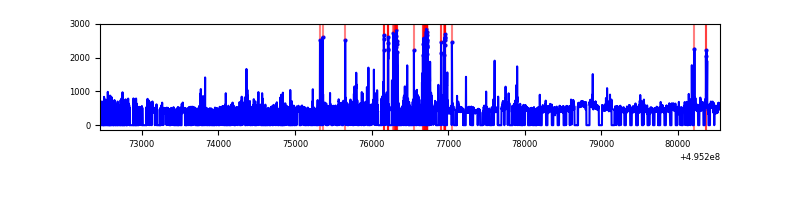 |
| B | 8097 | 5717 | 180 | 180 | 2.22% | 3.15% | 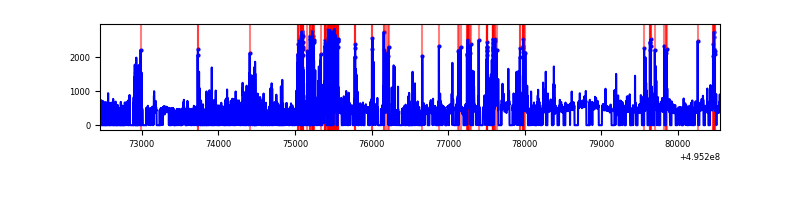 |
| C | 8097 | 5489 | 351 | 351 | 4.33% | 6.39% | 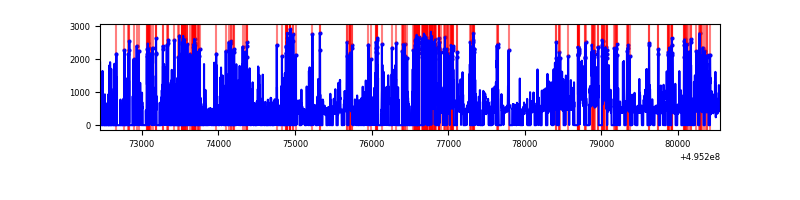 |
| D | 8099 | 5711 | 142 | 142 | 1.75% | 2.49% | 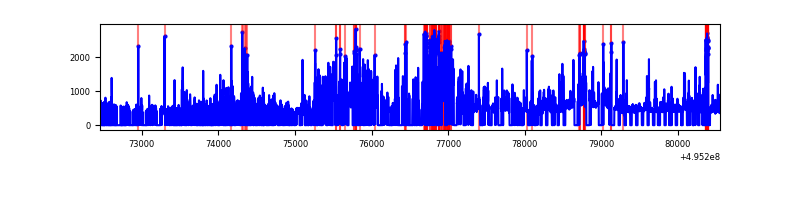 |
Top three noisy pixels from each quadrant. If the there are fewer than three noisy pixels in the level2.evt file, extra rows are filled as -1
| Pixel properties | Quadrant properties | ||||||
|---|---|---|---|---|---|---|---|
| Quadrant | DetID | PixID | Counts | Sigma | Mean | Median | Sigma |
| A | 8 | 249 | 284512 | 2022.57 | 562 | 547 | 140.4 |
| A | 0 | 8 | 191364 | 1359.11 | 562 | 547 | 140.4 |
| A | 15 | 174 | 58579 | 413.34 | 562 | 547 | 140.4 |
| B | 0 | 213 | 610942 | 5053.66 | 551 | 532 | 120.8 |
| B | 5 | 185 | 304386 | 2515.65 | 551 | 532 | 120.8 |
| B | 0 | 171 | 55125 | 451.98 | 551 | 532 | 120.8 |
| C | 15 | 224 | 1771555 | 12393.08 | 509 | 504 | 142.9 |
| C | 15 | 158 | 72435 | 503.34 | 509 | 504 | 142.9 |
| C | 13 | 3 | 57213 | 396.83 | 509 | 504 | 142.9 |
| D | 10 | 172 | 931047 | 6053.14 | 539 | 517 | 153.7 |
| D | 14 | 52 | 189302 | 1228.06 | 539 | 517 | 153.7 |
| D | 3 | 12 | 124714 | 807.91 | 539 | 517 | 153.7 |
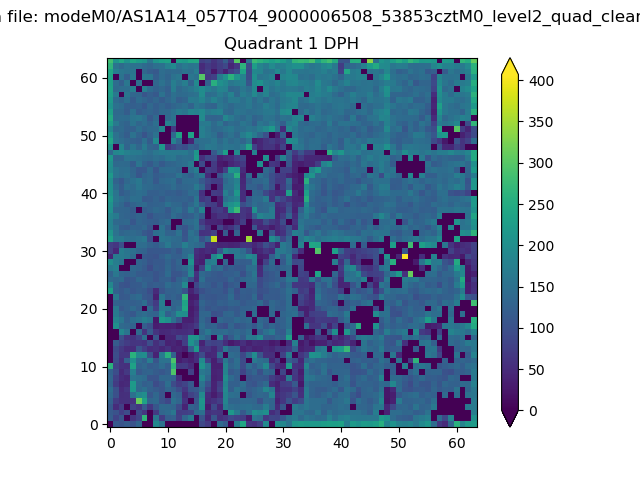
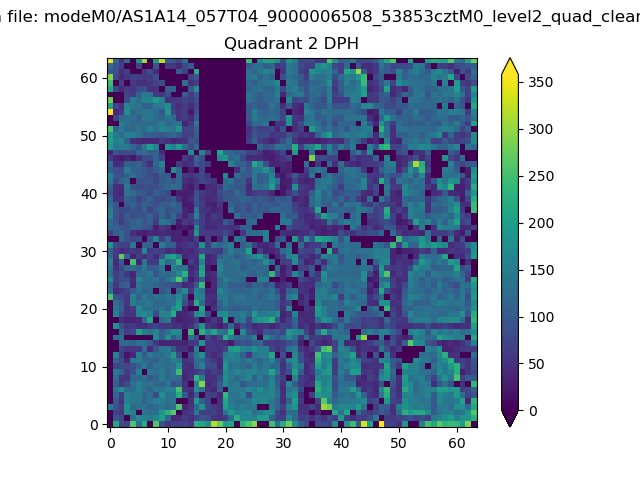
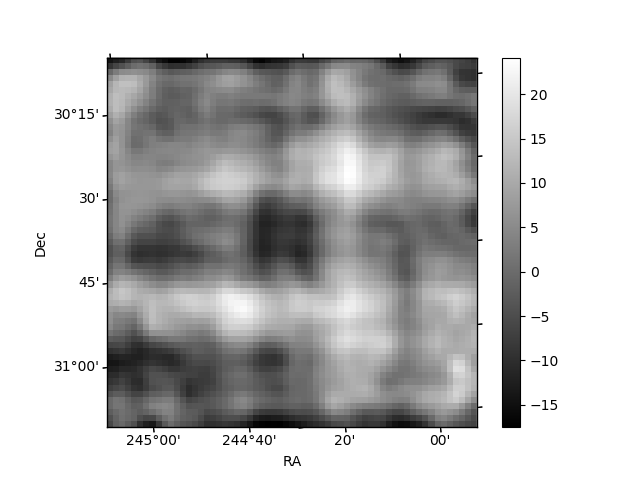
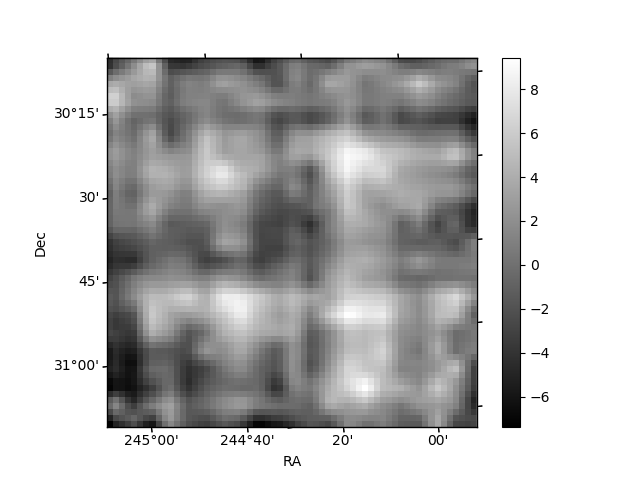
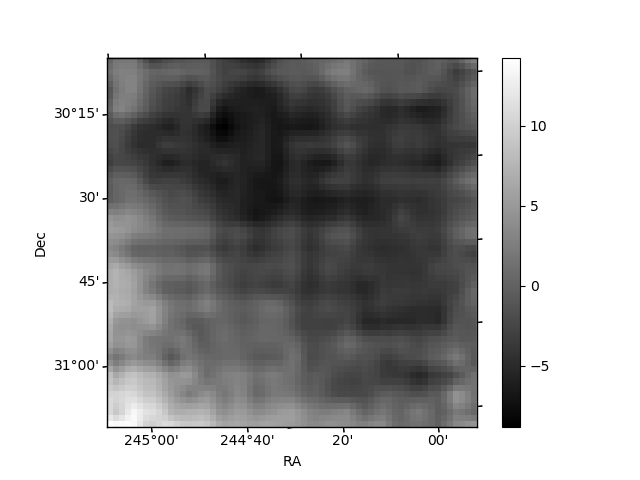
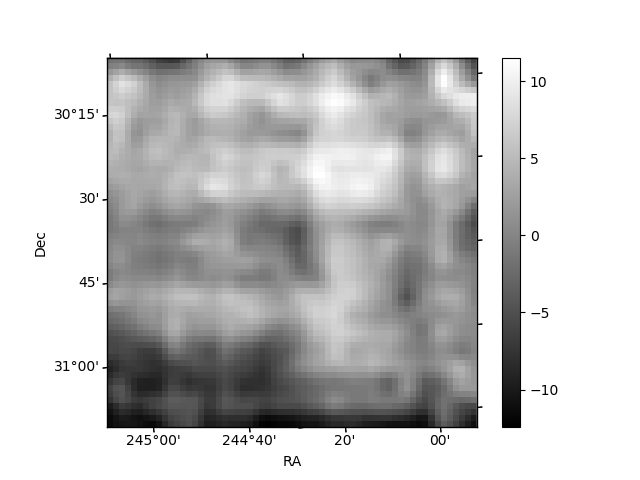
Histogram calculated using DETX and DETY for each event in the final _common_clean file
| Quadrant A |  |
 |
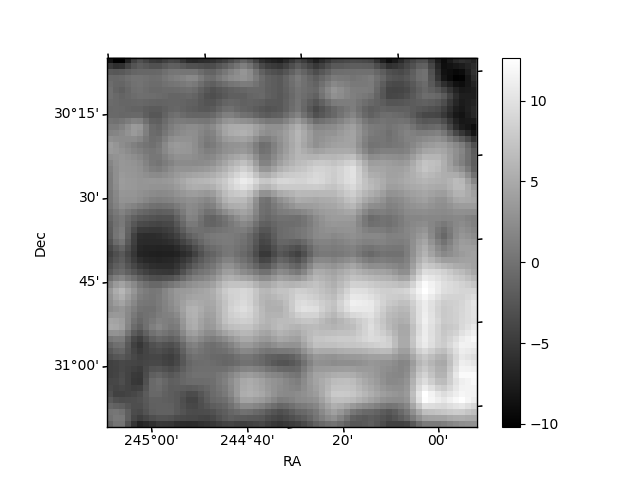
Quadrant B |
|---|---|---|---|
| Quadrant D | 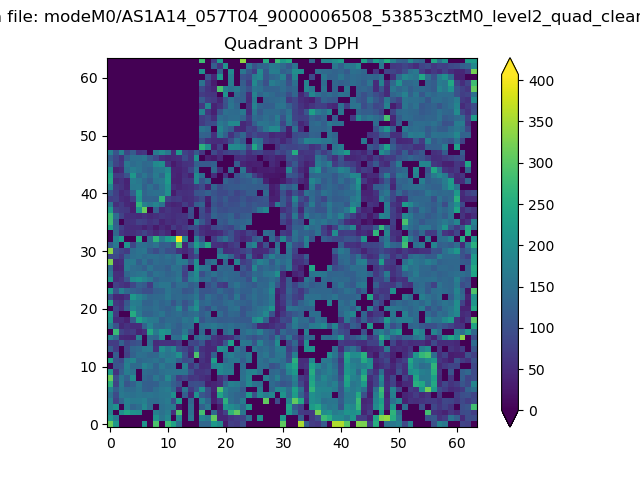 |
 |
Quadrant C |
| Plot type | Count rate plots | Images |
|---|---|---|
| Comparison with Poisson distribution Blue bars denote a histogram of data divided into 1 sec bins. Red curve is a Poisson curve with rate = median count rate of data. |
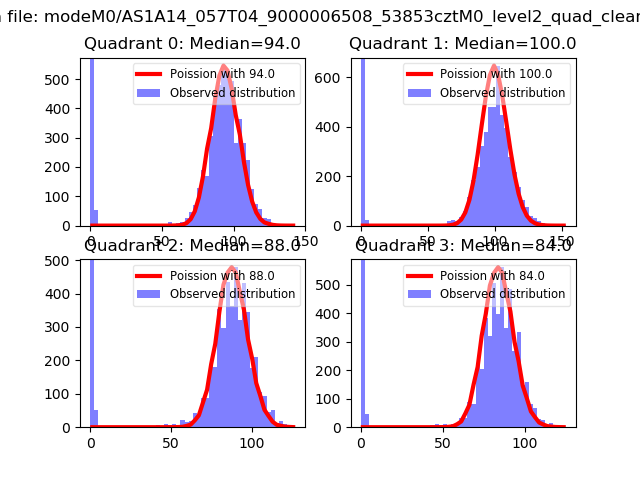 |
 |
| Quadrant-wise count rates Data is divided into 100 sec bins |
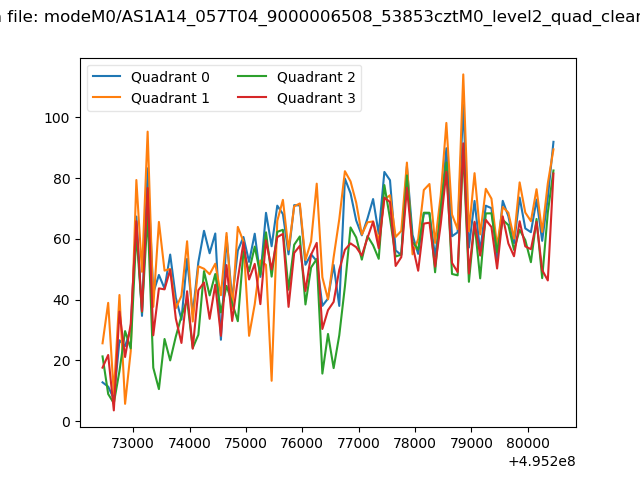 |
|
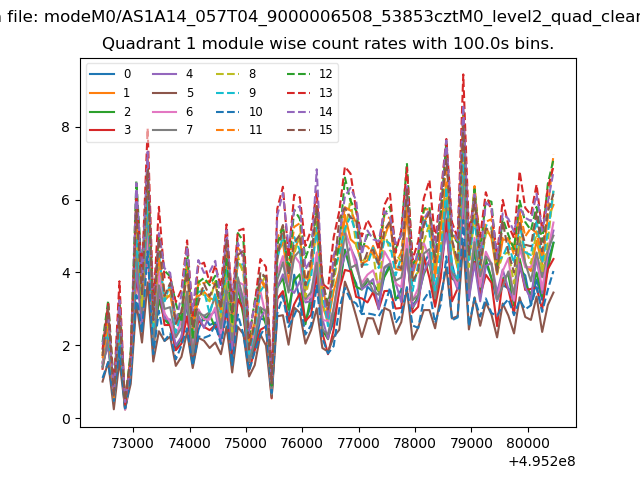
| Module-wise count rates for Quadrant A Data is divided into 100 sec bins |
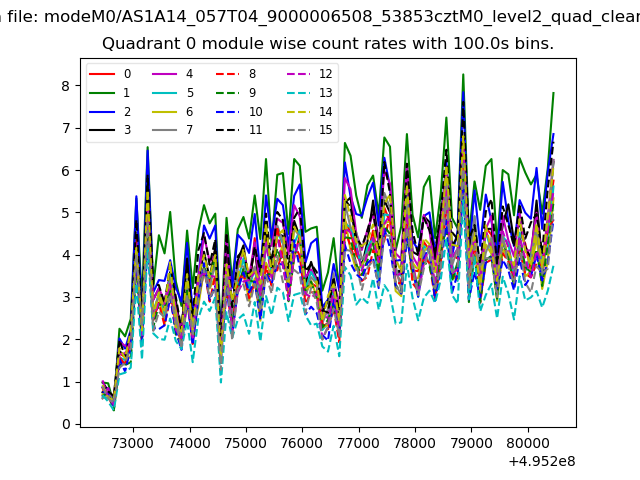 |
 |
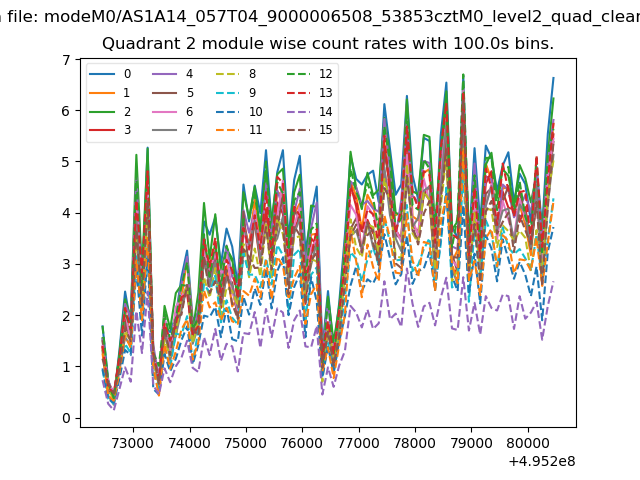
| Module-wise count rates for Quadrant B Data is divided into 100 sec bins |
 |
 |
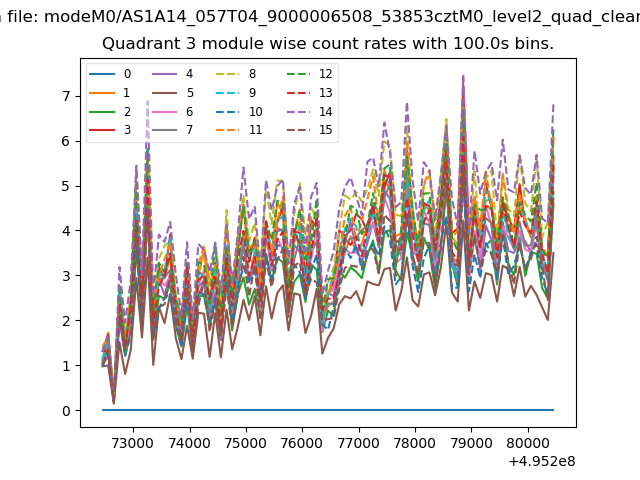
| Module-wise count rates for Quadrant C Data is divided into 100 sec bins |
 |
 |
| Module-wise count rates for Quadrant D Data is divided into 100 sec bins |
 |
 |
| Parameter | Plot |
|---|---|
| CZT HV Monitor |  |
| D_VDD | 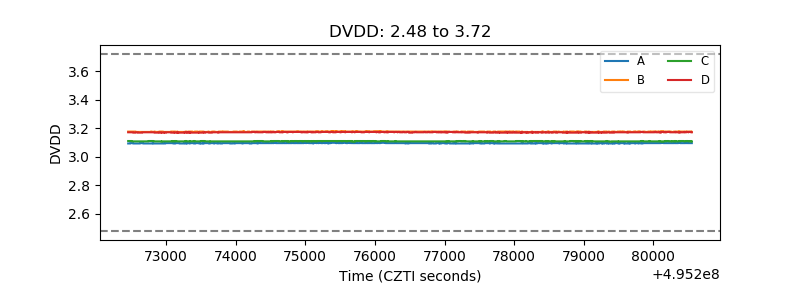 |
| Temperature 1 | 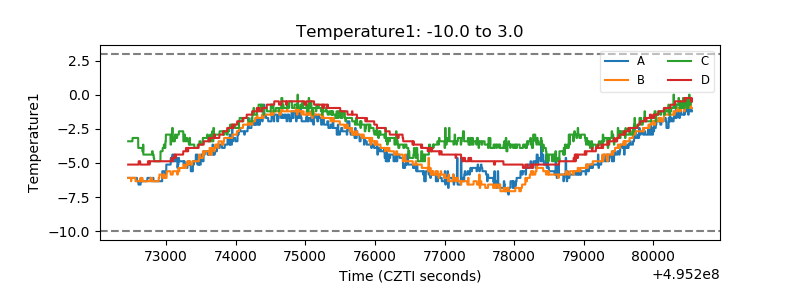 |
| Veto HV Monitor | 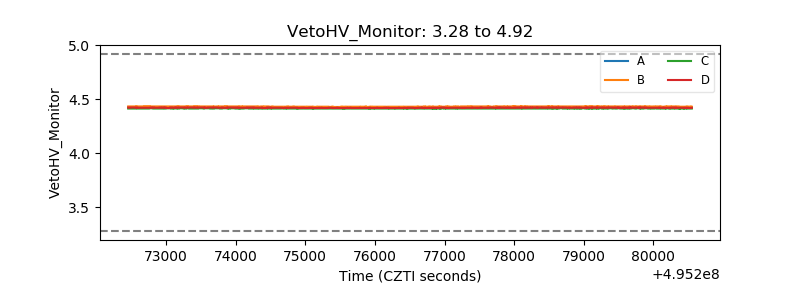 |
| Veto LLD | 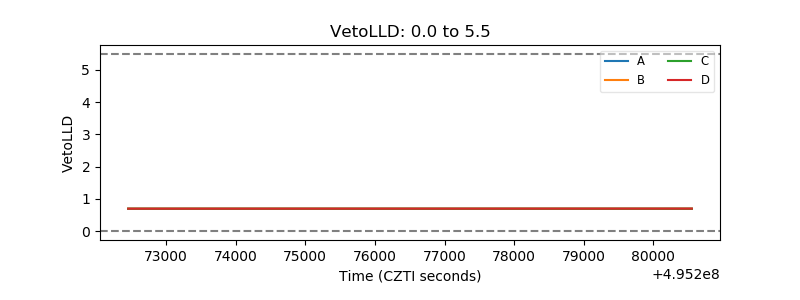 |
| Alpha Counter | 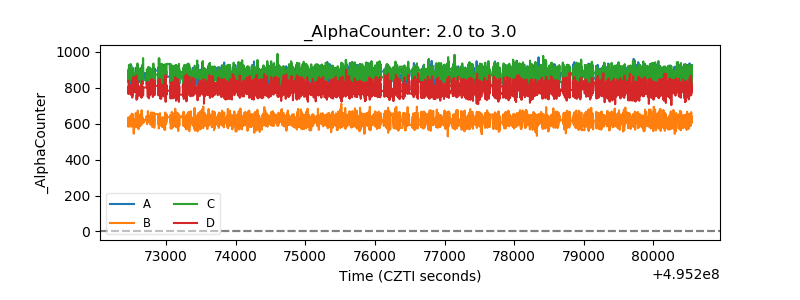 |
| _CPM_Rate | 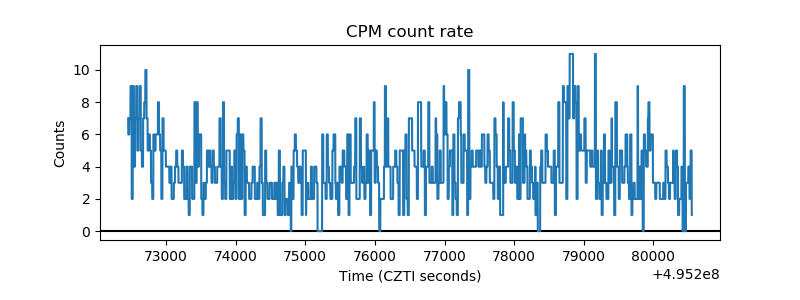 |
| CZT Counter | 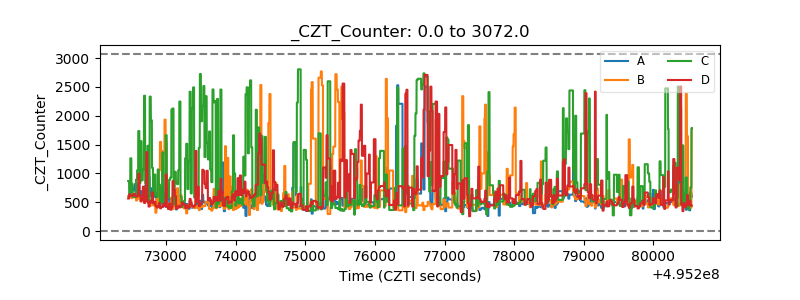 |
| +2.5 Volts monitor |  |
| +5 Volts monitor |  |
| _ROLL_ROT | 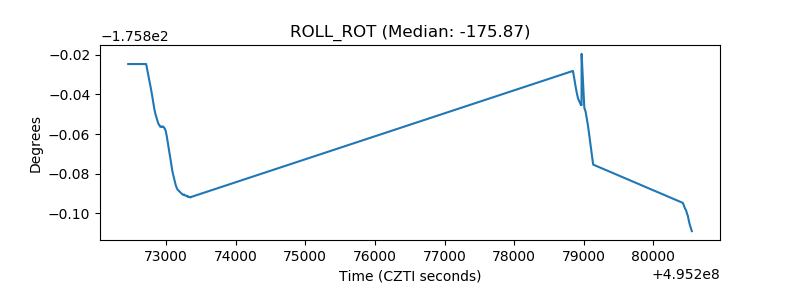 |
| _Roll_DEC | 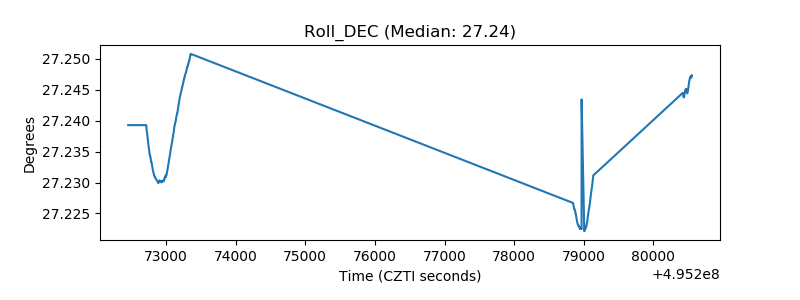 |
| _Roll_RA | 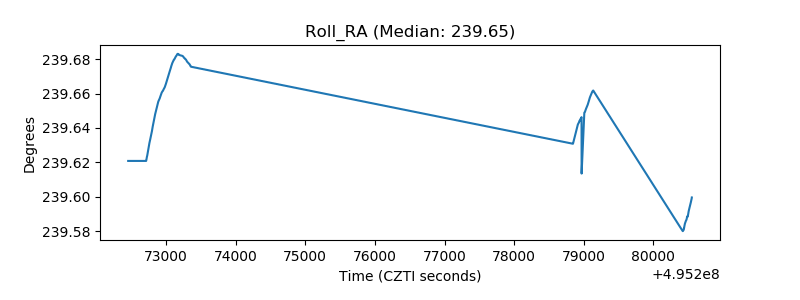 |
| Veto Counter | 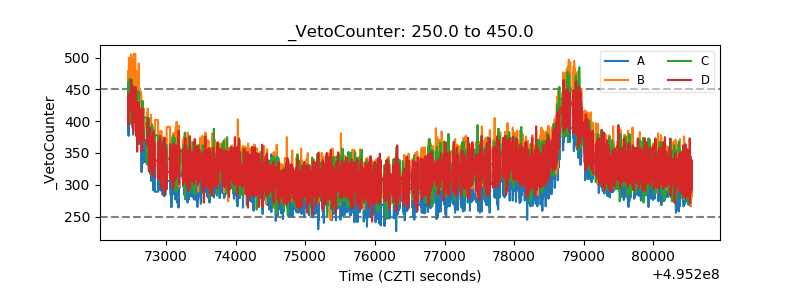 |